


At DASH, we shared how Datadog is helping teams strengthen security, meet compliance requirements, and scale governance across their infrastructure. This roundup looks at new features that make it easier to visualize risk and automate remediation.
We’ve launched tag-based Data Access Controls and secret scanning to protect sensitive data as well as new governance tools, such as the Governance Console and Fleet Automation. Teams can now surface hidden risks with Security Graph, detect issues earlier with Code Security and IaC Security, and enforce compliance with flexible resource policy templates. We’ve also enhanced our Cloud SIEM capabilities with anomaly detection for log content, sequence detection for multi-stage attacks, and scheduled rules for slow-moving threats.
Learn how these updates help your teams secure their cloud environments with confidence. Then, check out our keynote roundup for other major announcements, including:
Datadog Secret Scanning enables developers and security engineers to detect and validate embedded secrets in source code, protecting their organizations against one of the most common root causes of security breaches. By automatically scanning code changes on every push, Secret Scanning alerts developers to hard-coded secrets and allows security teams to enforce policies to prevent vulnerable code from being merged and deployed. Powered by the same detection engine as Sensitive Data Scanner, Secret Scanning includes dozens of out-of-the-box rules for the most commonly used third-party APIs and cloud providers. Secret Scanning is now in Preview; to request access, fill out the Preview form.
Sensitive Data Scanner now detects human names in logs using machine learning. Currently in Preview, this capability helps identify sensitive data that is often missed by traditional pattern-based scanning, such as customer names in support tickets, error traces, or internal chat logs. The ML model is hosted within Datadog, with no training or tuning required. You can choose to redact, hash, mask, or flag matched names to reduce exposure and support compliance with privacy standards like GDPR and HIPAA. Request access to the Preview here.
Enterprise customers need a way to make sensitive data within Datadog—PII, financial information, vulnerabilities, etc.—private in order to meet their security, regulatory, and internal compliance requirements. Datadog Data Access Controls provides customers the ability to collect sensitive data to enrich their monitoring and security work with real business context while using tags to restrict which data their users can query in order to protect it. Data Access Control is currently in Limited Availability. To get early access to this feature, fill out this interest form, or reach out to your Customer Success Manager for more information.
Sensitive Data Scanner now supports role-based unmasking in logs, giving teams granular control over who can view masked sensitive data in logs. Security teams can investigate fields like IP addresses and access tokens, while DevOps engineers and developers see the same logs with sensitive information masked. Authorized users can unmask values on demand within Datadog, with all access logged via Audit Trail for accountability. Request access to the Preview here.
Datadog Sensitive Data Scanner helps teams quickly identify and prevent sensitive data leaks, remaining compliant with their industry’s regulations. Sensitive Data Scanner is now also able to scan Amazon RDS instances for sensitive data. Findings are surfaced in a prioritized manner and offer an easy path to investigate and action upon directly in the AWS console. See our documentation to get started.
FIPS compliance is a critical part of meeting the security requirements of the Federal Risk and Authorization Management Program (FedRAMP), a government-wide program that standardizes security assessment for US federal agencies. Now you can achieve real-time observability across your infrastructure, applications, and services with secure, Federal Information Processing Standard (FIPS)-compliant monitoring using the Datadog FIPS Agent. This enhanced version of the Datadog Agent is natively built with cryptographic modules that meet FIPS 140-2 requirements to automatically encrypt data, helping you stay aligned with FedRAMP and other federal security standards.
To get started, install and configure the FIPS Agent according to the documentation, or see our blog post for more tips on monitoring highly regulated environments.
CISOs and security teams today struggle with growing volumes and complexity of security logs in a wide array of formats, making data normalization cumbersome for smaller teams with limited resources. The Open Cybersecurity Schema Framework (OCSF) offers an open source, vendor-neutral schema to standardize security event data, improving interoperability and threat correlation across tools. Datadog Observability Pipelines now includes native support for OCSF transformation, which further enhances its capabilities for aggregating, processing, and routing logs efficiently. OCSF support in Observability Pipelines empowers teams to build intuitive security workflows, easily enrich and remap logs, and direct standardized event data to their preferred security platforms. To learn more, check out our blog post.
Cloud Security’s revamped Misconfigurations and Identity Risks explorers allow you to more quickly drill down into security findings and begin remediating. With performance improvements, a consistent interaction pattern across all explorers, and direct access to the findings from the explorer, these updated explorers help reduce the overhead of commonly taken actions in their daily workflows. The ability to group by team helps you identify where issues are concentrated, and you can now chain group-bys to answer questions like, “Which teams have publicly accessible S3 buckets?”
The new Misconfigurations and Identity Risks explorers are now available in Preview; contact your Customer Success representative to get started, or learn more about Cloud Security in our documentation.
Datadog Cloud Security now offers out-of-the-box misconfiguration detections for Amazon Bedrock, helping organizations secure their generative AI workloads without slowing innovation. These detections identify critical risks—such as unauthorized model access or insecure data paths—and prioritize them based on infrastructure context for faster, more accurate response. Integrated remediation suggestions, contextual insights, and compliance tracking make it easy to detect and fix issues while supporting evolving regulatory standards. With integrations with more than 100 AWS services and automated security posture monitoring, Datadog provides a streamlined, proactive approach to securing cloud-native AI environments. Read our blog post for more information.
Understanding how cloud resources, identities, and permissions interconnect is critical for detecting hidden risks and responding to incidents effectively. But in complex environments, tracking these relationships manually or across fragmented tools is time-consuming and error-prone. Security Graph, now available in Preview, enables security, platform, and operations teams to visually explore their cloud environments, trace trust paths, and uncover misconfigurations or privilege escalation risks in real time. By unifying identity, configuration, and security context into a graph model, Security Graph helps you detect and remediate potential threats faster. Learn more in our blog post and request access to the Preview here.
Cloud Security’s revamped Summary page consolidates key security metrics across your infrastructure. Here, you can find clear next steps to increase your scanning coverage, review claimed reasons for muting of security findings, and identify worst offenders and top performers across teams, services, cloud accounts, and environments. Along with consolidated existing sections of the overview page, these insights allow CISOs and security managers to evaluate their cloud security program without having to dig through the details. To get started with Cloud Security, check out our documentation.
The new Cloud Security Summary page is now available in Preview; contact your Customer Success representative to get started.
Datadog IaC Security provides end-to-end coverage of IaC configurations across your cloud environment, helping you detect and remediate security issues before they reach production. It integrates seamlessly into developer workflows to offer a unified view of findings across code and cloud, including one-click remediations for over 180 different findings. With IaC Security alongside Cloud Security, Code Security, and other Datadog products, you can manage all of your detection rules in a single platform.
Learn more about Datadog’s approach to IaC security in our blog post, and request access to the Preview here.
Datadog Code Security integrates security directly into your development workflow, from IDEs and pull requests to CI/CD pipelines and production environments. By combining the benefits of early detection with runtime context, Code Security identifies and prioritizes the most pressing risks in both first-party, custom code, and third-party libraries. These capabilities enable your teams to significantly reduce alert fatigue, collaborate efficiently, and remediate critical vulnerabilities faster.
To learn more, read our blog post.
The updated Cloud SIEM Overview page is designed to surface more insightful security metrics and useful actions for security analysts, security engineers, detection engineers, and security managers. With this new page, teams can better understand what they need to pay attention to and have quick access to powerful tools directly from the front page of Cloud SIEM. Drive more action and be better informed about threats in your environment by signing up today.
Contact your account team to get access to this Preview, and visit our documentation to learn more about Datadog Cloud SIEM.
Security teams can now edit default and partner rules directly in Datadog Cloud SIEM, with no cloning required. You can override key fields like severity, playbook, and rule name, and even extend the query logic—all while continuing to receive updates from Datadog Security Research. This gives teams the flexibility to tailor detections to their environment without losing sync with default improvements.
Learn more in the documentation.
Security teams can now view detailed rule information in one click with the new Rule Side Panel in Datadog Cloud SIEM without needing to open the full rule editor. This intuitive panel provides a quick snapshot of everything you need to know about a rule—including conditions, suppressions, signal history, version changes, job runs, and more—all in one place.
To learn more, explore our documentation.
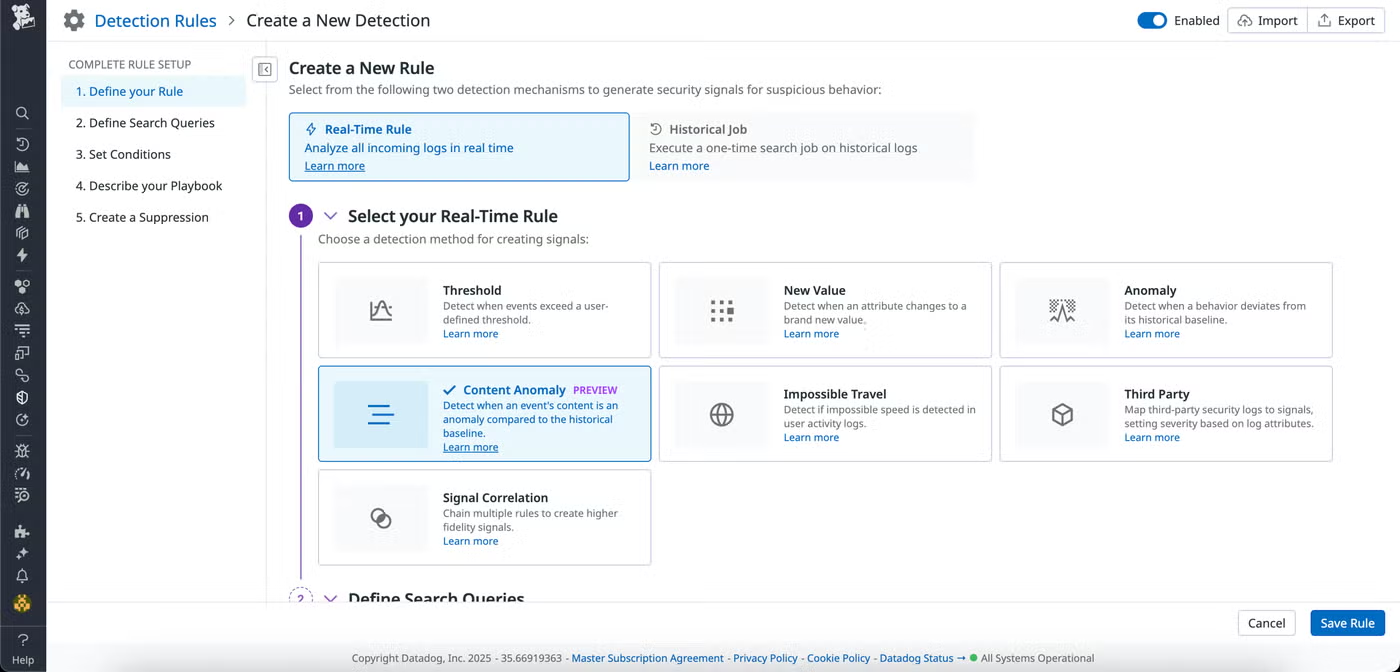
With Content Anomaly Detection, Datadog Cloud SIEM now provides deeper visibility into the content of your logs—not just their structure or volume. Whether you’re monitoring for unauthorized access, unexpected behavior, or subtle changes in configuration, this method helps you detect risks that other approaches might overlook. Add it to your detection rules to boost visibility into real risks. To learn more, explore our documentation.
Cloud SIEM Risk Insights enhances security operations by integrating entity types across major cloud providers. This integration allows security teams to uncover critical investigative data by linking Cloud SIEM signals with insights from Cloud Security, such as misconfigurations and identity risks. User and machine identities are accompanied by a risk score, enabling security teams to address the most pressing suspicious entities first. Explore the documentation to learn more.
Security teams can now use Scheduled Rules in Datadog Cloud SIEM to run detections on a defined schedule. This is ideal for identifying threats that require broader time frames or advanced query capabilities with calculated fields. Scheduled Rules add a powerful new threat detection model to Cloud SIEM’s existing real-time detection engine and help detect patterns like DNS tunneling or slow-moving brute force attempts that might not trigger real-time signals. Use Scheduled Rules to bring deeper analysis to your logs—sign up here for the Preview.
Security teams can now use Sequence Detection in Datadog Cloud SIEM to identify linked behaviors across multiple stages of an attack, such as initial access, privilege escalation, and data exfiltration. This method lets you define ordered sequences of events and control the combinations of conditions, users, and time frames that trigger a signal, helping surface coordinated activity that individual rules might miss. Sign up for the Preview and learn more in the documentation.
With the Common Security Data Model based on OCSF, Datadog Cloud SIEM automatically normalizes logs from sources like AWS CloudTrail, Okta, and GitHub into a unified schema, eliminating custom parsing and enabling consistent, scalable detection rules across your environment. This standardization accelerates investigations, supports cross-platform threat detection, and strengthens your security posture with schema-aligned data ready for analysis. Explore the documentation or try it to see how OCSF normalization helps you detect and respond faster.
Datadog Resource Policies, now in Preview, allows you to proactively govern your infrastructure with the ability to create custom policies with flexible logic on AWS, Microsoft Azure, or Google Cloud resources, such as “Amazon Lambda Functions should not run deprecated runtimes” or “Amazon ACM Certificates should be valid and in auto-renewal state,” without needing to write custom scripts. This helps you gain centralized visibility into whether resources across their organization are optimally configured and compliant with best practices, even as you adopt multi-cloud architectures and provision more resources.
Once you’ve created your policies, you can assess infrastructure compliance performance by team or any custom tag, so you can identify application teams with non-compliant resources and the lowest-performing teams you should reach out to. You can also create filtered views to share directly with application teams, so each team sees only the policies relevant to them
Request access to the Resource Policies Preview here, or learn more in our blog post here.
Resource Policies in Datadog enables teams to define internal standards for cloud reliability, operational excellence, security, and cost efficiency, so they can promote adherence to best practices across their infrastructure. Now, Resource Policies provides new out-of-the-box Policy Templates that cover reliability, cost optimization, operational excellence, and versioning, giving you actionable suggestions for optimizing resource configuration. You can also customize these pre-defined templates so they better fit your organization’s unique needs.
To see what out-of-the-box policies you can use to understand your infrastructure compliance gaps, request access to the Resource Policies Preview here.
When you use Policy Templates to set up Resource Policies that enforce your infrastructure best practices, the teams responsible for remediating can now run a Native Action for select use cases to make updates to the cloud console without leaving Datadog. Policy creators can also set detailed remediation instructions on a policy to guide remediating developers, reducing back-and-forth and shortening time to remediation. To enforce best practices and close the loop on misconfigurations more quickly, request access to the Preview here, or learn more in our blog post here.
The Cloudcraft Security Overlay shows you infrastructure misconfigurations in context to help you assess your security posture at a glance. This feature detects misconfigurations by evaluating resources against out-of-the-box rules from compliance frameworks like NIST, SOC 2, HIPAA, and more. These findings are overlaid on the Cloudcraft diagram to help you understand how the misconfigured resource impacts your broader environment. For example, the Security Overlay helps you analyze how an attacker might reach sensitive data or discover the downstream impact of a security issue. Once you’ve spotted a misconfiguration that you want to remediate, you can continue your investigation by clicking into a resource. This opens a side panel summarizing what happened and how to fix it—based on industry compliance standards—enabling you to immediately take action.
To learn more, read our dedicated blog post, or check out our documentation.
Customers can now rotate Datadog API Keys without restarting the Agent, enabling seamless key rotation without causing downtime or service disruptions. This feature simplifies coordination between teams managing API keys and Agents, eliminating the need for complex, time-consuming synchronization. It enhances security by allowing more efficient key rotations, which reduces the risk of unauthorized access to sensitive data. Ultimately, it boosts operational efficiency while safeguarding critical assets. To get set up, please see our documentation.
Some companies create and maintain multiple Datadog organizations within the same account to isolate data for a range of compliance, legal, and security reasons. But isolating critical observability data limits opportunities for collaboration, making it harder to achieve your observability goals. Now, cross-organization visibility enables customers to query metrics and logs data between Datadog organizations within the same account and get insights from multiple organizations in one place. Cross-organization visibility is generally available. See our documentation for more information.
Enforcing consistent governance practices across your Datadog resources often starts with good intentions. But many teams inherit tagging chaos, unclear accountability, and infrastructure that has scaled faster than their ability to manage it. Datadog Governance Console provides a real-time health check of usage across your Datadog account, spotlighting adoption gaps and spend hotspots, and surfacing best-practice recommendations to maximize value. With one-click guardrails, admins can quickly enforce the right policies and keep every team efficient, compliant, and in control as usage scales. Governance Console is in Preview. Reach out to your Technical Account Manager or Customer Success Manager for more information. Sign up for the Preview to get started.
Fleet Automation now integrates Audit Trail events for the Datadog Agent, enabling teams to centrally view critical Agent events such as configuration changes, upgrades, API key updates, installations, and support flares. This unified visibility reduces troubleshooting time by facilitating quick comparisons of historical configurations and monitoring for critical changes. With improved governance capabilities, teams can identify precisely when and from where modifications occur, ensuring consistent observability, reliable deployments, and predictable Datadog costs across their entire infrastructure. Visit our documentation to get started with Fleet Automation.
Fleet Automation’s new Agent upgrades feature simplifies the process of performing Agent software upgrades across your infrastructure. By centralizing Agent upgrades, it ensures you can deploy the latest Agent version with new features and security patches throughout your environments. The centralized visibility into upgrade status enables teams to deploy and verify success at scale, streamlining the process. Additionally, there’s no need to coordinate with other teams to gain access to hosts, which further improves operational efficiency. This feature eliminates the need for cross-team coordination and unifies the deployment process across all operating systems within a single tool. To learn more, see the documentation.
When it comes to observability, sometimes you don’t know what you don’t know. If you manage a fleet of dozens or hundreds of hosts, you want to make sure you have no critical blind spots, and ensure that you have the right monitoring tools—APM, Logs, Cloud Network Monitoring, Cloud Security, and so on—on each agent. The new Cloudcraft Observability Overlay shows exactly which agents have which Datadog products, overlaid on your live infrastructure diagram. This makes it easy to find infrastructure related to a specific app or service and ensure that you have the observability you need, where you need it. Blind spots are clearly visible—for example, hosts with no agent, or where a specific feature like APM is disabled on a host.
Beyond viewing this information, you can also upgrade agents or turn Datadog monitoring on and off directly from the diagram. Sign up for the new Upgrade Agent Preview and Manage Agent Configuration Preview to try these new features.
此内容由惯性聚合(RSS阅读器)自动聚合整理,仅供阅读参考。 原文来自 — 版权归原作者所有。