


Maxim Brown
This post is part three of a four-part series about monitoring the health and performance of Pivotal Platform (formerly known as Pivotal Cloud Foundry), focusing specifically on the Pivotal Application Service runtime. Pivotal Platform is now part of VMware Tanzu following VMware’s acquisition of Pivotal in late 2019.
So far in this series we’ve explored Pivotal Platform’s architecture and looked at some of the most important metrics for monitoring each cluster component. In this post, we’ll show you how you can view these metrics, as well as application and system logs, in order to monitor your Pivotal Platform deployment and the applications running on it.
Before diving in to how to collect them, it’s important to understand the different types of monitoring data that are available from a Pivotal Platform deployment. The following table breaks down these data types and how to access them:
| Log message type | Access method | |
|---|---|---|
| Pivotal Platform component metrics | Firehose | |
| Application logs | Firehose, Log Cache, or syslog drain* | |
| Pivotal Platform component system logs | syslog drain or component VMs | |
| * A syslog drain is an external service or endpoint that receives log messages in the syslog standard format. | ||
In this post, we will cover ways to collect these types of data. We’ll go over using:
For the metrics and logs available from the Firehose and Log Cache, remember that PAS’s Loggregator system packages information using the dropsonde protocol, in a process called “marshalling.” Marshalling data into dropsonde involves categorizing messages into envelopes based on the event type (the type of monitoring data that a message represents), and wrapping each message with classifying metadata. As a result, all messages coming off the Firehose are standardized into the same format but carry different metadata that allows them to be decoded, or unmarshalled, into their respective data types downstream:
| Loggregator event type | Dropsonde envelope | Description |
|---|---|---|
Gauge | ValueMetric | Pivotal Platform component metrics representing a value at a specific moment in time |
Gauge | ContainerMetric | Metrics tracking resource utilization for the Garden containers running applications |
Counter | CounterEvent | Pivotal Platform component metrics representing an incrementing counter |
Timer | HttpStartStop | Application log messages recording the lifecycle of HTTP requests |
Log | LogMessage | Application log messages written to stderr or stdout |
The following is an example of a Firehose message from the Firehose plugin. You can see the dropsonde event type (ContainerMetric) as well as other metadata such as a timestamp and the name of the PAS component that emitted it (the cell Rep):
origin:"rep" eventType:ContainerMetric timestamp:1538745163443777235 deployment:"cf" job:"compute" index:"542240fa-abc2-4961-99ed-682977b62b9e" ip:"10.0.4.38" tags:<key:"source_id" value:"693c90af-a273-4c58-a053-b90fea4fa377" > containerMetric:<applicationId:"693c90af-a273-4c58-a053-b90fea4fa377" instanceIndex:0 cpuPercentage:0.30435965342458493 memoryBytes:429666304 diskBytes:244805632 memoryBytesQuota:1073741824 diskBytesQuota:1073741824 >
Component metrics are, naturally enough, metrics that are emitted by the various Pivotal Platform components. They are messages tagged as ValueMetric, CounterEvent, or ContainerMetric types. They cover any of the key metrics covered in part two, including BOSH VM system metrics. So these types of messages would include, for example, data on Gorouter latency, or disk usage for your component VMs. Component metrics also include any metrics sent to Loggregator by add-on services deployed on your cluster, such as Redis or Pivotal Healthwatch. Note, however, that not all add-on services emit metrics.
Application logs are messages tagged as HttpStartStop or LogMessage. Application logs within PAS cover both log output from the application code itself, written to stdout or stderr, as well as logs produced by processes running on PAS components that are involved in running and managing the application. So application logs include, for example, Cloud Controller staging logs when an application is pushed, or Gorouter logs reporting HTTP requests for an application.
Component system logs are logs related to a PAS component’s internal system processes. They are written to log files stored on the component VMs and are not collected by Loggregator, so they are not available from the Firehose. Instead, they are streamed from the components via rsyslog and can be accessed from a syslog drain.
In this section, we will cover several monitoring tools that pull information off the Firehose. These either use the cf CLI—the Cloud Foundry command line tool—or are available as add-on services that operators may install from Pivotal Network.
Different monitoring tools may provide access to different subsets of Firehose data, which might be of interest to different parties. Below, we will look at tools that are primarily for operators to track indicators of cluster health, and others that offer developers insight into the performance of their applications. We will also go over third-party nozzles, which can provide more customized or specific monitoring solutions.
Operators are responsible for monitoring and maintaining the health and performance of the Pivotal Platform cluster and ensuring that developers and end users are able to deploy and access applications. As such, the platform metrics covered in part two of this series are especially valuable to operators, who can access them using the following monitoring tools:
The Firehose plugin provides access from the cf CLI to the full Firehose data stream. Install the plugin by first adding the plugin repository (you can skip this step if you have already added the repository to install other plugins):
cf add-plugin-repo CF-Community http://plugins.cloudfoundry.org
Then, install the Firehose plugin:
cf install-plugin “Firehose Plugin” -r CF-Community
Once the Firehose plugin is installed, it offers two commands to tail Firehose data:
cf nozzle streams all available Firehose messages.cf app-nozzle <app-name> streams application logs and container metrics related to a specific application.As even a few seconds of output will demonstrate, filtering the Firehose stream is necessary for making any sense out of the data. Both commands will prompt you for what type of message to stream, using the event types outlined above (e.g., ValueMetric, LogMessage) as filters. Or, you can include a --filter <message-type> flag. For example, the following will stream all the ValueMetric messages from your deployment:
cf nozzle --filter ValueMetric
Without selecting one of these types, both cf nozzle and cf app-nozzle will stream all log messages combined:
origin:"cc" eventType:ValueMetric timestamp:1532457529878708929 deployment:"cf" job:"control" index:"8af621a8-a93e-4d0a-999f-51326a485a4c" ip:"10.0.4.23" valueMetric:<name:"requests.outstanding" value:1 unit:"counter" >
origin:"gorouter" eventType:ValueMetric timestamp:1532457529924320083 deployment:"cf" job:"router" index:"b2862fac-7e42-493c-9592-8756281e568b" ip:"10.0.4.26" valueMetric:<name:"latency" value:52 unit:"ms" >
origin:"gorouter" eventType:HttpStartStop timestamp:1532457529924022817 deployment:"cf" job:"router" index:"b2862fac-7e42-493c-9592-8756281e568b" ip:"10.0.4.26" httpStartStop:<startTimestamp:1532457529871991963 stopTimestamp:1532457529924009068 requestId:<low:4920818481314641058 high:12858159354617128031 > peerType:Client method:GET uri:"http://api.sys.pcf.cf-test.com/v2/apps/0d06d7ed-1ab2-4ccc-9145-9c863667241f" remoteAddress:"130.211.1.101:59009" userAgent:"datadog-firehose-nozzle" statusCode:200 contentLength:15690 instanceId:"e05f390c-ed39-4283-73d0-11c561b7e485" forwarded:"35.237.192.216" forwarded:"35.186.213.131" forwarded:"130.211.1.101" >
origin:"gorouter" eventType:ValueMetric timestamp:1532457529927120531 deployment:"cf" job:"router" index:"b2862fac-7e42-493c-9592-8756281e568b" ip:"10.0.4.26" valueMetric:<name:"route_lookup_time" value:2375 unit:"ns" >
origin:"garden-linux" eventType:ValueMetric timestamp:1532457529944474048 deployment:"cf" job:"compute" index:"8e254030-3a9e-4abf-969e-5d89ecdb3762" ip:"10.0.4.24" valueMetric:<name:"numGoRoutines" value:395 unit:"count" >
All messages displayed by the Firehose plugin share a similar structure. Each message includes the following:
Pivotal Healthwatch is an add-on that ingests and transforms data from the Firehose to surface a predefined set of platform metrics and status checks. The data displayed in the Healthwatch UI—accessible at healthwatch.sys.<your-domain>.com—are key performance indicators (KPIs) that Pivotal has identified as particularly important for monitoring deployment health.
In addition to visualizing these KPIs, Healthwatch uses them to calculate additional metrics that make monitoring Pivotal Platform deployment health and performance easier. For example, Healthwatch uses standard deployment metrics to generate a new metric, healthwatch.Firehose.LossRate.1M, which provides an at-a-glance indicator of any Firehose log loss on the platform.
Installing Healthwatch deploys a number of applications that read data from the Firehose, serve a Healthwatch UI, and run periodic health and uptime checks on various components—including the BOSH director and the Ops Manager. Healthwatch also performs smoke tests on several cf CLI commands to ensure they are working properly.
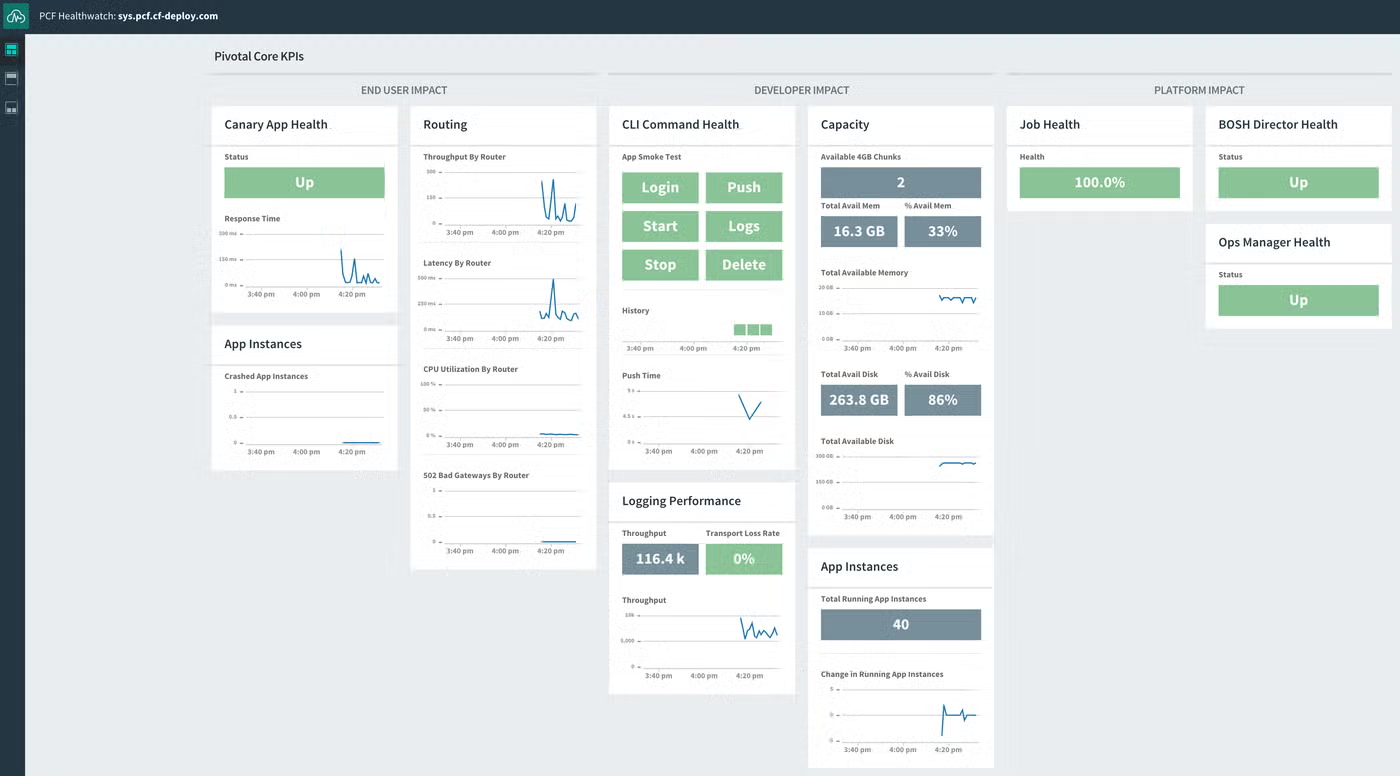
Pivotal Healthwatch generates several dashboards to visualize KPIs. The main dashboard displays core KPIs that have the biggest potential impact on end users, developers, and the platform itself. For example, Healthwatch displays the number of crashed application instances as a core KPI for end users.
Additional dashboards have more detailed breakdowns of health checks and expanded selections of performance metrics grouped by function. They include dashboards for routing, the User Account and Authentication server, logging performance, and others.
Unlike CLI tools like cf nozzle, which don’t persist any of the data they display, Healthwatch stores its metrics and status checks in a database, where they are accessible over a 25-hour retention window. Pivotal Healthwatch also forwards its metrics on to the Firehose stream, tagged with origin:"healthwatch". Those metrics are then accessible via the Firehose plugin or third-party nozzles.
Operators can use the Pivotal Healthwatch API to create alert configurations for Healthwatch metrics. These configurations instruct Healthwatch to trigger an alert when a given metric’s value crosses set thresholds. When used in conjunction with another Pivotal add-on, Pivotal Event Alerts, it’s possible for operators to be alerted by automated emails, Slack messages, or webhooks when an alert is triggered.
Each alert configuration contains the originating component, the name of the metric, and threshold values for critical and warning alerts. It also requires a threshold type, which specifies whether Healthwatch should trigger the alert if the metric value is above (UPPER), below (LOWER), or not equal to (EQUALITY) the provided threshold values.
To view or create an alert configuration, operators can submit GET or POST requests to their Healthwatch API endpoint. These requests query, create, or change alert settings using Spring Expression Language statements.
Below is an example of a request to view an alert configuration for the metric locket.ActiveLocks. Note that you need to include an authorization token for a UAA client with healthwatch.read for GET requests, or healthwatch.admin for GET and POST.
curl -G "healthwatch-api.sys.pcf.cf-deploy.com/v1/alert-configurations" \
--data-urlencode "q=origin == 'locket' and name == 'activelocks'" \
-H "Authorization: Bearer <token>"
The query returns a response showing that the alert is configured to trigger when the metric’s value is not equal to 4:
[{"query":"origin == 'locket' and name == 'ActiveLocks'","threshold":{"critical":4.0,"type":"EQUALITY"}}]
Healthwatch includes a number of out-of-the-box alert configurations that you can use or modify on a global or per-deployment basis. Then, you can select one or more of the alert configurations as targets for notifications via email, Slack, or custom webhooks, so that the appropriate people or teams are notified whenever an alert is triggered.
One of the primary selling points of Pivotal Platform is that it lets developers focus on their applications without worrying about the underlying infrastructure. Unlike the operator-centric tools outlined above, which focus on platform metrics, the following monitoring tools and services give developers access to application logs as well as metrics more specifically related to application access and container resources:
cf logs for streaming logs from an applicationcf logsThe cf logs command is a Cloud Foundry–native command line utility. The cf logs <app-name> command functions similarly to the Firehose plugin command cf app-nozzle <app-name> in that it streams application logs for a specific application. Unlike the Firehose plugin, though, cf logs does not include container metrics.
Below is example output from the command cf logs pcf-app, which tails logs from a Spring Boot application called pcf-app:
2018-07-23T19:21:12.79+0000 [RTR/0] OUT pcf-app.apps.pcf.cf-domain.com - [2018-07-23T19:21:12.590+0000] "GET /define?word=test HTTP/1.1" 200 0 171 "-" "Mozilla/5.0 (Macintosh; Intel Mac OS X 10_13_6) AppleWebKit/537.36 (KHTML, like Gecko) Chrome/67.0.3396.99 Safari/537.36" "136.275.2.566:61827" "10.0.6.56:61232" x_forwarded_for:"38.124.226.010, 37.226.214.171, 130.235.2.529" x_forwarded_proto:"https" vcap_request_id:"02cl32ee-3093-466c-5687-232z61954dc9" response_time:0.202286235 app_id:"b4fdb2ff-e0c9-45b3-9aa2-25a6041389eb" app_index:"1" x_b3_traceid:"8be948839f6fad8b" x_b3_spanid:"8be948839f6fad8b" x_b3_parentspanid:"-"
2018-07-23T19:21:12.79+0000 [RTR/0] OUT
2018-07-23T19:21:12.63+0000 [APP/PROC/WEB/1] OUT 2018-07-23 19:21:12.634 INFO 16 --- [nio-8080-exec-8] o.a.c.c.C.[Tomcat].[localhost].[/] : Initializing Spring FrameworkServlet 'dispatcherServlet'
2018-07-23T19:21:12.63+0000 [APP/PROC/WEB/1] OUT 2018-07-23 19:21:12.634 INFO 16 --- [nio-8080-exec-8] o.s.web.servlet.DispatcherServlet : FrameworkServlet 'dispatcherServlet': initialization started
2018-07-23T19:21:12.66+0000 [APP/PROC/WEB/1] OUT 2018-07-23 19:21:12.663 INFO 16 --- [nio-8080-exec-8] o.s.web.servlet.DispatcherServlet : FrameworkServlet 'dispatcherServlet': initialization completed in 28 ms
. . .
Each application log line streamed by cf logs has four core parts. The first is a timestamp that Loggregator prepends to the message regardless of whether the log message includes its own timestamp.
The second part is a code identifying the component that the application is interacting with. The code can be any one of the following:
API for the Cloud ControllerSTG for staging functions run by DiegoRTR for the GorouterLGR for LoggregatorAPP for logs that the application code emits (including any custom logs)SSH for logs related to a user SSH-ing into an application containerCELL for Diego cell logs about the containers and applications it is runningBecause a cluster may have more than one instance of a given component, the component code will also include which instance, starting with index 0, emitted the message.
The third part of each log message is OUT or ERR based on whether the log came from stdout or stderr. The final part is the log message itself.
So, in the example above, we can see that the first log message was emitted by the Gorouter, indicating that it is handling an HTTP GET request to the application. This is followed by a few log messages from the Spring Boot application itself indicating the initialization of the servlet.
While cf logs will tail the log stream from an application, using the --recent flag provides a dump of the 100 or so most recent logs the application has emitted:
cf logs pcf-app --recent
Like Healthwatch, PCF Metrics is a Pivotal monitoring add-on that installs a series of applications and components that ingest data from the Firehose and provide visualizations of metrics and logs within a web UI. But whereas Healthwatch gives operators a high-level overview of the deployment, PCF Metrics shows a specific set of metrics that focus on application performance and resource utilization. These include:
Along with these, PCF Metrics provides an application log stream and a trace explorer that displays request traces. For instructions on installing PCF Metrics, see its documentation.
Once you’ve selected an application to monitor, PCF Metrics loads a customizable dashboard that includes a set of default metric graphs as well as the log stream. You can add or remove charts to view other metrics and change the time frame to view historical information. (PCF Metrics retains data for up to two weeks.) You can visualize metrics aggregated across all application instances or on an individual instance.
A final Pivotal Platform monitoring add-on is Metrics Registrar, which gives developers the ability to emit custom metrics from their applications in a way that can be collected by Loggregator and made available for performance monitoring with PCF Metrics and autoscaling with Pivotal App Autoscaler. You can configure your application to send custom metrics either by:
In both cases, Metrics Registrar will convert custom metrics into Loggregator events so that they will be included in the Firehose stream.
There are a number of nozzles available from the Pivotal Services Marketplace as managed services that can be used with your deployment. Many of these are developed and maintained by various monitoring services or IaaS providers and serve to ingest Firehose messages into a specific platform for processing, visualization, and storage.
Like the Pivotal add-ons discussed so far, operators can install services via the Ops Manager. After downloading the service tile from Pivotal Network, operators upload the tile and any required BOSH stemcells into the Ops Manager, configure it, and deploy it to their cluster.
Log Cache is a component colocated on the Doppler servers that duplicates and stores the information coming from Loggregator. Unlike the Firehose data stream, which is constantly cleared to make room for new messages, the Log Cache persists data from Loggregator so that it may be queried on demand. When enabled via the Advanced Features of the PAS tile in the Ops Manager, Log Cache will retain messages for 15 minutes, and will return up to 1,000 recent messages when a developer queries the cache.
Operators and developers can access the Log Cache API either with the cf CLI plugin or via a RESTful interface, as outlined below:
Once you install the Log Cache plugin, you can use the following cf CLI command to access your logs and metrics:
cf tail <source>
In this case, <source> can be either an application’s GUID or the name of a PCF component. For example, you can request PCF metrics for your Cloud Controller instances with the command:
cf tail cc
This query would return a series of timestamped metrics like the following:
2018-10-02T13:43:26.87-0400 [cc] GAUGE requests.completed:1083365.000000 counter
2018-10-02T13:43:26.87-0400 [cc] GAUGE http_status.2XX:1082898.000000 counter
2018-10-02T13:43:26.87-0400 [cc] GAUGE requests.outstanding:1.000000 counter
2018-10-02T13:43:26.88-0400 [cc] GAUGE requests.outstanding:0.000000 counter
2018-10-02T13:43:26.88-0400 [cc] GAUGE requests.completed:1083366.000000 counter
2018-10-02T13:43:26.88-0400 [cc] GAUGE http_status.2XX:1082899.000000 counter
2018-10-02T13:43:26.89-0400 [cc] GAUGE requests.outstanding:1.000000 counter
2018-10-02T13:43:26.90-0400 [cc] GAUGE requests.outstanding:0.000000 counter
2018-10-02T13:43:26.90-0400 [cc] GAUGE requests.completed:1083367.000000 counter
2018-10-02T13:43:26.90-0400 [cc] GAUGE http_status.2XX:1082900.000000 counter
By default, cf tail returns the 10 most recent messages. Each message includes the following:
There are several flags that you can include with cf tail to focus your queries:
| Flag | Description |
|---|---|
--follow | Tails the stream in real time |
--json | Outputs messages in JSON format |
--lines | Sets the number of messages to return (default is 10) |
--start-time | Sets the start time of messages to return (UNIX timestamp) |
--end-time | Sets the end time of messages to return (UNIX timestamp) |
--envelope-type | Returns only messages of the provided envelope type |
--gauge-name | Returns only messages of type gauge with the provided metric name |
--counter-name | Returns only messages of type counter with the provided metric name |
To query the Log Cache programmatically, you can make API calls to its RESTful endpoint:
https://log-cache.<your-domain>/v1/read/<source>
As with the cf CLI, <source> can be either an application or component. You will need to provide a UAA authorization token that includes the doppler.firehose scope with each API request. You can also include optional query parameters to filter the response:
| Parameter | Description |
|---|---|
start_time | Sets the start time of messages to return (UNIX timestamp) |
end_time | Sets the end time of messages to return (UNIX timestamp) |
envelope_types | Returns only messages of the provided envelope type (may be called multiple times to return multiple types; note that log messages will be base64 encoded) |
limit | Maximum number of messages to return (limit is 1,000; default is 100) |
Below is an example of a full request for gauge messages for an application instance (identified by its GUID) and a portion of the resulting JSON response:
curl -s -H "Authorization: Bearer <token>" 'https://log-cache.sys.pcf.cf-deploy.com/v1/read/693c90af-a273-4c58-a053-b90fea4fa377?envelope_types=gauge&limit=3' | jq .
{
"envelopes": {
"batch": [
{
"timestamp": "1538588258669046676",
"source_id": "693c90af-a273-4c58-a053-b90fea4fa377",
"instance_id": "2",
"deprecated_tags": {},
"tags": {
"deployment": "cf",
"index": "4c38973d-450d-4135-9c76-98517919f760",
"ip": "10.0.4.37",
"job": "compute",
"origin": "rep"
},
"gauge": {
"metrics": {
"cpu": {
"unit": "percentage",
"value": 239.2020044624913
},
"disk": {
"unit": "bytes",
"value": 235376640
},
"disk_quota": {
"unit": "bytes",
"value": 1073741824
},
"memory": {
"unit": "bytes",
"value": 408858624
},
"memory_quota": {
"unit": "bytes",
"value": 1073741824
}
}
}
},
The tools and approaches outlined above allow you to collect all of the data that is aggregated and streamed via PAS’s Loggregator. Next, we’ll look at how to access the other potential source of monitoring data: logs that are shipped via rsyslog out to a syslog drain.
By default, Loggregator aggregates application logs and includes them in the Firehose stream. As we have seen, however, unless you use a nozzle to pull messages off the Firehose and send them to a managed service that retains the data, these messages are immediately dropped as new messages come through. The exception to this is deployments with Log Cache enabled, which provides limited persistence.
If an appropriate Firehose nozzle is not available, or if Log Cache is not enabled, another option for digesting and storing application logs is to convert them to the syslog protocol and stream them via rsyslog to an external service or dedicated server. This method lets you, for example, send application logs to a separate syslog server for archiving, or to a log management service that can ingest remote syslogs.
Forwarding application logs this way requires creating and binding a custom service instance to your application. This service instructs your application to shuttle logs to the Syslog Adapter. The adapter converts them into the syslog standard format. They can then be streamed via rsyslog to the specified syslog endpoint, or syslog drain. The endpoint might be a managed service available on the Pivotal Marketplace, an external logging service that is not available via the marketplace, or a user-provided destination such as a standalone syslog server.
There are two ways to create and bind a service to an application: via the Pivotal Apps Manager and the cf cups command. In both cases, you need to provide a name for the service and the endpoint URL, which is either the IP address and open TCP port of your external server, or the URL provided by the log management service. So, as demonstrated in the examples below, we can create a syslog drain service called application-syslog-drain that forwards application logs to a syslog server with an IP of 12.345.678.90 at port 514. We can then bind it to our application, pcf-app.
The Apps Manager acts as a wrapper for several cf CLI commands. Its web UI can be accessed from the URL apps.sys.<your-domain>.com. From the Apps Manager, you can view resource metrics, usage statistics, and logs for applications running on the deployment. You can also use the Apps Manager to manage your services or create a new user-provided service instance and bind it to an application.
After you create and bind the service to the application, you must restage the application with the cf CLI command:
cf restage pcf-app
cf cups commandThe cf create-user-provided-service (or cf cups) CLI command provides the same functionality as creating a service in the Apps Manager, but it does not require the admin credentials needed to log on to the Apps Manager. The following command creates the same syslog drain service as in the Apps Manager example above, which forwards application logs to an external syslog server by indicating its IP address and open TCP port:
cf cups application-syslog-drain -l syslog://12.345.678.90:514
Then, we can bind the drain service to our application, pcf-app:
cf bind-service pcf-app application-syslog-drain
Finally, we restage the application to commit the changes:
cf restage pcf-app
Note that you can also install the CF Drain CLI plugin, which accomplishes the same task with a simpler workflow.
Once the drain service has been bound to the application, you can view application logs on the external endpoint. For example, if your endpoint is a remote syslog server, your Pivotal Platform application logs will appear in the server’s syslog file.
System logs—that is, logs emitted by the internal processes of Pivotal Platform components—can be very useful for troubleshooting deployment issues. Pivotal Platform operators using the Ops Manager can access and download component syslogs without any additional configuration.
After selecting a tile in the Ops Manager, the Status tab will show high-level system information about the VMs running that service. From there, you can download a .zip file of all system logs for a given VM.
Downloaded logs for a particular VM are segregated by job. The below example shows logs from the Control VM, which in a Small Footprint PAS deployment includes many services that a standard deployment would run in separate VMs. In this case we can see stdout system logs for the Auctioneer job.
Downloading system logs from the Ops Manager is a simple way to retrieve troubleshooting data, but it’s impossible to view real-time logs in this way, and you must manually select which component’s logs you want to download. Another option is to forward system logs to a separate server or endpoint, much like you can with application logs, as explained above.
From the Pivotal Application Service tile in the Ops Manager, the System Logging screen allows you to use rsyslog to forward component system logs to a syslog endpoint, such as a custom syslog server or an external log management service. To configure syslog forwarding, you’ll need to provide the URL or IP address and the TCP port of the endpoint.
There are a few caveats to note about forwarding system logs from your cluster. First, unlike sending application logs via the Syslog Adapter, forwarding platform syslogs requires an endpoint that is configured to use the RELP protocol.
Second, the steps described above will only forward system logs produced by your Pivotal Application Service tile. That is, log forwarding will only apply to the core VMs of your deployment and not to any additional managed service VMs you might have installed. These services may have their own syslog forwarding settings that you will have configure separately. For example, below is the syslog configuration tab for the Pivotal Healthwatch tile.
Once you apply the log forwarding settings, you will see system logs for your platform VMs and any additional configured service VMs flowing to your endpoint. Below is a sample of the log stream from a component VM collected on an external syslog server. The syslog standard format includes the IP address of the VM that forwarded the log, and each log line includes a tag to indicate the job that originated it:
Jul 30 09:31:41 10.0.4.23 route_registrar: [2018-07-30 13:31:41+0000] {"timestamp":"1532957501.300919056","source":"Route Registrar","message":"Route Registrar.Registered routes successfully","log_level":1,"data":{}}
Jul 30 09:31:41 10.0.4.23 consul_agent: 2018/07/30 13:31:41 [WARN] agent: Check 'service:reverse-log-proxy' is now critical
Jul 30 09:31:42 10.0.4.23 consul_agent: 2018/07/30 13:31:42 [WARN] agent: Check 'service:cloud-controller-ng' is now critical
Jul 30 09:31:43 10.0.4.23 uaa: [2018-07-30 13:31:43.004] uaa - 15573 [pool-4-thread-1] .... DEBUG --- JdbcTemplate: Executing SQL query [select count(*) from users]
Jul 30 09:31:43 10.0.4.23 uaa: [2018-07-30 13:31:43.005] uaa - 15573 [pool-4-thread-1] .... DEBUG --- JdbcTemplate: Executing SQL query [select count(*) from oauth_client_details]
Jul 30 09:31:43 10.0.4.23 rsyslogd-2359: action 'action 17' resumed (module 'builtin:omfile') [v8.22.0 try http://www.rsyslog.com/e/2359 ]
Jul 30 09:31:43 10.0.4.23 rsyslogd-2359: message repeated 9 times: [action 'action 17' resumed (module 'builtin:omfile') [v8.22.0 try http://www.rsyslog.com/e/2359 ]]
Jul 30 09:31:43 10.0.4.23 rsyslogd-2007: action 'action 17' suspended, next retry is Mon Jul 30 13:32:13 2018 [v8.22.0 try http://www.rsyslog.com/e/2007 ]
Jul 30 09:31:44 10.0.4.23 consul_agent: 2018/07/30 13:31:44 [WARN] agent: Check 'service:reverse-log-proxy' is now critical
As we’ve seen, a Pivotal Platform cluster emits many different kinds of information, each of which can be vital to monitoring the health of the deployment and the applications running on it. In this post, we’ve explored some of the ways that you can collect or access the various logs and metrics available in Pivotal Platform.
Datadog’s Pivotal Platform integration enables operators and developers to collect Pivotal Platform deployment metrics and logs for use with Datadog’s powerful visualization, analytics, and alerting features. In the final part of this series, we’ll show you how you can integrate Pivotal Platform with Datadog to aggregate the full range of deployment and application metrics, as well as application and system logs, so that you can get deep visibility into your entire deployment in a single platform.
We wish to thank Amber Alston, Katrina Bakas, Matt Cholick, Jared Ruckle, and the rest of the Pivotal team for their technical review and feedback for this series.
此内容由惯性聚合(RSS阅读器)自动聚合整理,仅供阅读参考。 原文来自 — 版权归原作者所有。