


LLM-driven coding agents have a benchmark problem. An agent “maxxing” a synthetic benchmark tunes for whatever distribution the benchmark exercises, whether or not that matches production. Get the benchmark wrong, and the agent finds real speedups on the wrong hill. In production that can have devastating consequences.
To fix this, we built DODO (Datadog Observability-Driven Optimizer) by grounding benchmarks in live production telemetry. A benchmark agent reads two signals: a CPU profile from Datadog Continuous Profiler and samples of real production calls from Datadog Live Debugger. DODO generates the initial Go micro-benchmark using samples, then adjusts it iteratively until its execution shape matches the production profile with ≥98% similarity. High similarity means that improvements observed with the benchmark will translate to real production savings. Using production samples means that agents can observe data patterns that can be optimized. A simple optimization agent then uses that benchmark as a scoring function for code changes. Three such optimizations cut down more than 8% of one of our critical services’ total CPU cost, translating into O(10k) cores saved around the clock
In this post, we’ll show how production-grounded benchmarks help AI find optimizations that translate to real-world savings, how we generate those benchmarks from production telemetry, and what we learned applying the technique to one of Datadog’s largest services.
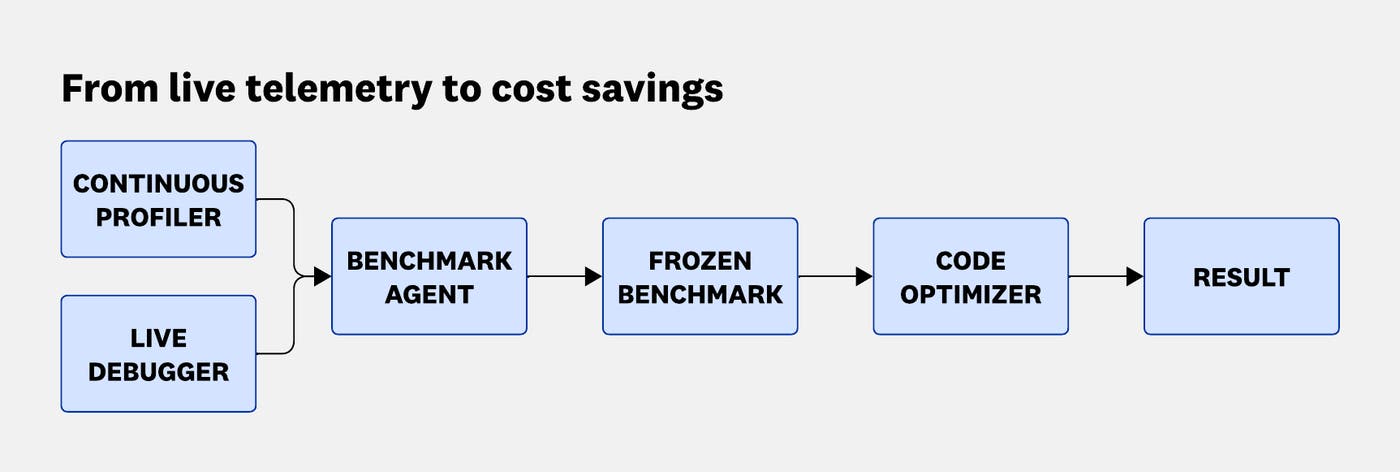
The gap between a synthetic benchmark and production comes down to two things: the data that the function operates on, and the way CPU time is actually spent when it runs. We close both gaps with observability signals from the live service we want to optimize.
The first signal comes from Datadog Live Debugger, which dynamically attaches a probe to the target function in the running production service. The probe samples invocations across all running instances, capturing the function’s inputs, outputs, and execution state for each invocation. We captured data from internal-only instances of the target service, with production data patterns, but disconnected from any customer data. Sampling across many instances yields a diverse set of real-world examples. We want variety in the kinds of inputs that impact CPU cost differently; statistical significance isn’t required, since the agent later fits the weight of each kind to match the production profile.
The second signal is a CPU profile collected via Datadog Continuous Profiler. Running across all production instances, it captures how CPU time is spent inside the target function during execution, including how much time is spent in the function itself and how much in each subroutine it calls, all the way down.
These two signals combine to define what a faithful benchmark looks like. The debugger data seeds a set of realistic test cases: concrete examples of how the function is invoked in production. The profile defines the execution shape the benchmark must reproduce when it runs those test cases: the relative time spent in each branch of the call tree. A benchmark agent draws on both. It uses the test cases to write the benchmark’s setup, and the profile as both target and feedback signal, scoring each candidate benchmark’s own CPU profile against production’s.
Once the benchmark exists, the optimization step is comparatively straightforward. We found that a simple LLM agent—one that reads the code (including realistic benchmark data), proposes a change, runs the tests, runs the benchmark, and repeats—produces strong results without elaborate scaffolding. This likely reflects how much progress recent LLMs have made at organizing their own work.
DODO targets Go services, but the design is not language-specific.
DODO consists of two loops: one that builds a production-grounded benchmark, and one that optimizes the code against it.
The benchmark agent runs an iterative loop: read the two production signals, write a candidate benchmark, run it, score its CPU profile against production’s, and use the divergences as feedback for the next iteration. The loop terminates when the similarity threshold is met or the turn budget is exhausted.
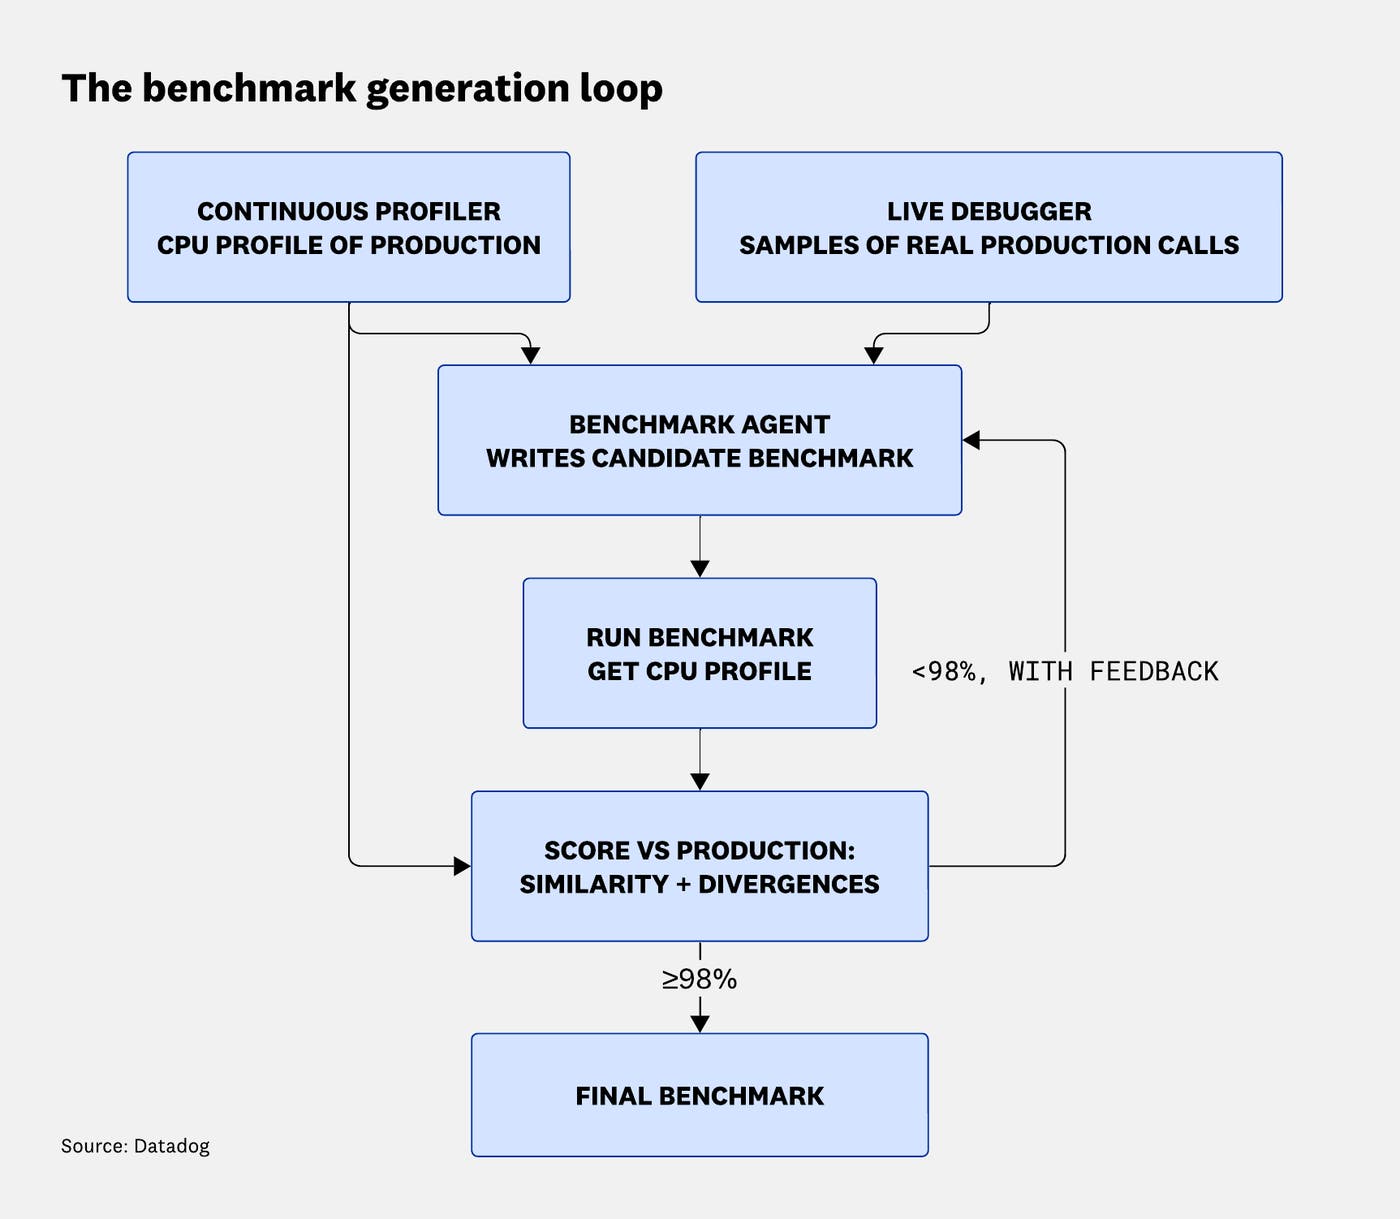
The benchmark agent is given a target function, a benchmark file path, and two streams of production signal:
A pruned CPU call tree rooted at the target function. We fetch an aggregated flame graph from the Datadog profiling API for the target service, filtered by CPU architecture, walk to the target function, and prune subtrees contributing less than 1%. This tree is included in the system prompt and used as ground truth by the evaluation tool.
Real invocations from live traffic. The agent places Live Debugger probes to capture production invocations of the target, including arguments and receiver state.
Capturing the receiver state is as important as capturing arguments. Many hot-path targets carry elaborate internal configurations: rule sets, pre-populated caches, and lookup tables. Reconstructing these from setup code is time-consuming and brittle. Direct state capture lets the benchmark agent assemble semantically valid test cases and inherit realistic call characteristics as a side effect.
Profile similarity is only meaningful if both sides are measured on the same hardware. Two normalizations help: architecture-specific function names are aliased to a canonical form, and internal frames within Go runtime functions are collapsed to their top frame. Raw CPU costs can’t be normalized away, though. An amd64 hash instruction and its arm64 equivalent have different latencies, and no amount of input tuning closes that gap. We sidestep the problem by fetching the production profile with a CPU-architecture filter and running the benchmark on matching hardware. Removing this hardware-parity requirement remains an open problem.
Given these inputs, the agent writes a single Go benchmark function. The evaluate_benchmark tool compiles it, runs it three times with CPU profiling, parses the resulting profile, prunes it the same way as it does the production tree, and computes a similarity score. The tool returns the score and the top divergences, labeled missing, extra, over, or under, as absolute percentages of total profile time. The agent can see exactly which call paths its benchmark over- or under-exercises.
The optimization agent receives the frozen benchmark from Loop 1 and standard code-reading and editing tools, plus run_tests and run_benchmark. Before the loop starts, the tests are run three times to fingerprint preexisting flakes, and the benchmark is run once to establish a baseline ns/op and CPU profile. Both are surfaced in the system prompt.
Each run_benchmark call re-runs the same command as the baseline, compares ns/op against the baseline, and snapshots the current code change as a numbered patch. The snapshot with the lowest ns/op so far is retained as the best observed state, so a regressing final edit doesn’t overwrite earlier gains.
We keep benchmark generation and code optimization as separate loops. The benchmark agent only writes the benchmark file, while the optimization agent only modifies service code and reads the benchmark. Fixing the benchmark before optimization begins prevents the agent from improving its score by changing the benchmark rather than the code under test.
Feedback is dense, not scalar. The evaluate_benchmark tool returns the similarity score and the top divergences as a sorted list of (path, prod%, bench%, gap) tuples. In practice, this is what lets the agent close gaps in one or two iterations: “callee X is 12% in production and 2% here, so I need more inputs that trigger the X branch.”
We wanted to evaluate DODO on a mature Datadog service, already heavily optimized over the years. We initially assumed there would be little left to gain in the hottest code, and that we would instead need to look across a larger number of less interesting targets to find a solid amount of savings.
We selected a larger number of targets (identified by an AI agent) and were surprised to see claims of significant speedups even for functions that had already been heavily targeted by earlier optimizations. So far, we’ve deployed some of those optimizations and confirmed the predicted savings, which already add up to more than 8% of the service’s total CPU costs.
Below, we list all attempted optimization targets from DODO’s initial evaluation. CPU percentage indicates the fraction of the total CPU cost consumed within the target function call. Speedup indicates savings relative to that function’s CPU cost.
| Target | CPU % | Speedup | Optimization found |
|---|---|---|---|
intern | 9.8% | 40% | Cache host tag IDs per host |
MergeTags | 11.5% | 4% | Sort halves independently, merge+dedup |
NormalizeTags | 7.5% | 22% | Fast ASCII case-fold path keyed to observed uppercase ratio |
HandleFromSortedTags | 3.7% | 15% | Direct buffer writes, skip append |
ComputeTagsHash | 3.2% | 27% | Stack-allocate hash buffer |
FilterPayloads | 2.7% | 75% | Map for O(1) literal filter lookup |
writeTagsetsMut | 2.0% | 76% | Bitset sort for bounded IDs |
filterTags | 1.1% | 82% | Bitmask rejection, in-place filter |
Two examples illustrate the kind of change the optimizer produced.
FilterPayloads. The tag receiver carries an elaborate production configuration of filter rules (a mix of literal, prefix, and regex matchers) that the benchmark agent captured directly from live traffic rather than reconstructing from the service’s dense setup code. The baseline profile showed 86.5% of time in a linear scan through all filter rules. The agent introduced O(1) literal lookup, and checked prefix matchers before regex matchers. The new type was threaded through four files across two packages.
writeTagsetsMut. The baseline showed 59% of time sorting tag IDs, and encoding them. The agent observed that the values are bounded to a small integer range, replacing the sort with iteration over a bitset and encoding optimized for small values.
The value of production grounding is clearest in NormalizeTags: Captured invocations revealed that roughly 25% of tags contain uppercase characters (timestamps containing T, version strings containing RC). The benchmark agent preserved that ratio. The optimization agent then found a fast ASCII case-fold path whose payoff depends on exactly that distribution. A synthetic benchmark would not have surfaced the opportunity.
In comparison, we estimate that it would have taken at least O(weeks) for our team to produce similar optimizations by hand, given the difficulty to reproduce representative traffic.
The results from DODO point toward a broader pattern: Production context is useful not just for optimization, but across the full developer lifecycle. We’re focusing on finding more ways it can help with pre-production validation and post-deployment analysis. Some directions we’re exploring:
Using Continuous Profiler and dynamic instrumentation to generate more direct validation cases
Seeding unit, acceptance, and synthetic tests from production inputs
For LLM applications, using production prompts for local inline CI or experimental validation
Using post-release trace aggregates and metrics anomalies to harden services over time
Using post-release session analysis for business success and user journey monitoring
Essentially closing the loop in development process and shortening the overall cycles spent in iterating over code
The benchmark grounding problem we solved for optimization is a specific instance of a more general question: How do you give an agent enough context about what matters in production to make decisions that hold up there? We think observability is the answer, and we’re continuing to build toward it.
If you’re interested in working on problems like this—using production telemetry to make AI systems more reliable and grounded—we’re hiring.
This work would not have been possible without the endless support from the Debugger, Profiling, and Metrics Intake teams. In particular, Andrew Werner and Andrei Matei have closely worked on making this approach feasible.
此内容由惯性聚合(RSS阅读器)自动聚合整理,仅供阅读参考。 原文来自 — 版权归原作者所有。