


As AI coding assistants dramatically inflate PR counts, commit frequency, and lines of code, the limitations of individual output metrics have never been more apparent. A developer can now produce significantly more lines per session, but higher volume doesn’t guarantee that the code is stable, maintainable, or successfully running in production. GitClear analyzed over 200 million lines of code and found that code churn nearly doubled following widespread AI adoption. AI coding assistants have made it clear that individual output metrics are completely decoupled from productivity.
To accurately assess productivity, you must measure the developer experience (DevEx), which includes the systems, workflows, tools, and feedback loops that define the developer’s working environment. In this post, we’ll share the specific approaches we use at Datadog to keep more than 3,000 engineers productive in an AI-augmented SDLC. We’ll also explain the following:
What DevEx is and why it’s important
How to measure DevEx
Which metrics to track
How developer sentiment data provides context that metrics alone can’t
Developer experience, commonly known as DevEx, describes how an organization’s systems, workflows, tools, and culture affect developer productivity. It reflects the lived experience of developers, including how they interact with, interpret, and feel about their work. A positive DevEx produces tangible organizational benefits, leading to faster development cycles, higher code quality, lower operational costs, reduced technical debt, and greater confidence to experiment and innovate.
The DevEx framework, developed by the same research team that gave us the SPACE framework, identified more than 25 sociotechnical factors that impact DevEx and categorized them into three dimensions: feedback loops, cognitive load, and flow state.
Feedback loops: The speed and quality of the responses to developer actions. It includes build times, test results, and code review turnaround.
Cognitive load: The mental effort required to complete a task. Reasoning about complex code, remembering important context, and becoming familiar with new systems all contribute to a developer’s cognitive load.
Flow state: The mental state that occurs as a result of energized, uninterrupted focus.
Datadog measures DevEx across each of these three dimensions and added a fourth to our internal framework in 2025: AI adoption and impact. AI adoption measures how frequently engineers use AI coding tools. We collect data through self-reporting and usage telemetry data. AI impact measures how AI coding tools affect each stage of SDLC, with data sourced from our system’s instrumentation.
DevEx and software delivery performance are interdependent and provide the most value when interpreted together. DORA’s software delivery metrics assess performance outcomes while DevEx signals clarify the underlying conditions that produce them. When DORA metrics are strong, developers benefit from faster feedback and fewer interruptions. When DevEx signals reveal friction in feedback loops or cognitive load, the resulting investments often improve DORA metrics.
Measuring DevEx requires two complementary practices:
Tracking system-level and workflow-level metrics to identify pain points in processes, tooling, and accumulation of cognitive load
Administering developer sentiment surveys to determine where organizational investments can have the greatest impact
At Datadog, we treat DORA metrics as a north star goal and instrument supporting metrics to identify workflow bottlenecks and investigate root causes. We send our Engineering Experience survey biannually to quantify developer experience. After analyzing results, we transparently share findings across the organization, clearly communicate the actions we’re taking to address issues and concerns, and commit to timelines.
System-level and workflow-level metrics assess the speed, reliability, and trustworthiness of development systems, the efficiency of code deployment processes, and the cognitive demands on engineers. We group these metrics into three categories: process efficiency, tool quality, and cognitive load.
Process efficiency metrics track how code progresses through the team, from review and integration to the collaboration that occurs between people and machines to support each change. We recommend tracking the following metrics:
Time to PR ready: The time developers spend preparing a change for review.
Review time (pickup time and approval latency): The time code waits before a reviewer engages with it, and the duration from initial review to approval. Idle PRs often cause developer frustration and increase change lead time.
Merge time: The wall-clock time between approval and merge.
Rollback-to-hotfix ratio: The percentage of change failure events resolved through rollback versus forward-fix hotfixes. A healthy ratio indicates that the platform supports safe rollbacks, which prevents engineers from scrambling to patch forward under stress. A low ratio suggests that the platform does not provide a reliable or safe rollback process.
Code review effectiveness: Whether code reviews identify issues before they reach production, or whether they function more as rubber stamps. Effectiveness can be approximated by tracking defects that originate in reviewed code and the proportion of review comments that result in substantive change.
In an AI-augmented SDLC, we also recommend tracking PR throughput, which is the rate of merges at the team and organization levels. It aggregates the first three phases of change lead time (time to PR ready, review time, and merge time), which essentially represents the pre-deployment portion of deployment frequency.
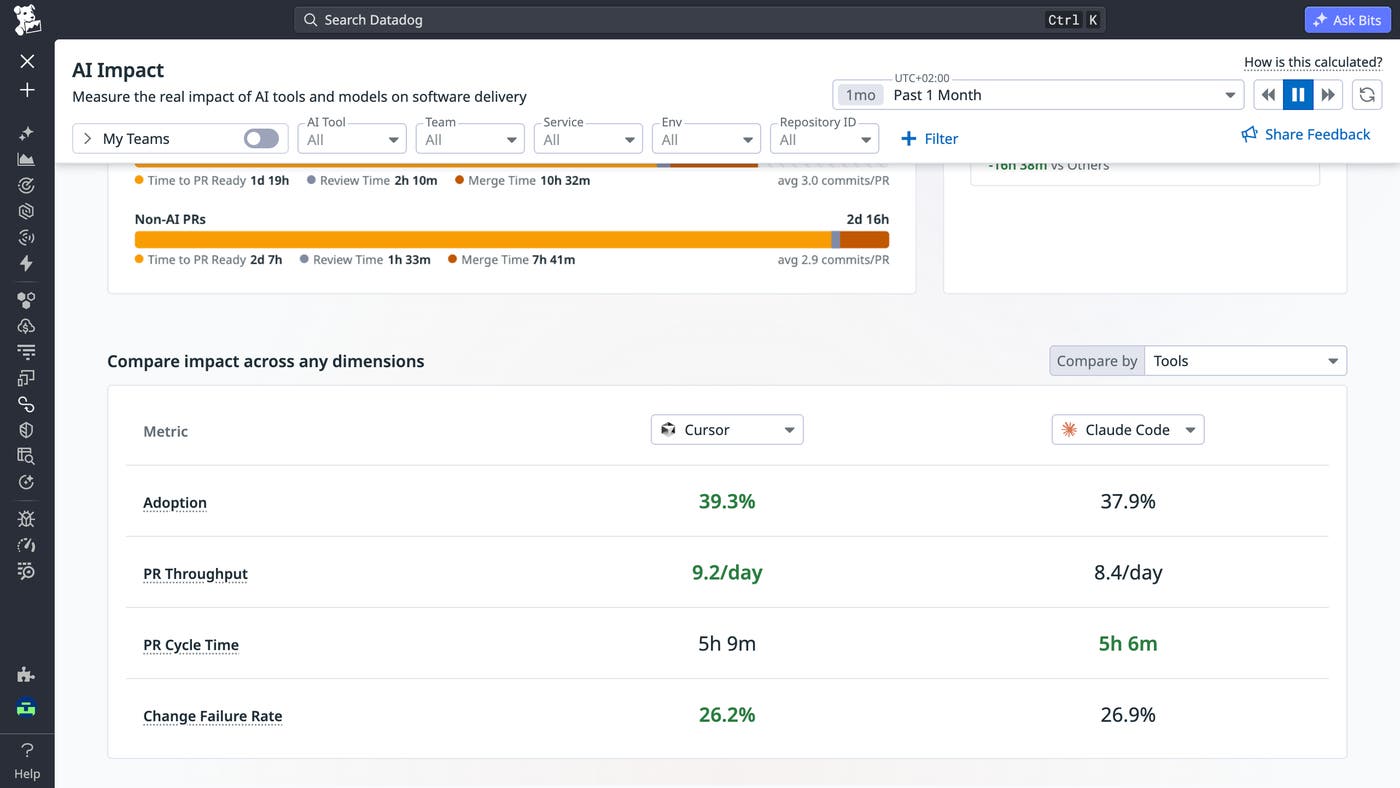
At Datadog, about 80% of PRs are now AI-assisted. AI-assisted PRs have slightly lower cycle times per change but much higher concurrency overall. In other words, AI does not significantly speed up individual changes, but enables developers to work on more changes simultaneously.
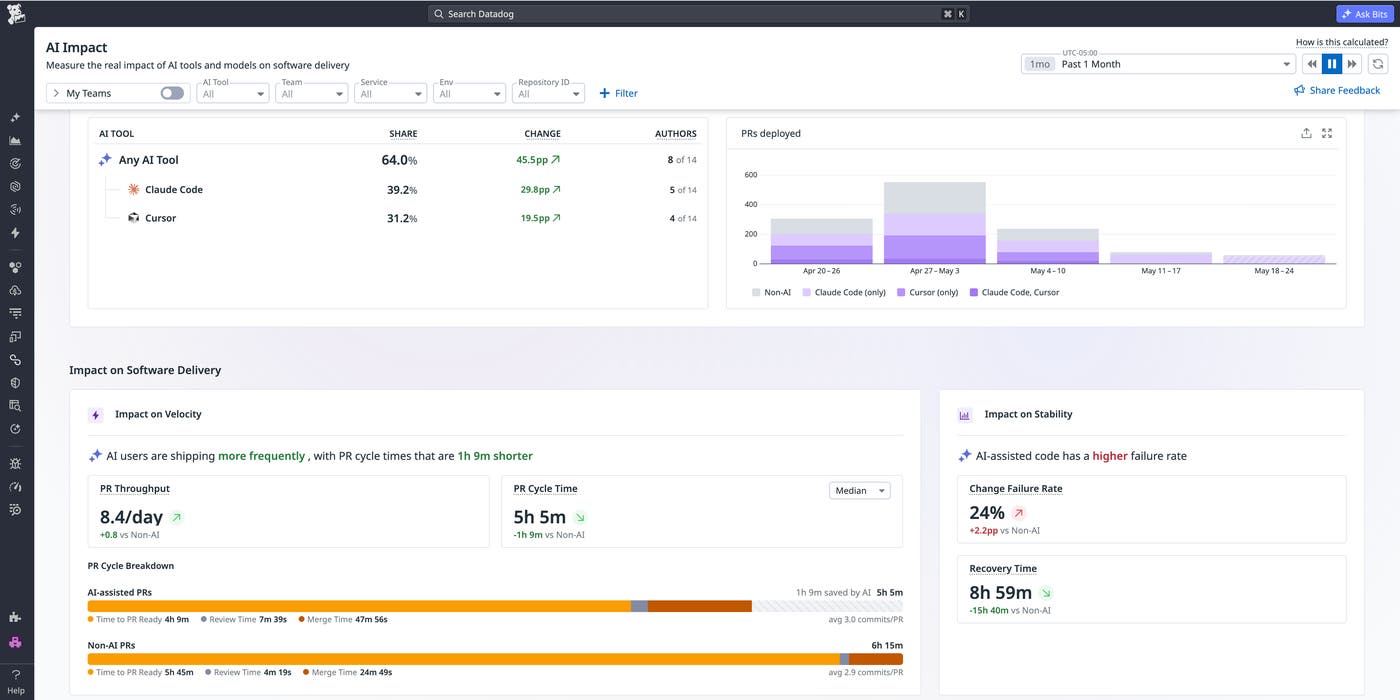
PR throughput highlights this benefit and shows the increased pressure on review, CI, and deployment. It also exposes a potential stability issue that aggregate DORA scores may hide. For example, if PR velocity increases tenfold but the incident rate per PR remains the same, the total number of incidents will also increase tenfold. To maintain the same uptime, you have to reduce the per-PR incident rate by the same factor.
Tool quality metrics measure the speed and reliability of systems that developers use to build, test, and ship. Poor tooling performance negatively affects all other DevEx indicators. We recommend tracking the following metrics:
Build and test duration: The amount of time developers wait for CI feedback. Slow builds are a commonly cited source of developer friction. Extended compile and test cycles disrupt flow, encourage batched work, and increase the adverse impact of each CI failure. As AI accelerates code generation, the gap between how fast a developer can produce changes and how fast build feedback returns becomes a significant bottleneck.
CI queue time: The time jobs spend waiting for a runner before pipeline execution. Although not included in pipeline duration metrics, queue time must be tracked because it directly affects change lead time. As AI increases PR volume, queue time is often one of the first indicators to degrade.
Flaky test rate: How often tests fail nondeterministically. Such failures erode the developer’s trust in the pipeline. When trust declines, developers may rerun jobs without investigation, overlook real failures, and ignore alerts. Flaky tests also disproportionately punish AI-generated changes, making it harder to distinguish between known issues and genuine regressions.
Code coverage: The percentage of code covered by automated tests. Sufficient coverage reduces bug risk and eases code review. In an AI-augmented SDLC, where reviewers handle more code, comprehensive automated coverage becomes even more critical. The test suite increasingly serves as the primary line of defense.
At Datadog, these signals guide our platform investments. Our H2 2025 Engineering Experience survey identified setup and clone overhead as a choke point in our main repository, which we anticipated would worsen as AI usage increased.
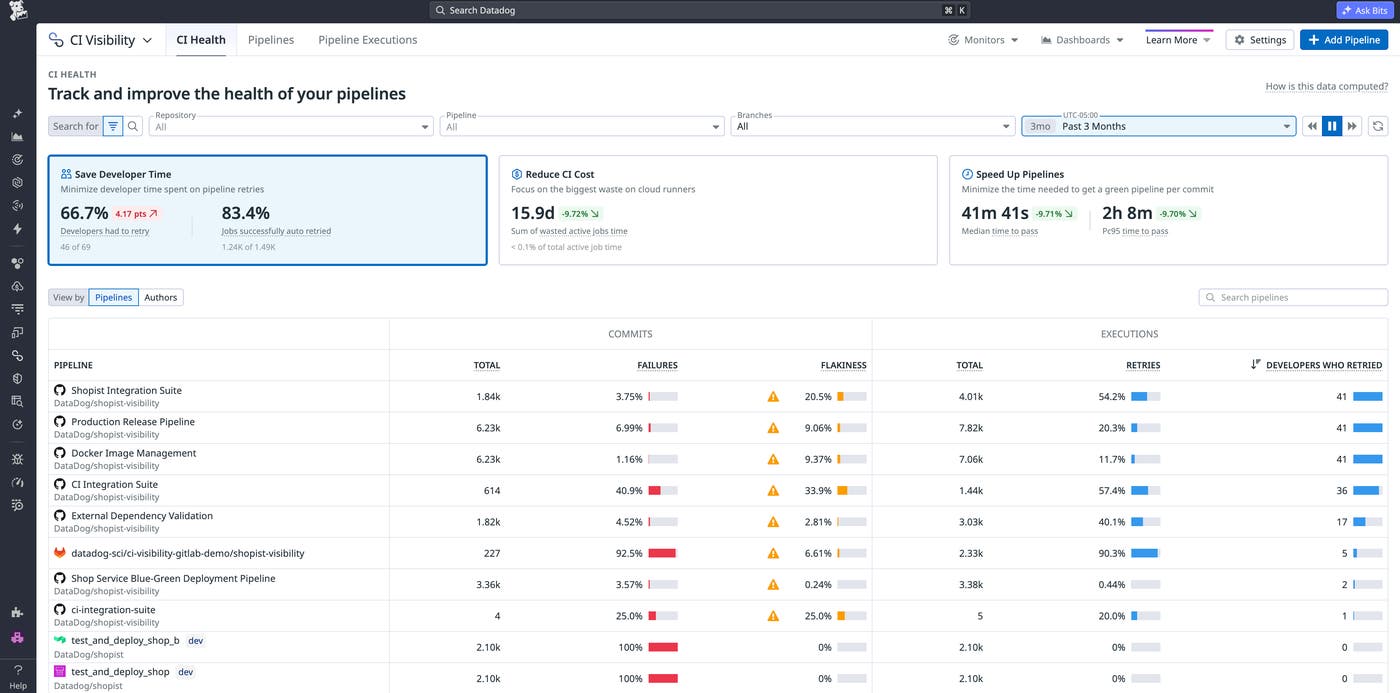
In response, we introduced persistent runners and improved CI speed by 50%, eliminating the cold starts that accumulate with higher AI-driven PR volume. Each minute saved per build restores valuable development time.
Cognitive load and flow state cannot be measured directly, but carefully selected proxies can identify where mental effort peaks and sustained focus is rarest.
Multi-agent orchestration: The number of distinct AI agents engineers use daily, the frequency of context switches, and the time spent managing these agents, as reported in surveys. While code-level complexity remains relevant for legacy systems and core libraries, the primary cognitive load now comes from orchestrating multiple AI agents. Developers must coordinate editor assistants, CLI agents, CI review agents, and domain-specific agents. Deciding responsibilities, validating outputs, resolving conflicts, and maintaining context across these agents has become the main source of cognitive load.
Discovery friction: The freshness of documentation and comprehensiveness of service ownership coverage. Every time a developer has to search for a runbook or track down a service owner during an incident, cognitive load increases.
Environment parity: The time engineers spend reconciling local configurations with cloud environments. Environment drift is a significant, often overlooked, source of cognitive load. Frequent debugging of environment-specific configuration drift imposes a mental burden that reduces focus on feature development.
Context switching and unplanned work ratio: The proportion of engineering time spent on reactive versus planned work. Incident-related interruptions and low system availability significantly impact developer experience. Frequent disruptions such as code freezes, CI test failures, CI outages, and source control outages make it difficult for engineers to regain focus. Our latest Engineering Experience survey found that incident-related toil has the strongest correlation with overall developer sentiment.
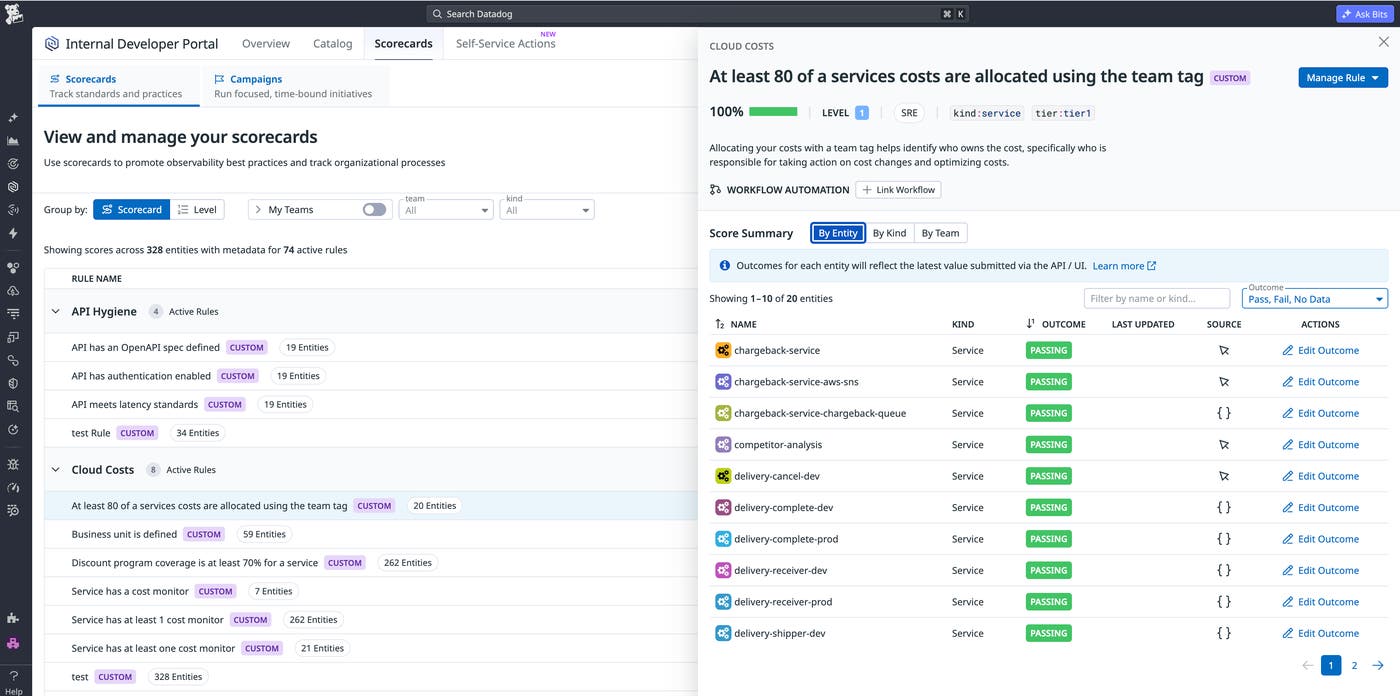
At Datadog, we work to reduce discovery friction. The Datadog Internal Developer Portal (IDP) features the Software Catalog, which maintains up-to-date records of service ownership and documentation. The catalog remains current by automatically discovering services instrumented with Application Performance Monitoring (APM) or Universal Service Monitoring (USM). IDP Scorecards then assess the completeness of ownership, documentation, and on-call information for each service.
The Datadog MCP Server further reduces discovery friction by giving AI agents direct access to live telemetry, logs, traces, ownership, and runbook context for relevant services. Instead of requiring engineers to search dashboards, ticketing systems, and documentation during incidents, the agent automatically gathers the necessary operational context. Using the Datadog MCP Server reduces the time engineers spend reorienting.
Aggregated sentiment data from periodic surveys provide insight into developer well-being, satisfaction with tools, and the level of effort required to ship safely. For example, a team that ships every day but reports frustration with builds is at high risk for burnout—a trend that cannot be identified by DORA dashboards alone.
When designing a developer experience survey, we recommend the following practices:
Use both structured questions and free-text responses: Quantitative signals can pinpoint where friction is concentrated, but they do not explain the developer’s perspective. In Datadog’s latest Engineering Experience survey, engineers submitted more than 2,400 free-text comments, highlighting emerging bottlenecks that weren’t apparent in metrics.
Segment results by team, repository, primary language, and AI adoption frequency: Aggregate scores hide acute pain. In our last survey, detailed analysis revealed that some teams experienced review time increases of over 500%, even though the global average remained stable. Without segmentation, these challenges would have gone unnoticed.
Collect AI adoption data from actual usage telemetry rather than relying solely on self-reporting: We tag each respondent based on their use of AI coding tools over the previous 90 days, which reduces perception bias and improves the reliability of before-and-after comparisons.
Share results and planned actions transparently with your engineering organization: Only request feedback if you are prepared to address it.
Communicating survey results is as important as the results themselves. Our dedicated DevEx team shares findings with the engineering organization using a clear approach: We lead with concrete commitments, pair each concern with a specific action, link to live dashboards to demonstrate accountability, and ensure a point of contact is available for direct messages. Internally, we follow the pattern: “You said X, we shipped Y, metric Z improved.” Engineers want to know that their feedback is both heard and acted upon.
In an AI-native SDLC, the limits of individual output metrics are no longer in question. By combining system-level and workflow-level signals with developer sentiment surveys, teams can better understand the factors that influence developer productivity and target investments effectively.
If you’re starting from scratch, Datadog DORA Metrics offers a framework for your software delivery performance, and AI Impact measures how coding assistants affect it. CI Visibility and Test Optimization give you tool-quality signals, while Datadog IDP helps you maintain up-to-date service catalog and ownership data to reduce discovery friction. The Datadog MCP Server further extends this operational context to AI agents, which ensures that the systems relied upon by engineers remain accessible to both human and AI collaborators.
To learn more, visit the DORA Metrics, AI Impact, CI Visibility, Test Optimization, IDP, and MCP Server documentation. If you’re new to Datadog, sign up for a 14-day free trial.
此内容由惯性聚合(RSS阅读器)自动聚合整理,仅供阅读参考。 原文来自 — 版权归原作者所有。