


Paul Gottschling
SQL Server is a relational database management system (RDBMS) developed by Microsoft for Windows and, more recently, for Linux. Its query language, an implementation of SQL called Transact-SQL (T-SQL), can be written as batches of statements that SQL Server compiles and caches to improve query performance. SQL Server also gives you several ways to configure resource use. It can store tables in memory rather than on disk, and it lets you control the distribution of CPU, memory, and storage by configuring resource pools, which we’ll cover in detail below.
With so much to optimize, you’ll want to make sure that the configuration you choose fits the needs of your system, and that SQL Server is performing well in general. This post explains the metrics that can help you implement in-depth SQL Server monitoring to ensure that your instances are optimized, healthy, and available.
In this post, we’ll explore the metrics that provide visibility into SQL Server’s functionality, from data persistence to query optimization, indexes, and resource pooling. We’ll start with an overview of how SQL Server works.
With T-SQL, you can write batches, groups of statements that perform a series of related operations on a database, and that SQL Server can compile into a single, streamlined query. It is up to you to determine the order of statements within a batch. For example, you might write a batch to return a result set from a SELECT statement, then use the result set to perform another operation. For software that queries SQL Server (e.g., the sqlcmd CLI or SQL Server Management Studio), the keyword GO indicates the end of the batch.
Every batch is compiled and cached in memory as an execution plan, a set of data structures that allow SQL Server to reuse a batch in multiple contexts, with different users and parameters. When a user executes a batch, SQL Server first searches its cache for the execution plan, and compiles a new one if it comes up short.
As SQL Server compiles your batches, it optimizes them, measuring statistics like the number of rows involved and adjusting the execution plan in response. In a sense, a “query” in SQL Server is a batch of one or more T-SQL statements compiled and run as an execution plan.
Rather than reading and writing to disk directly, SQL Server uses a buffer manager, which moves data between storage and an in-memory buffer cache.
Whether on disk or in the buffer cache, SQL Server stores data within eight-kilobyte pages. The buffer manager handles queries by checking first for pages within the buffer cache and, if they’re absent, pulling them from disk. When the buffer manager writes to a page in memory, the page becomes “dirty.” Dirty pages are flushed to disk at regular intervals, allowing most work to take place in memory and making costlier disk operations less frequent. Until they are flushed, dirty pages remain in the buffer cache for successive reads and writes.
SQL Server creates checkpoints, flushing all dirty pages to disk, to ensure that the database will recover within a certain time (the recovery interval) in the case of failure. The recovery interval is configurable but defaults to zero, which means that SQL Server sets it automatically. This amounts to a checkpoint roughly every minute. You can also use a T-SQL statement to create a checkpoint manually.
To keep track of data modifications and allow for recovery, SQL Server maintains a write-ahead transaction log. The log is a record of data modifications like INSERT and UPDATE, as well as of points where operations like checkpoints and transactions begin and end. A copy of the log exists both on disk and in a cache. After SQL Server commits a transaction, that is, when SQL Server makes a transaction’s modifications permanent and lets other database operations access the data involved, SQL Server logs the commit and writes the transaction log to disk. The aim is to flush the buffer cache only when a record of all transactions is available on disk, keeping the data consistent during a database recovery.
As with other relational databases, SQL Server lets you create indexes to speed up read operations. Depending on the query, searching an index is usually faster than searching all rows within the table itself. The SQL Server query optimizer determines whether it can save time by using an index or scanning a table directly.
Another route to faster reads and writes is the memory-optimized table. Memory optimized tables store rows in memory, rather than on disk, and individually rather than within pages, reducing bottlenecks in per-page access. And with memory-optimized tables, there’s no need for a buffer manager to broker between memory and disk, as reads and writes always benefit from the time savings of accessing data within memory. By default, SQL Server maintains a copy of a memory-optimized table on disk, and uses this copy only for restoring the database. For data that doesn’t need to recover in the event of a crash, you can also configure memory-optimized tables to have no disk persistence at all.
Since SQL Server 2008, you can control SQL Server’s resource use more explicitly with resource pools, virtual instances of SQL Server that access a slice of their parent’s resources: memory, CPU, and disk I/O. You can declare multiple resource pools for a single SQL Server instance.
You can control which resource pools your SQL Server sessions can access by using classifications of user sessions known as workload groups. Each workload group belongs to a resource pool, and can only access that pool’s resources. Workload groups can also include policies for sessions such as ranking them by importance. A classifier function assigns incoming requests to a workload group, and constrains those requests to the resources available for its resource pool.
Now that we’ve touched on some of the core features and optimizations available in SQL Server, we’ll look at the metrics that can expose the inner workings and resource usage of your databases.
This guide assumes that you are using SQL Server 2017. If you want to check that what we mention is available with the version or license you are using, you can consult Microsoft’s documentation.
SQL Server’s behavior for handling queries and distributing resources makes some metrics particularly important to monitor.
In this post, we’ll cover metrics for:
We’ve listed the metrics in a table at the start of every section. In the “Availability” column, we’ll list the source where you can access this metric. In Part 2 of this series, we’ll show you how to collect metrics from these sources.
This article references metric terminology from our Monitoring 101 series, which provides a framework for metric collection and alerting.
SQL Server attempts to minimize the latency of your queries by batching, compiling, and caching T-SQL statements. You can get the most out of this behavior, and check that SQL Server is handling queries as expected, by monitoring these metrics.
| Name | Description | Metric type | Availability |
|---|---|---|---|
| Batch requests/sec | Rate of T-SQL batches received per second | Work: Throughput | SQL Statistics Object (performance counters) |
last_elapsed_time | Time taken to complete the most recent execution of a query plan, in microseconds (accurate to milliseconds) | Work: Performance | sys.dm_exec_query_stats (Dynamic Management View) |
| SQL compilations/sec | Number of times SQL Server compiles T-SQL queries per second | Other | SQL Statistics Object (performance counters) |
| SQL recompilations/sec | Number of times query recompilations are initiated per second | Other | SQL Statistics Object (performance counters) |
Batch requests/sec
To get a high-level view of the overall usage of your database over time, you can measure the number of batch requests the database engine receives per second. Sudden changes in the rate of batch requests can reveal availability issues or unexpected changes in demand.
Yet the count of batch requests per second tells you little about the cost of an individual batch. This is both because batches can include an indefinite number of T-SQL statements and because a batch that calls stored procedures can still count as a single batch request. To measure the performance of your batches, you’ll want to monitor batch requests per second along with other work metrics, such as the elapsed time of an execution plan, as well as resource metrics like memory used within your database server.
While SQL Server keeps track of errors in your queries, there are no ready-made metrics that report these as counts and rates. The built-in function @@ERROR returns an error code if the last T-SQL statement produced an error, and 0 if it did not. You can use this function within batches or stored procedures to handle errors. But since its value resets with each new execution, you can’t use it to monitor error counts over time unless you add manual instrumentation—e.g., writing your batches to execute the function @@ERROR before finishing and storing the results along with a timestamp.
last_elapsed_time
SQL Server improves query performance by compiling batches of T-SQL statements and caching them as execution plans. Since the process is automatic, you’ll want to make sure it behaves as intended, and creates execution plans that are optimal for your system. You can gauge the performance benefits of compilation by monitoring the time it takes for your execution plans to complete. With the sys.dm_exec_query_stats view, SQL Server returns a row of statistical data for each query plan within the cache, including the elapsed time of the most recent execution of the plan (last_elapsed_time).
The elapsed time of an execution plan is a good proxy for how well SQL Server’s optimization techniques are working. If your execution plans are taking longer than expected to complete, it’s possible to optimize compilation yourself by using a query hint. For example, you can optimize your execution plan to retrieve the first n rows (FAST), remain within a memory limit (MAX_GRANT_PERCENT), or otherwise override the default optimization process.
If you’re using the sys.dm_exec_query_stats dynamic management view to measure the elapsed time of your query plans, note that the view only stores statistics for execution plans within the cache. If a plan leaves the cache, you’ll lose any statistics about it in this view. You can still store those statistics in your own tables if you choose, using SQL Server’s plan_generation_num to link different recompilations of the same plan.
SQL compilations/sec
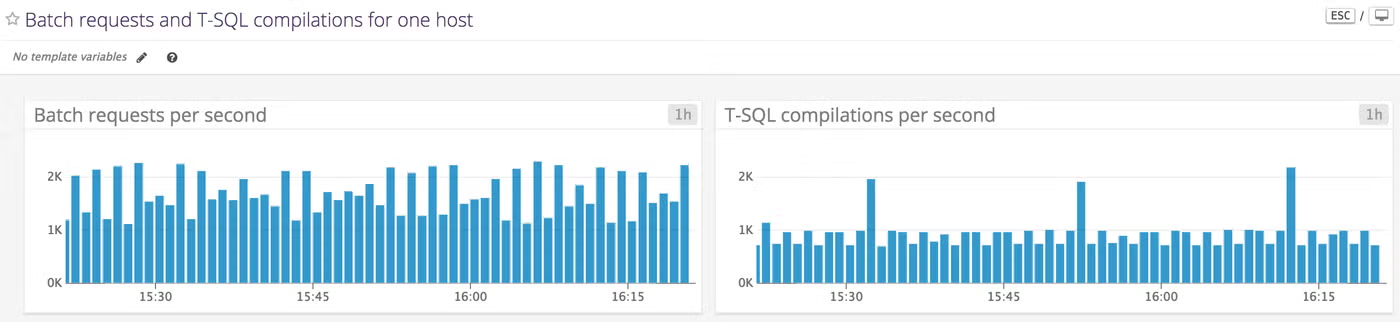
When SQL Server executes a batch for the first time, it compiles the batch into an execution plan and caches it. In an ideal case, SQL Server only compiles an execution plan once. The least desirable case is one where no execution plans are reused. In this scenario, batches compile every time they execute, and batch requests per second are equal to batch compilations per second. For this reason, it’s important to compare this metric to the rate of batch requests received per second.
If these metrics are starting to converge, you may consider using query hints to set PARAMETERIZATION to FORCED. Forced parameterization configures SQL Server’s query compilation to replace literal values in certain T-SQL statements (SELECT, INSERT, UPDATE, and DELETE) with parameters, making the resulting query plans more reusable.
Note that the “SQL compilations/sec” metric also includes statement-level recompilations, a feature introduced in SQL Server 2005 that recompiles only the statements responsible for the recompilation of a batch. If forced parameterization does not reduce the number of SQL compilations per second, consider monitoring recompilations per second as we’ll describe next.
SQL recompilations/sec
Execution plans are recompiled when SQL Server is restarted, or when the data or structure of a database has changed enough to render an execution plan invalid. While recompilation is often necessary for your T-SQL batches to execute, it can undo any savings in execution time. Watch the number of recompilations per second to see if it corresponds with drops in performance or if it is simply a sign that SQL Server has optimized execution plans for changes in your tables.
SQL Server recompiles batches based on thresholds it calculates automatically, and it’s possible to adjust these thresholds and lower the rate of recompilation using query hints. One threshold is based on updates to a table made with UPDATE, DELETE, MERGE, and INSERT statements. The query hint KEEP PLAN reduces the frequency of recompilation when a table updates. Another threshold is based on statistics SQL Server maintains about the distribution of values in a given table, which predict the number of rows in a query result. The query hint KEEPFIXED PLAN prevents recompilation due to changes in these statistics.
Before you make changes that affect the recompilation threshold, it’s worth noting that since SQL Server will automatically recompile execution plans based on changes within your tables, recompilations may improve query latency enough to offset the initial performance cost.
Much of the work involved in executing your queries takes place between the buffer cache and the database. Monitoring the buffer cache lets you ensure that SQL Server is performing as many read and write operations as possible in memory, rather than carrying out the more sluggish operations on disk.
| Name | Description | Metric type | Availability |
|---|---|---|---|
| Buffer cache hit ratio | Percentage of requested pages found in the buffer cache | Other | Buffer Manager Object (performance counters) |
| Page life expectancy | Time a page is expected to spend in the buffer cache, in seconds | Other | Buffer Manager Object (performance counters) |
| Checkpoint pages/sec | Number of pages written to disk per second by a checkpoint | Other | Buffer Manager Object (performance counters) |
Buffer cache hit ratio
The buffer cache hit ratio measures how often the buffer manager can pull pages from the buffer cache versus how often it has to read a page from disk. The larger the buffer cache, the more likely it is that SQL Server can find its desired pages within memory. SQL Server calculates the size of the buffer cache automatically, based on various system resources such as physical memory. If your buffer cache hit ratio is too low, one solution is to see if you can increase the size of the buffer cache by allocating more system memory.
Page life expectancy
Like the buffer cache hit ratio, page life expectancy indicates how well the buffer manager is keeping read and write operations within memory. This metric shows the number of seconds a page is expected to remain in the buffer cache. The buffer cache exists as one or more buffer nodes, which support a non-uniform memory access (NUMA) architecture consisting of multiple memory allocations. Each buffer node reports the minimum number of seconds a page will remain within it, and the buffer manager performance object averages these values to obtain its page life expectancy.
SQL Server flushes pages either at a checkpoint or when the buffer manager requires more space in the buffer cache. The latter process is called lazy writing, and flushes dirty pages that are accessed infrequently. Generally, higher page life expectancy indicates that your database is able to read, write, and update pages in memory, rather than on disk.
By default, SQL Server uses indirect checkpoints, which flush dirty pages as often as it takes for the database to recover within a certain time (as discussed above, the recovery interval is initially configured to set automatically). Since indirect checkpoints use the number of dirty pages to determine whether the database is within the target recovery time, there’s a risk that the buffer manager will bog down performance with aggressive flushing. A different checkpoint configuration can increase the life expectancy of your pages.
It’s helpful to understand whether a low page life expectancy is due to an undersized buffer cache or overly frequent checkpoints. If it’s the former, you can increase page life expectancy by adding physical RAM to your SQL Server instances. You can determine the cause of high page turnover by monitoring the number of pages flushed to disk per second by a checkpoint (see next section).
Checkpoint pages/sec
During a checkpoint, the buffer manager writes all dirty pages to disk. As we’ve seen, during lazy writing, SQL Server only writes some pages, letting the buffer manager make room in the buffer cache for new pages. By monitoring the rate at which pages are moved from the buffer cache to disk specifically during checkpoints, you can start to determine whether to add system resources (to create a larger buffer cache) or reconfigure your checkpoints (e.g., by specifying a recovery time) as you work to optimize the buffer manager.
It’s important to monitor resource use in SQL Server tables in order to ensure that you have enough space for your data in storage or, depending on your SQL Server configuration, in memory.
| Name | Description | Metric type | Availability |
|---|---|---|---|
memory_used_by_table_kb | For memory-optimized tables, the memory used in kilobytes, by table | Resource: Utilization | sys.dm_db_xtp_table_memory_stats (Dynamic Management View) |
| Disk usage | Space used by data or by indexes in a given table | Resource: Utilization | sp_spaceused (Stored Procedure) |
memory_used_by_table_kb
With any RDBMS, you’ll want to make sure there’s enough room for your data, and SQL Server’s memory-optimized tables elevate memory to the same level of importance as storage. Memory-optimized tables in SQL Server 2016 and beyond can be of any size, as long as they fit within the limits of your system memory.
It’s important to compare the size of your memory-optimized tables with the memory available on your system. Microsoft recommends maintaining enough system memory to accommodate twice the estimated size of the data and indexes within a memory-optimized table. This is not only because you need room for the indexes and data themselves, but also because memory-optimized tables enable concurrent reads and writes by storing several versions of a single row. Since memory-optimized tables can be as large as memory allows, it’s important to leave aside enough resources to support their growth.
Memory-optimized tables are designed to accommodate high-throughput, low-latency transactions. You can monitor the rate of queries to in-memory tables alongside their resource use to see if your use case fits this profile.
Disk usage
If your server is running out of disk space, it’s critical to get notified with enough lead time that you can take action. The stored procedure sp_spaceused returns the disk usage for a specific table or database. The example below forecasts the growth of a custom disk space metric generated by the stored procedure sp_spaceused (see Part 4 to learn more).
As your data nears capacity, you’ll want to think about the design of your storage. SQL Server lets you configure the way your tables use disk space. It’s possible, for instance, to distribute your data files across multiple disks and assign them to a logical unit, the filegroup. You can use T-SQL statements to declare a filegroup and associate files with it by path. When you declare a table, you can assign it to a filegroup. Queries to the table will read and write data to files in the filegroup. Since files in a filegroup can be local or remote, you can counteract limited system space by adding files from separate drives. And as SQL Server can access multiple disks at once, filegroups can improve performance.
A transaction locks certain resources, such as rows, pages, or tables, and stops subsequent transactions from accessing them before the first is committed. SQL Server’s locking behavior is designed to keep transactions atomic, consistent, isolated, and durable (ACID), that is, to make sure that each transaction presents a self-contained operation. The SQL Server query processor automatically creates locks at different levels of granularity (rows, pages, tables) and isolation (e.g., whether to lock on a read operation) for the data that a given query needs. By monitoring locks, you can determine the extent to which tables (along with rows or pages) are acting as bottlenecks.
| Name | Description | Metric type | Availability |
|---|---|---|---|
| Lock waits/sec | Number of requests causing the calling transaction to wait for a lock, per second | Other | Locks Object (performance counters) |
| Processes blocked | Count of processes blocked at the time of measurement | Other | General Statistics Object (performance counters) |
Lock waits/sec
If other resources are waiting too frequently for your locks to lift, there are several steps you can take. You can for instance set the isolation level of a transaction. In occasional cases, a lock might expand its reach beyond the optimal level of granularity, a situation called lock escalation. In this case, you can break up your transactions to nudge the query processor toward less restrictive locks.
Processes blocked
When a task within SQL Server waits for another task’s locked resources, that task is blocked. While the number of lock waits per second can tell you how often a request has needed to wait for a resource, it’s also good to know the extent to which blocking is currently affecting your system. One way to track this is by monitoring the number of blocked processes.
You may want to correlate this metric with others, such as the elapsed time of your query plan executions, to see the extent to which blocked processes are affecting your queries.
If your count of blocked processes is persistently elevated, you may want to check for deadlocks—occurrences where multiple transactions are waiting for one another’s locks to lift.
If you’ve configured SQL Server into resource pools, it’s important to make sure that they distribute resources as intended and don’t limit your users unnecessarily.
One way to achieve this is by measuring resource use within each pool. In the resource pool, you can limit memory, CPU, and disk I/O. You can use resource-specific metrics to help you create and assess your limits.
| Name | Description | Metric type | Availability |
|---|---|---|---|
| Used memory | Kilobytes of memory used in the resource pool | Resource: Utilization | Resource Pool Stats Object (performance counters) |
| CPU usage % | Percentage of CPU used by all workload groups in the resource pool | Resource: Utilization | Resource Pool Stats Object (performance counters) |
| Disk read IO/sec | Count of disk read operations in the last second per resource pool | Resource: Utilization | Resource Pool Stats Object (performance counters) |
| Disk write IO/sec | Count of disk write operations in the last second per resource pool | Resource: Utilization | Resource Pool Stats Object (performance counters) |
Used memory
A SQL Server instance has a certain amount of memory available for query execution. Within a resource pool, MIN_MEMORY_PERCENT and MAX_MEMORY_PERCENT indicate a hard floor or ceiling, respectively, on the percentage of a SQL Server instance’s memory that a resource pool can use. A resource pool must use at least its MIN_MEMORY_PERCENT and at most its MAX_MEMORY_PERCENT.
You can see how changing the maximum percentage of memory affects a resource pool’s usage. The graph below shows the memory used within two resource pools: the internal pool (purple), which represents SQL Server’s internal processes and cannot be modified, and the default pool (blue), which is predefined within SQL Server but has configurable resource limits.
The internal pool uses memory at a steady rate. At 10:23, we reduced MAX_MEMORY_PERCENT of the default pool from 30 to 10. You can see the effect on memory usage in the default pool as it plummets from 100 KB to around 25 KB. MAX_MEMORY_PERCENT is a hard ceiling, and setting it below what a pool is using will have immediate effects. It’s important to make sure you’re configuring your resource pools while observing the resource usage you want to constrain.
CPU usage %
When you set a minimum and a maximum for CPU usage, that limit only applies when several pools would otherwise use more CPU between them than what’s available. In other words, a pool can use more than its MAX_CPU_PERCENT if no other pool is using it. You can, however, set a hard limit with CAP_CPU_PERCENT. As with the memory used within a resource pool, you’ll want to see what sort of CPU consumption is common among your users, then determine whether you can optimize your resources by setting hard or soft limits.
Disk read IO/sec, disk write IO/sec
Rules for disk I/O are defined in terms of I/O operations per second (IOPS). You can configure I/O utilization per disk volume within a given resource pool by setting MIN_IOPS_PER_VOLUME and MAX_IOPS_PER_VOLUME. If you’re setting these limits, measuring disk reads and writes per second by resource pool can show how often your pools approach their constraints and whether another option is appropriate.
Indexes are often a key part of the way tables work in an RDBMS, making it possible to comb through production-level datasets at a reasonable rate. SQL Server gives you latitude in how you design your indexes. Monitoring these index-related metrics can help you keep your queries efficient.
| Name | Description | Metric type | Availability |
|---|---|---|---|
| Page splits/sec | Count of page splits resulting from index page overflows per second | Other | Access Methods Object (performance counters) |
avg_fragmentation_in_percent | Percentage of leaf pages in an index that are out of order | Other | sys.dm_db_index_physical_stats (Dynamic Management View) |
Page splits/sec
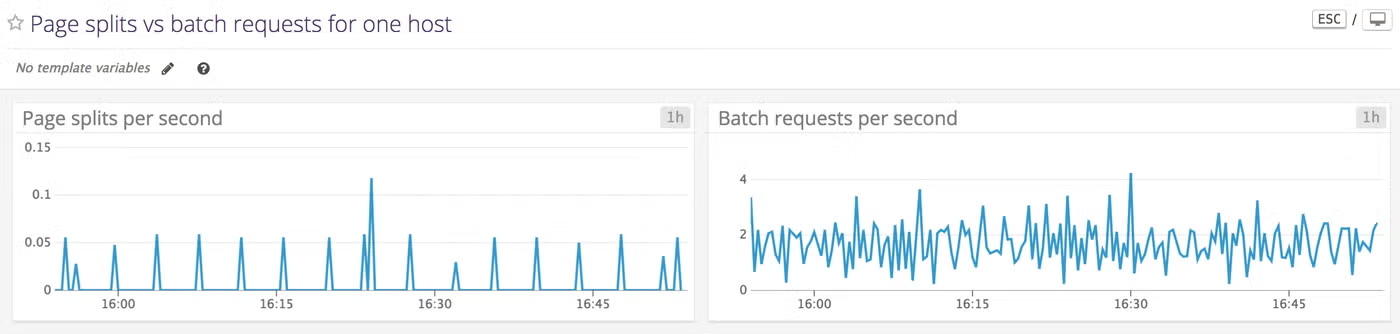
As your data grows, so do your indexes. Like data, indexes are stored on pages. A page split occurs when an index page is too full for new data. SQL Server responds by creating an index page and moving about half of the rows from the old page to the new one. This process consumes I/O resources.
You can prevent page splits by specifying the fill factor of an index, the percentage of an index page to keep filled. By default, the fill factor is zero, and when an index page is filled entirely, a page split takes place. Specifying a fill factor leaves a percentage of each page empty and allows new rows to enter without splitting the page. If you specify a fill factor of an index, SQL Server will store that index across more pages, so that each page has some room set aside for future growth.
By correlating high or low rates of page splits with other metrics, you can determine if you should increase or decrease the fill factor. The lower the fill factor (without being zero), the more pages an index takes up. If an index is stored across a larger number of pages, read operations will need to access more of them, increasing latency. Yet with a higher fill factor or a fill factor of zero, you’ll get more frequent page splits and see a rise in lock waits, as SQL Server cordons off the splitting page. Monitoring these metrics can reveal which settings are optimal for your infrastructure.
Note that since memory-optimized tables use eight-byte pointers rather than pages, indexes for memory-optimized tables do not have a fill factor, nor do you have to worry about page splits.
avg_fragmentation_in_percent
Fragmentation occurs when the order of data within an index drifts from the order in which data is stored on disk—and it can slow performance. Fragmentation is often a side effect of a growing, changing database, whether it’s a consequence of page splits or a result of SQL Server’s adjustments to the index as you insert, update, and delete entries.
Indexes within SQL Server are structured as B-trees. Index pages serve as nodes within the tree. Nodes with no children, the outermost nodes within the tree, are called leaf nodes. Depending on the design of your index, a leaf node is either a data page or an index page. You can find out how much fragmentation your database has sustained by monitoring avg_fragmentation_in_percent, the percentage of leaf pages in your index that are out of order. If database fragmentation is dragging performance below what’s expected, you may consider rebuilding your index. As with fill factor, fragmentation is not relevant for memory-optimized tables.
In any RDBMS, executing queries depends on establishing and maintaining client connections. Monitoring your connections is a good starting point for diagnosing changes in availability or performance.
| Name | Description | Metric type | Availability |
|---|---|---|---|
| User connections | Count of users connected to SQL Server at the time of measurement | Resource: Utilization | General Statistics Object (performance counters) |
By default, SQL Server enables up to 32,767 concurrent connections. You can configure a lower maximum, though Microsoft recommends this only for advanced users: SQL Server automatically allocates connections based on load. Correlating the number of user connections with other metrics can tell you which parts of your system you need to protect from high demand. If more connections seem to be creating more lock waits, for example, you may want to focus your optimization efforts on determining which queries result in locks as your application gains users. If your connections have plummeted, you may need to troubleshoot your network or any changes to your client applications.
In this post, we’ve surveyed metrics for some of SQL Server’s resource-saving features, as well as vital signs that can help you identify common database issues. We’ve shown how to:
SQL Server provides a set of data sources for gathering these metrics and a suite of tools for monitoring them. We’ll give you an overview in the second part of this series.
此内容由惯性聚合(RSS阅读器)自动聚合整理,仅供阅读参考。 原文来自 — 版权归原作者所有。