


In Parts 1 and 2, we looked at how you can build and maintain effective test suites. These steps are a key part of ensuring that application workflows function as expected. But how you run your tests is another important point to consider, so in this post, we’ll walk through best practices for executing your tests across every stage of development. Along the way, we’ll also look at how Datadog supports these practices for the applications that you are already monitoring. But first, we’ll briefly discuss continuous testing and the role it plays in application development.
Continuous testing (CT) is the process of verifying application functionality at every stage of the software development life cycle (SDLC). The primary purpose of CT is testing earlier in development, a key principle of “shift-left testing”, in addition to the traditional quality assurance practice of testing right before or after a release. By testing across multiple stages of development, you can find and resolve issues sooner and ensure that your application is working as expected for customers.
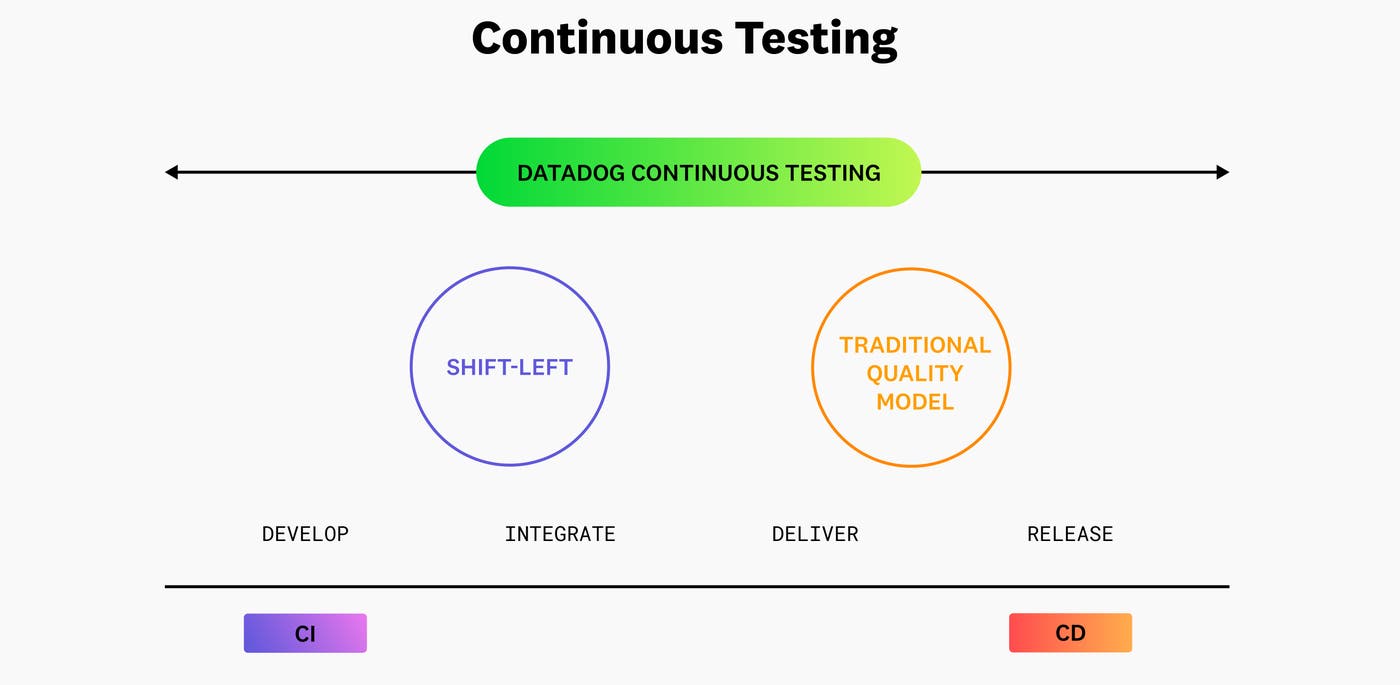
As seen in the preceding diagram, CT verifies functionality at several pre-production and post-production stages:
Develop: code on a local development branch
Integrate: code that is merged into a shared repository, where it can be compiled, analyzed, and tested
Deliver: code that is bundled as part of a release branch
Release: code that is released to production
There are multiple tools and practices that can help you efficiently implement continuous testing at these stages. For example, continuous integration—often abbreviated as CI, as in the previous diagram—enables your developers, automatically and at regular intervals, to build and test code changes that have been merged into a central repository. The benefit of these CI practices is to surface pre-production application issues faster. Continuous delivery (CD) and continuous deployment (CD) practices extend CI workflows by automating pre-release and production cycles. Delivery workflows deploy code changes to dedicated environments, such as staging, while deployment workflows release code to customers after all associated builds and tests pass.
CI/CD can facilitate continuous testing for your application, but knowing how to integrate tests into these workflows can be difficult. In this post, we’ll focus on the following strategies for ensuring that you can run test suites efficiently and across any stage of development:
Create reusable tests for your environments
Streamline test runs by executing them in parallel
Integrate your tests across all development stages
Beyond investigating these best practices, we’ll also look at how Datadog Continuous Testing supports them at every stage.
A primary challenge with continuous testing is determining how to efficiently manage workflows that rely on the same set of steps, such as those that require first logging into an application. This scenario is especially important to consider as you add functionality that builds upon your existing application workflows. Without a well-defined process for creating and maintaining your test suites, issues like duplicate or outdated tests can become more prevalent. These problems can occur if you rely on separate test suites for each of your dedicated environments, which is a common byproduct of scaling tests with a rapidly growing code base. As a result, you can unknowingly run the same tests—or execute outdated ones—multiple times, which can delay critical releases, generate false positives, and risk overlooking bugs that are introduced by new functionality.
You can mitigate these issues by building a single test suite that can be used at every stage of development. Continuous Testing in Datadog Synthetic Monitoring enables you to run the same group of steps in any dedicated environment, with the ability to customize start URLs and variables for your environment needs via subtests. In the following screenshot, you can see that the example browser test is first navigating to a staging URL then executing a set of steps that are grouped together as a subtest:
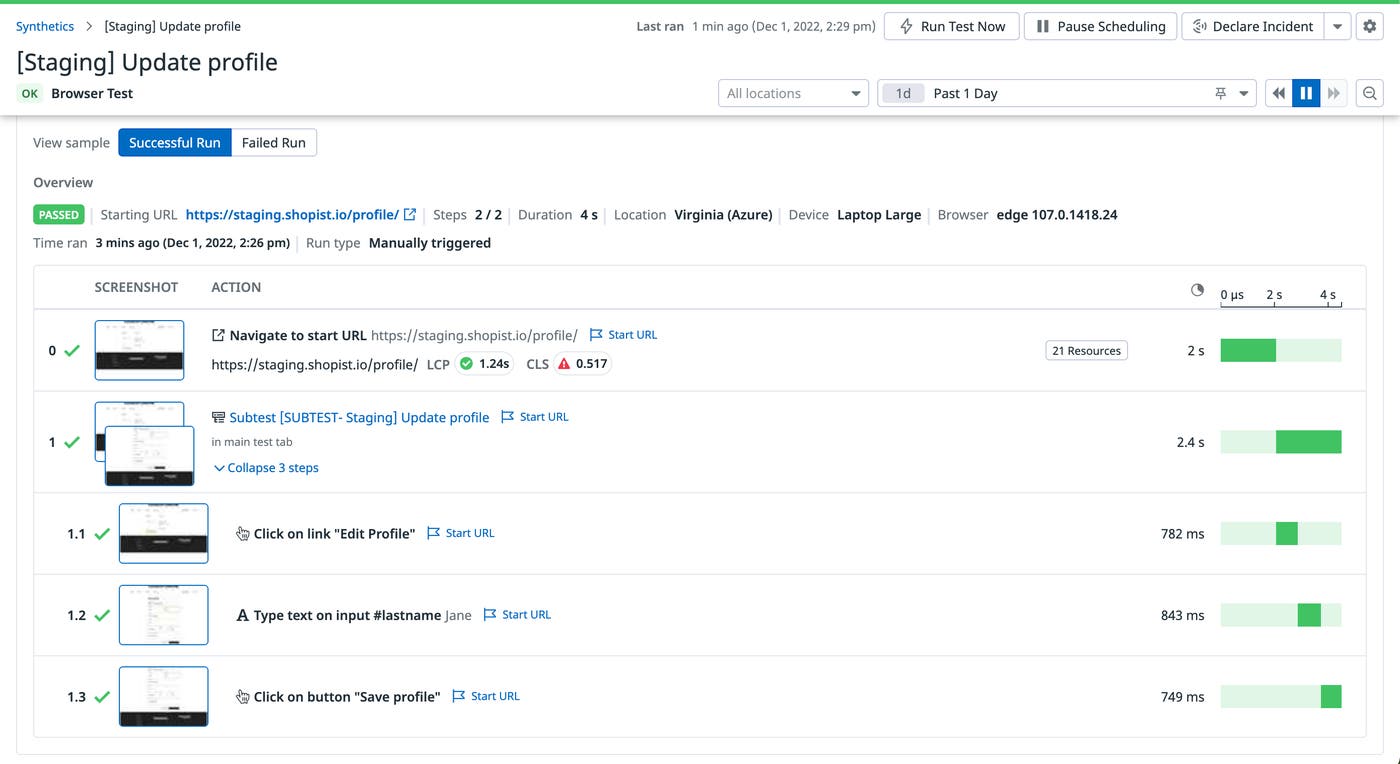
To test the same functionality in another environment, such as production, you simply need to pass a different start URL, thereby reducing test suite sprawl across your environments. If you need to override usernames or passwords based on your environment, you can store your data as global variables. These practices can help you minimize test dependencies and set the foundation for reducing execution times, which we’ll talk about next.
As you continue to create more tests, it’s important to consider their execution times because they directly affect your release velocity. Groups of tests that are made up of hundreds of API and UI tests, for example, can take several hours to complete. This is especially true if tests are executed sequentially. If execution times are consistently long enough to hold up releases, your developers may circumvent the testing process altogether. This risks releasing broken functionality to your customers.
Running tests in parallel, which launches multiple tests simultaneously, can significantly reduce execution times. But in order to implement parallel testing for your environment, it’s important to optimize them based on best practices around creating and maintaining your tests. For example, tests should be independent from one another. This means that they should not rely on steps or test data from a previous test. As previously mentioned, you can leverage subtests to minimize dependencies while still facilitating reusability.
Once you’ve optimized your tests, there are several approaches you can take to implement parallel testing in your environment. For example, you can run your tests suites across multiple devices, locations, and devices simultaneously. Datadog Continuous Testing supports this approach by automatically running batches of browser and API tests in parallel based on the number of tests you configure in your parallelization settings.
To determine the right number of tests to run in parallel, you can consider the following questions:
Which locations are your customers the most active in?
How many devices and browsers does your organization need to support?
How many of your development teams implement continuous testing practices, and what is an acceptable duration for their test suites?
How frequently do you release your product?
Consider a test suite that comprises 50 tests and takes 20 minutes to run from end to end. If your runtime goal is five minutes, for example, you can first configure 10 tests to run in parallel and then monitor their performance. Adjusting the number of parallel test runs based on these factors can help you strike a balance between cost, performance, and duration.
Next, we’ll look at how you can integrate your entire test infrastructure—including your parallel testing setup—into your existing CI/CD pipelines.
In traditional testing models, test suites and tools are often not integrated into CI/CD processes. This disconnect makes it difficult to get full context for reviewing test results and identifying the root cause of any failures. As previously mentioned, shift-left testing aims to solve this issue by integrating with earlier stages of development. This approach provides visibility into both code and test activity in order to catch issues sooner.
To accomplish this, you should first integrate tests with your CI/CD platform. This ensures that your tests run across every stage of development, enabling you to monitor them alongside your builds. The best practices we’ve discussed in this post, such as running tests in parallel, can simplify the integration process, but there are a few additional steps to consider when updating your CI/CD pipelines. For example, tests in your pipelines should leverage the following rules to maximize efficiency and visibility:
Order: faster tests should run first to ensure that you receive feedback sooner
Simplicity: run smaller groups of tests based on testing goals
Integrated results: test results should be easy to review alongside other data, such as metrics or stacktraces
Trackable trends: monitor test activity over time to identify trends, such as increased flakiness or duration
Datadog Continuous Testing supports these practices with popular CI/CD providers, such as GitHub Actions, Azure DevOps, and CircleCI, and is deeply integrated with other Datadog tools to provide end-to-end visibility into your development workflows. For example, you can tag subsets of API and browser tests based on their primary purpose—such as smoke testing—and then configure individual pipelines to only run those specific tags. This practice enables you to control the order and precision of your tests by only running the ones you need for any given step within your development workflow.
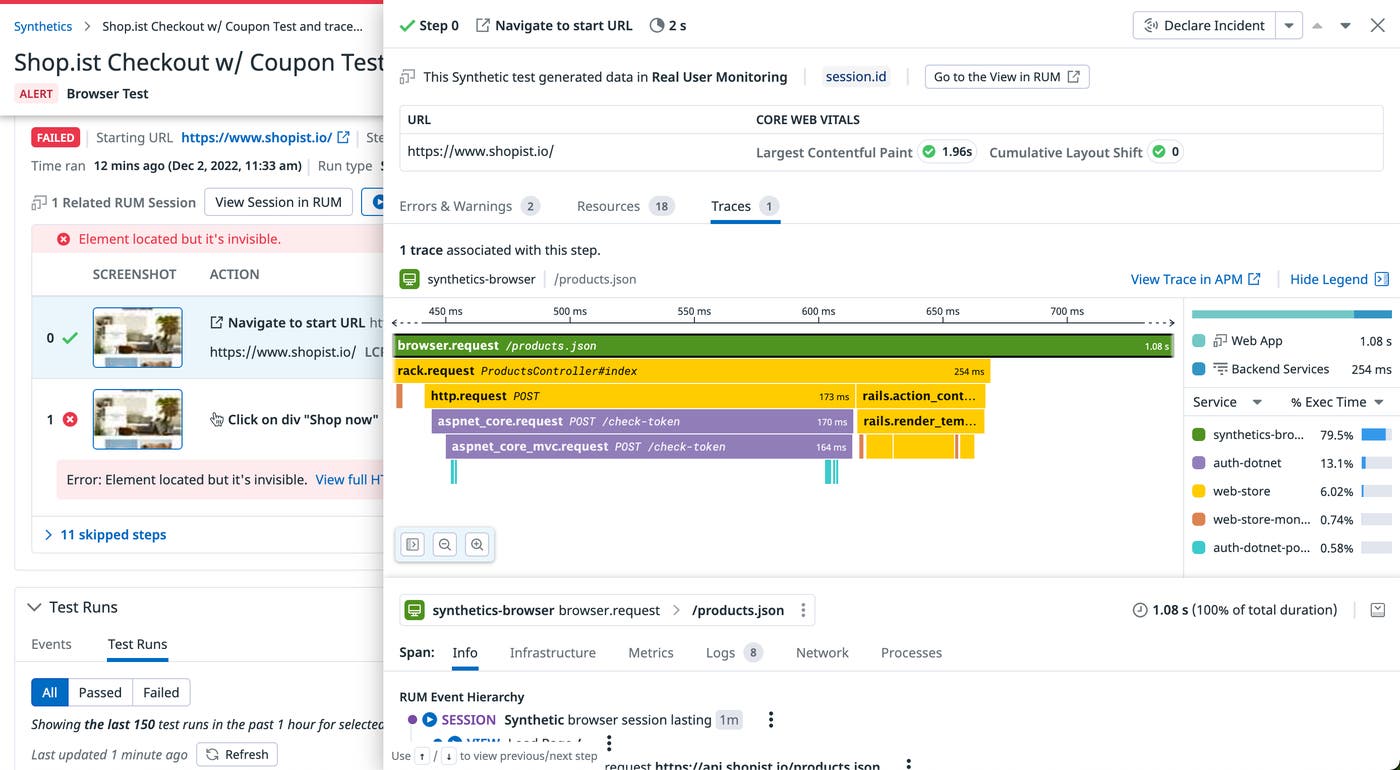
You can also review the performance of your application, including APM and RUM data, directly within the generated test results. This visibility enables you to monitor key trends in both application and test performance. For example, the following screenshot depicts how you can review RUM metrics like Largest Contentful Paint to track trends in your application’s UX performance. You can also review this information alongside trace data to identify any backend issues that could affect frontend performance, such as a long-running database query.
In this post, we looked at how you can create effective continuous testing workflows in your environment as well as how Datadog Continuous Testing enables you to apply these best practices with ease. To learn more about Datadog Continuous Testing, check out our documentation. If you don’t already have a Datadog account, you can sign up for a 14-day free trial today.
此内容由惯性聚合(RSS阅读器)自动聚合整理,仅供阅读参考。 原文来自 — 版权归原作者所有。