


A challenge for many teams continues to be managing cost, governance, and reliability across an ever-larger footprint. This year’s DASH announcements help teams operate efficiently at scale, with new tools to cut cloud and AI spend, eliminate waste automatically, maintain observability during outages, and manage many organizations and agents as a single unit.
Whether you’re attributing AI spend across providers, automating cost optimization within guardrails you define, keeping observability online through a cloud outage with Disaster Recovery, or storing and searching logs at petabyte scale in your own infrastructure, these features help you control complexity and cost without slowing your teams down. Review everything new for operating at scale below, and read our other roundup posts for the latest in AI, observability, and security.
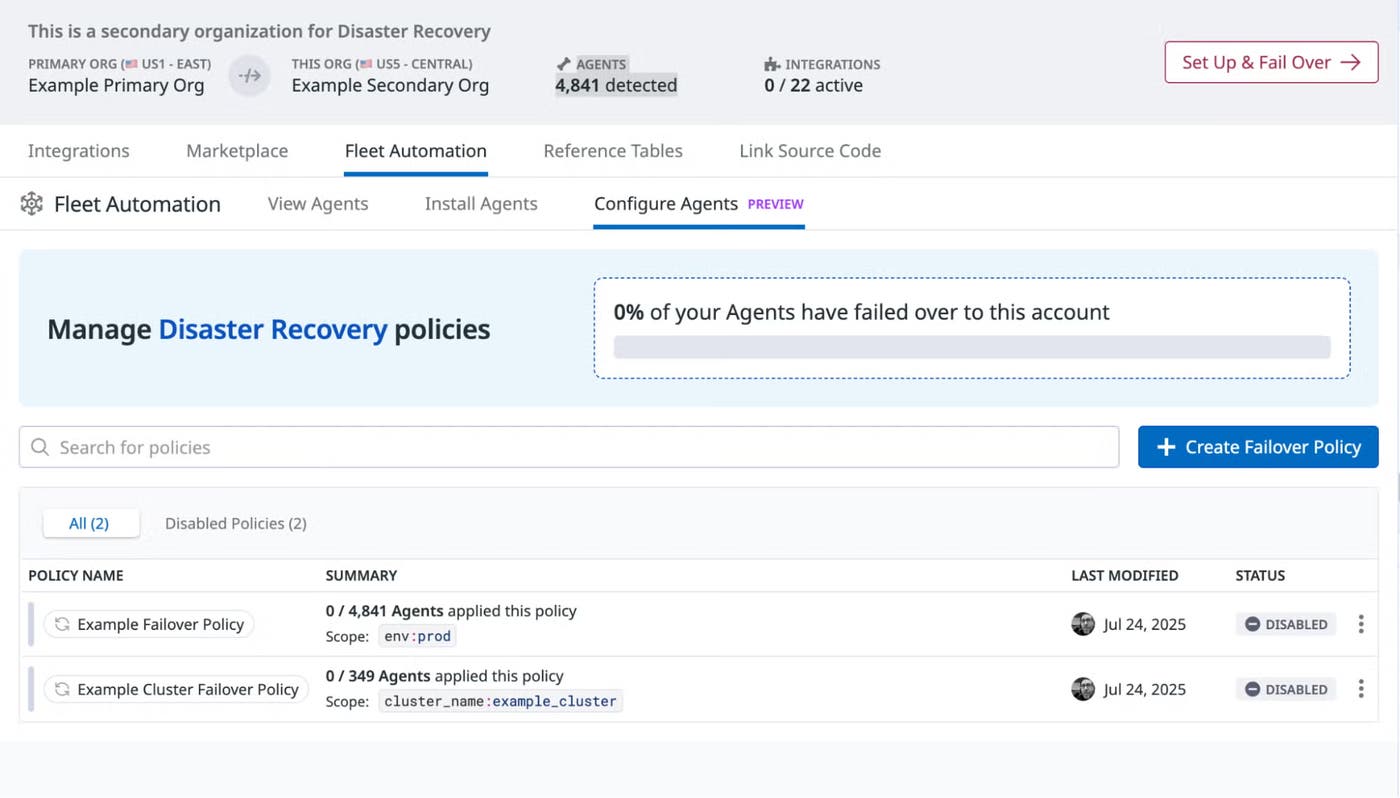
Cloud provider outages can leave teams without visibility into production systems during active incidents. Datadog Disaster Recovery (DDR) lets you configure a secondary Datadog site ahead of time, automatically replicates more than 30 resource types, including dashboards, monitors, and users on a regular schedule, and activates on demand when your primary site is impacted. Failover can be triggered via Fleet Automation and Remote Configuration for Agent-based cutover, or via a dedicated DNS intake endpoint that routes traffic without changes to your Agent fleet. DDR is now generally available. To enable DDR for your organization, contact your Datadog account manager, or read the blog post to learn more.
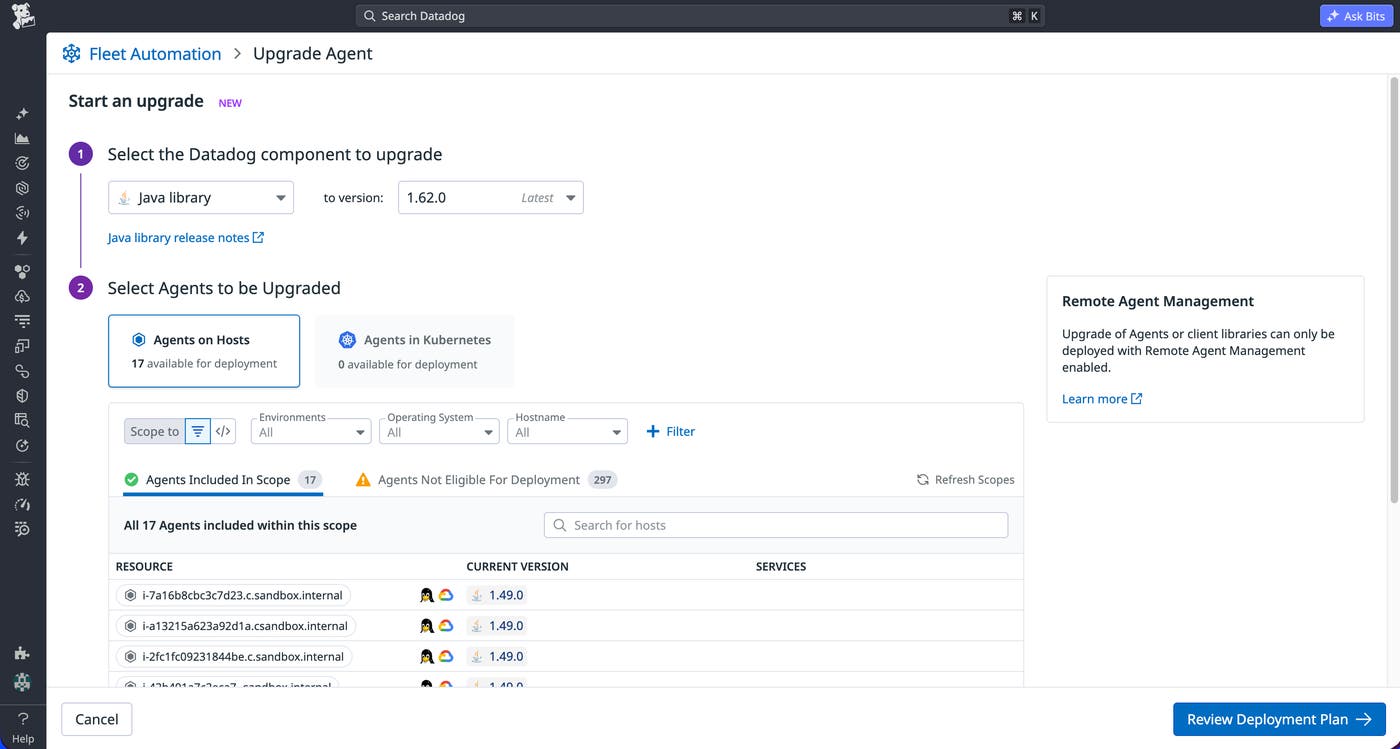
Remote SDK Upgrades in Fleet Automation make it easy to keep Datadog SDKs up to date across your fleet of services. Using the latest SDKs ensures that you benefit from the latest features, performance improvements, and security updates. Learn more in our Remote Agent Management documentation, or sign up for the Preview to get started.
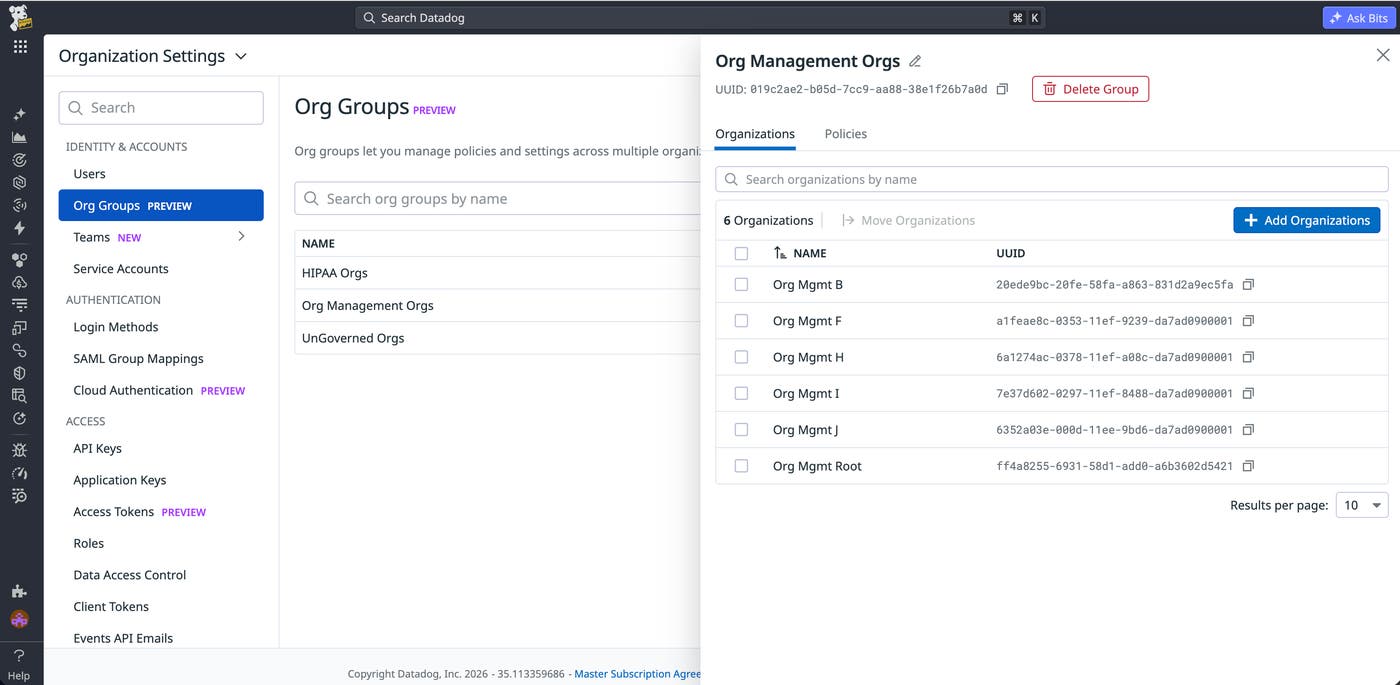
Organization Groups lets administrators manage multiple Datadog organizations as a single unit. Instead of configuring roles, policies, and settings individually per organization, administrators define them once at the group level and push them to member organizations.
Organization Groups are in Preview. Sign up to request access. Learn more in our documentation, or see our guide on organization topologies.
When you’re responding to an incident or doing day-to-day governance in unfamiliar or poorly documented parts of your infrastructure, you often need to know what connects to what. Cloudcraft Oracle diagrams show your live infrastructure and architecture, tightly integrated with Datadog observability and security tools. This helps you:
See an incident’s blast radius with alerts and monitors on your live infrastructure diagram
Find gaps in observability coverage where the Datadog agent is not installed (but should be)
Optimize costs by finding over-provisioned resources and figuring out who owns them
Analyze which security misconfigurations are most relevant and need to be addressed
Onboard new team members
Cloudcraft in Datadog is free for all Datadog customers. To get started, visit Cloudcraft in Datadog today.
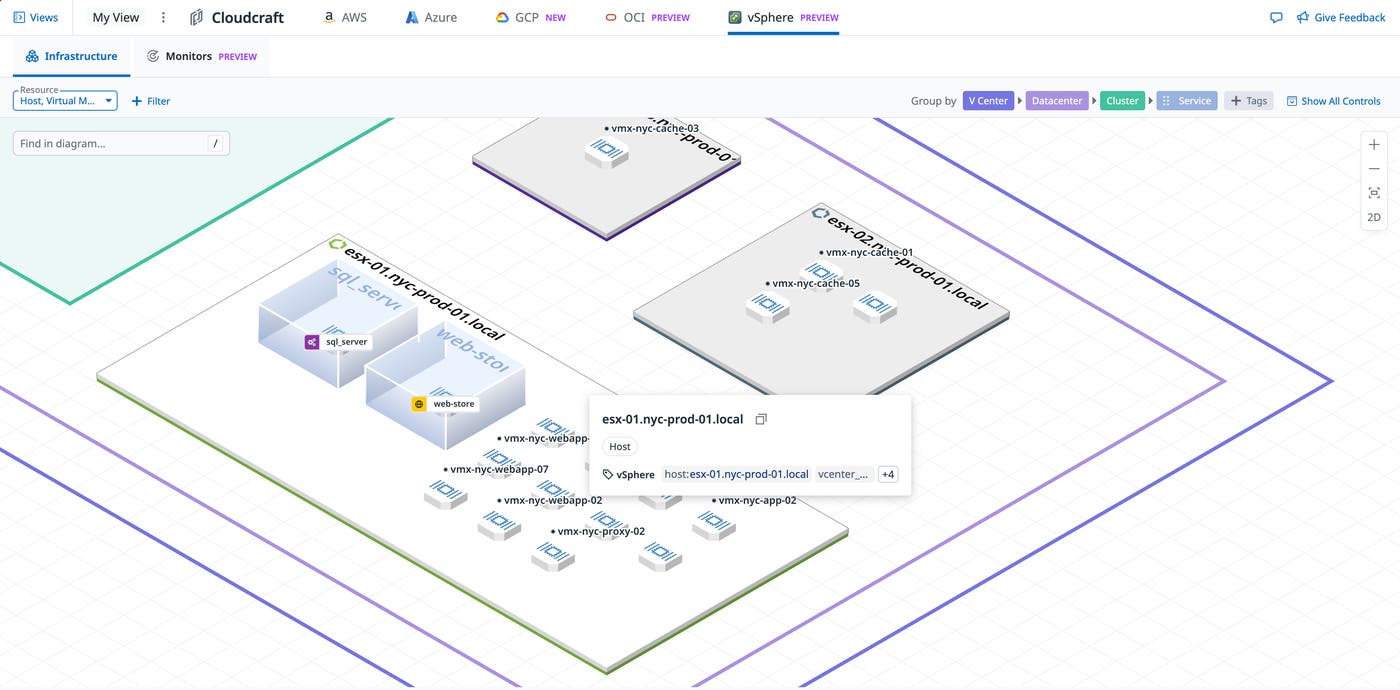
When you’re managing VMWare clusters, you often need to understand blast radius of an issue: Is it isolated, or part of a broader problem? Does a VM have a noisy neighbor, or is a host or cluster exhausting its resources? Cloudcraft VMWare diagrams show your live vSphere clusters, tightly integrated with Datadog observability and security tools. This helps you:
See an incident’s blast radius with alerts and monitors on your live cluster diagram
Quickly click on a host or VM to get detailed telemetry (logs, metrics, traces, network traffic, and more) to find the root cause of an issue
Cloudcraft in Datadog is free for all Datadog customers. To get started, visit Cloudcraft in Datadog today.
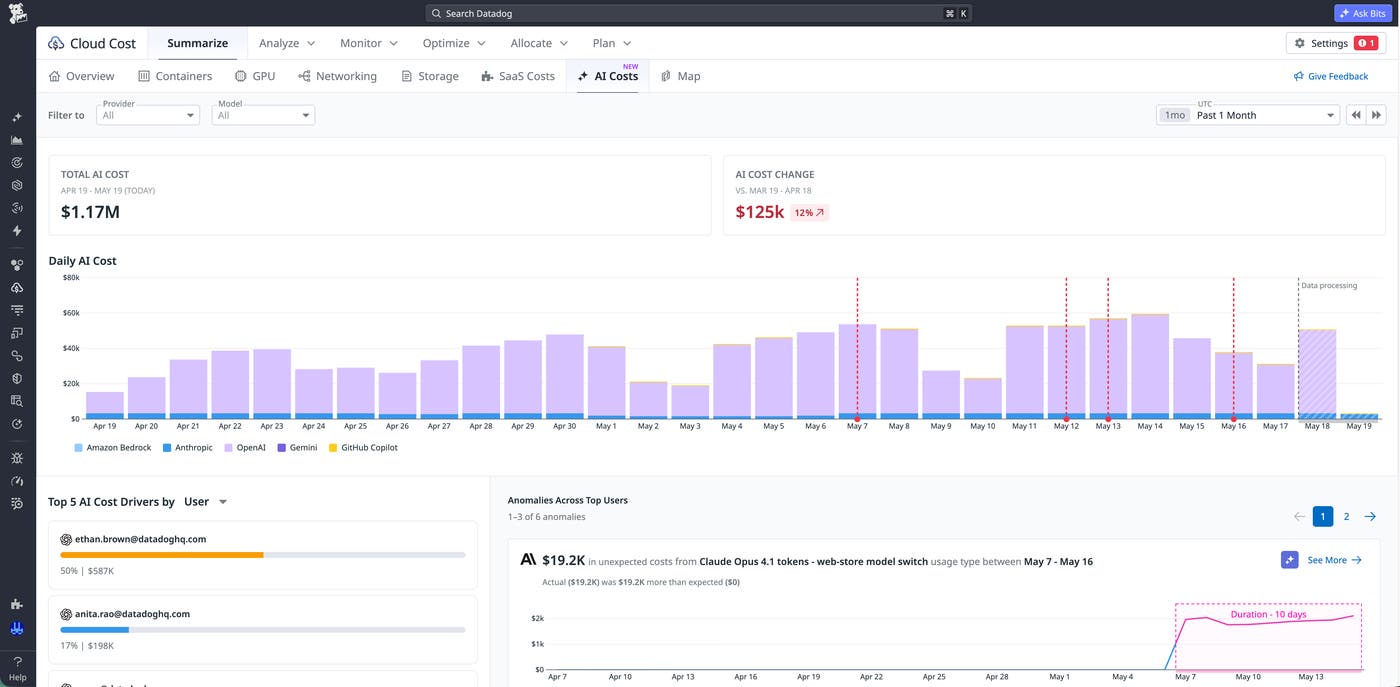
As organizations adopt more AI providers, costs become harder to track and even harder to attribute. Datadog Cloud Cost Management now brings AI spend across Anthropic, OpenAI, Amazon Bedrock, Google Gemini, Vertex AI, and GitHub Copilot into a single destination, alongside your existing cloud infrastructure costs. Consistent tags like model, project, and token type let you compare spend across providers, while out-of-the-box allocation rules automatically attribute Anthropic and OpenAI costs to the API keys and users driving them. From there, you can roll up usage to the teams, services, or business units accountable for it to build executive-ready reports and dashboards. Cost monitors and anomaly detection catch spikes before they show up on the bill, and pairing AI cost data with Datadog metrics turns raw spend into unit economics like cost per user. To learn more, read the AI Costs blog post and check out the AI Costs documentation.
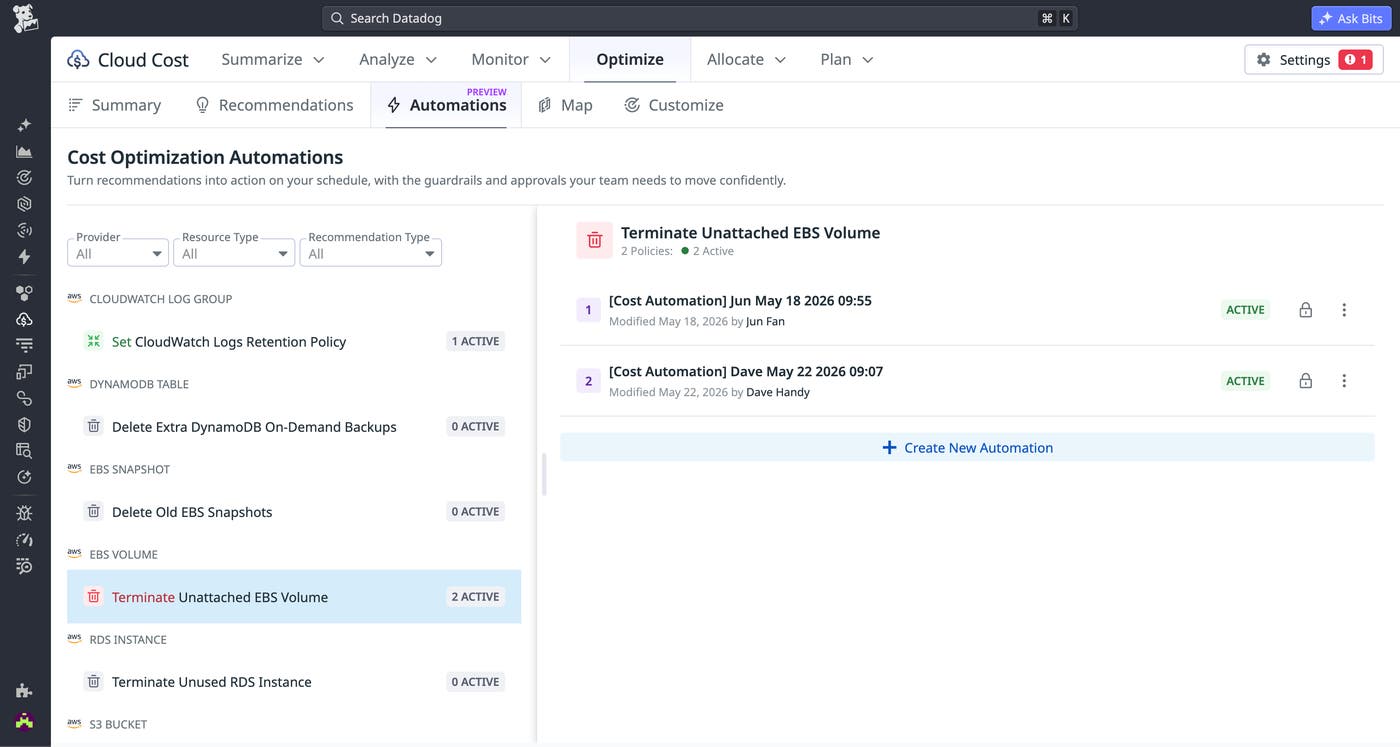
Cost optimization recommendations are easy to surface but hard to implement: Acting on them requires FinOps, SRE, and engineering to coordinate manual cleanup work against higher-priority roadmaps, so most opportunities never get off the backlog. Cost Optimization Automation in Datadog Cloud Cost Management closes that gap by continuously executing approved recommendations on your behalf. This enables you to turn recommendations into realized savings in a matter of hours, without consuming an engineering cycle. Create automations scoped by resource type, AWS account, region, and other tags. Then, set a cadence that fits your change windows, and connect the AWS environments you want in scope. Datadog runs every automation inside guardrails—pre-delete snapshots, IOPS feasibility checks, human-in-the-loop approval in Slack or Teams, and a complete audit trail of every change and execution—so every change is visible, reviewable, and under your control.
Cost Optimization Automation is generally available today for unattached EBS volumes, unused RDS instances, S3 Intelligent Tiering, CloudWatch Logs retention, DynamoDB backups, and unused EBS snapshots, with more recommendation types and provider coverage on the way. To learn more, visit our documentation.
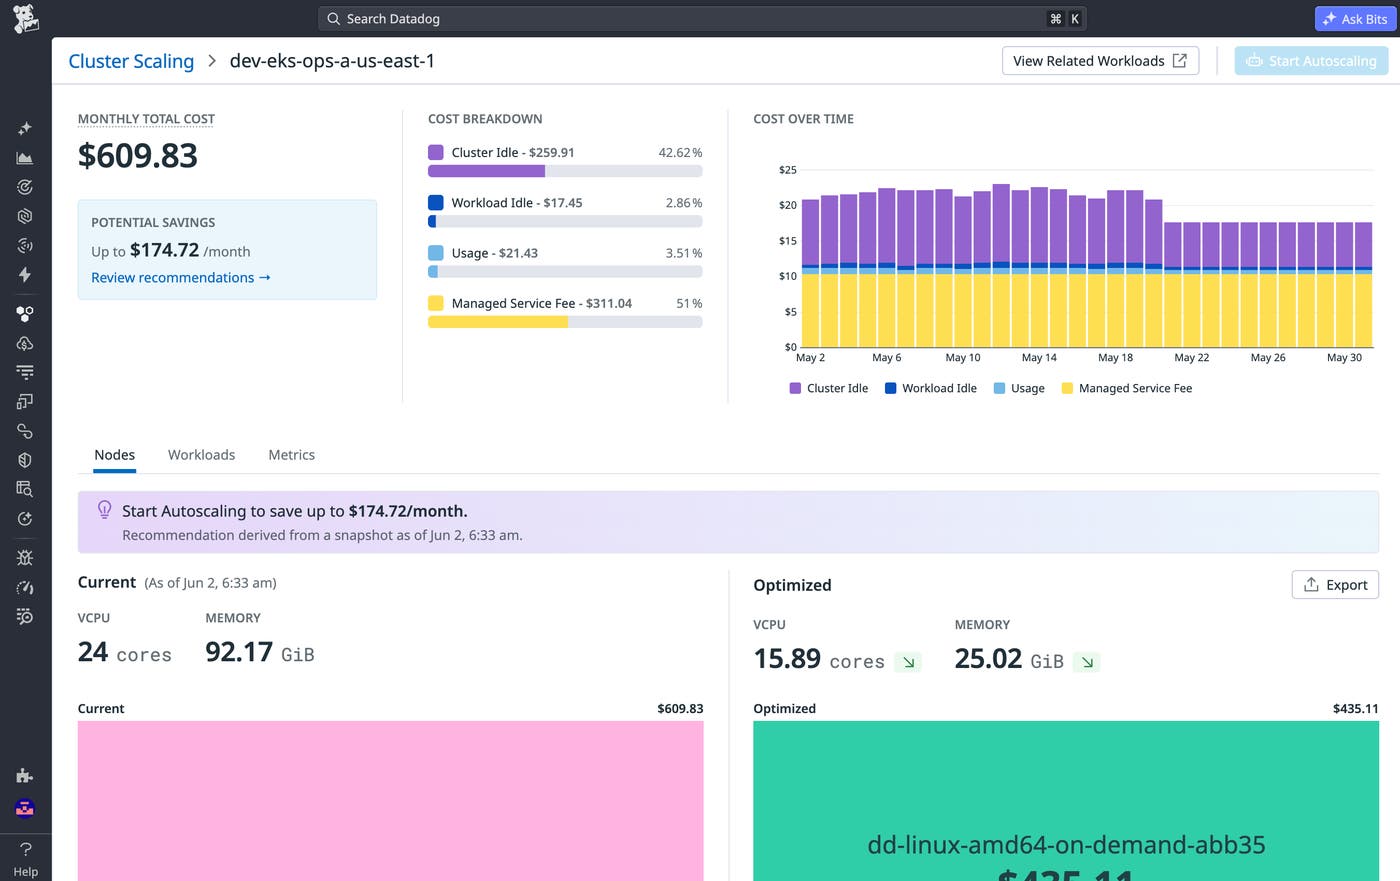
Datadog Cluster Autoscaling runs performance-informed simulations of your workloads to generate cost-saving instance type recommendations for open source node autoscaling solutions such as Karpenter. Cluster Autoscaling tackles overprovisioning by grounding recommendations in your actual workload performance, enabling you to reduce wasted capacity by identifying cluster idle spend, impacted workloads, and drifted autoscaler configurations. You can compound these savings by using Spot instances safely with interruption predictions to significantly reduce risk. Learn more in our Cluster Autoscaling documentation or sign up for the Spot Instance Management Preview to get started.
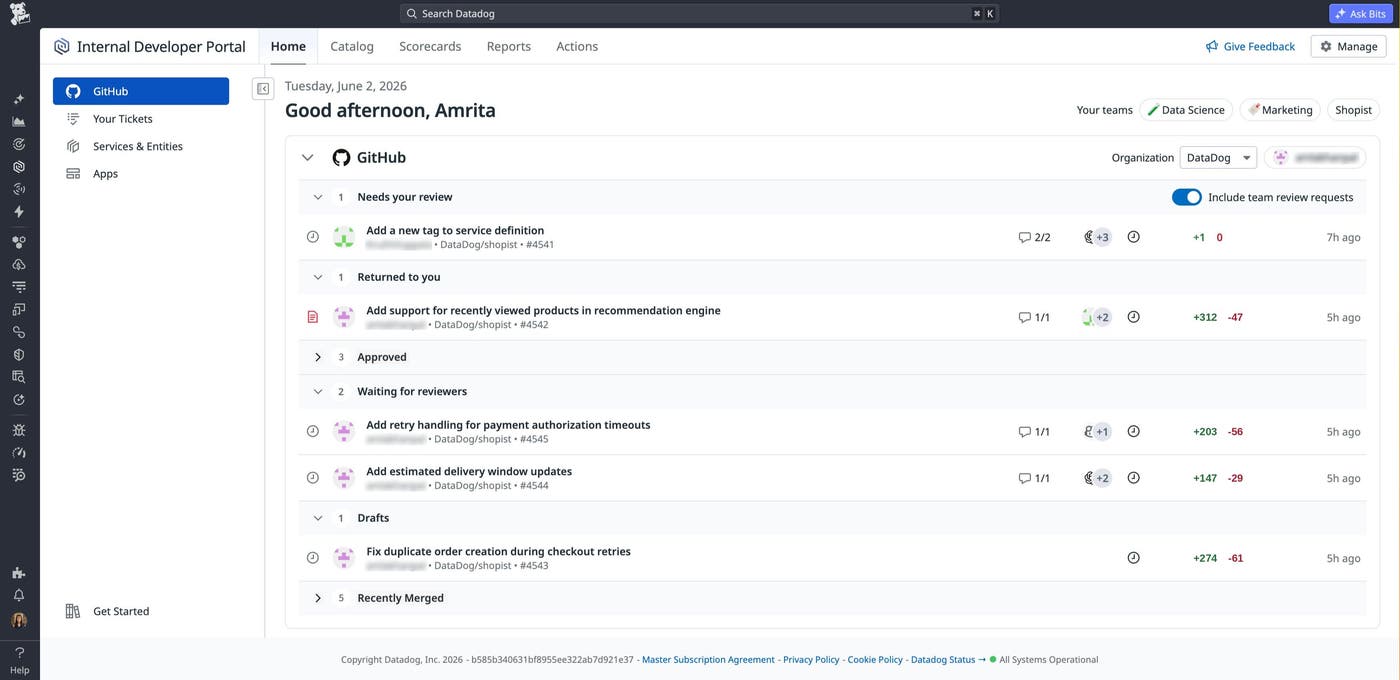
Engineers rely on many systems to prioritize their daily work; each day might start with checking pull requests, tickets, CI/CD failures, on-call handoffs, and service health. Each system provides useful context, but the work of turning signals into a clear plan often falls on the individual engineer. The IDP Homepage gives engineers a central starting point inside Datadog that brings together code changes, ownership context, and operational signals so they can move directly from “What should I check?” to “What should I do next?” Teams can also extend the homepage with custom apps built using App Builder or Datadog Apps, making it easy to incorporate internal tools and workflows that native integrations don’t cover. Read our blog post to learn more.
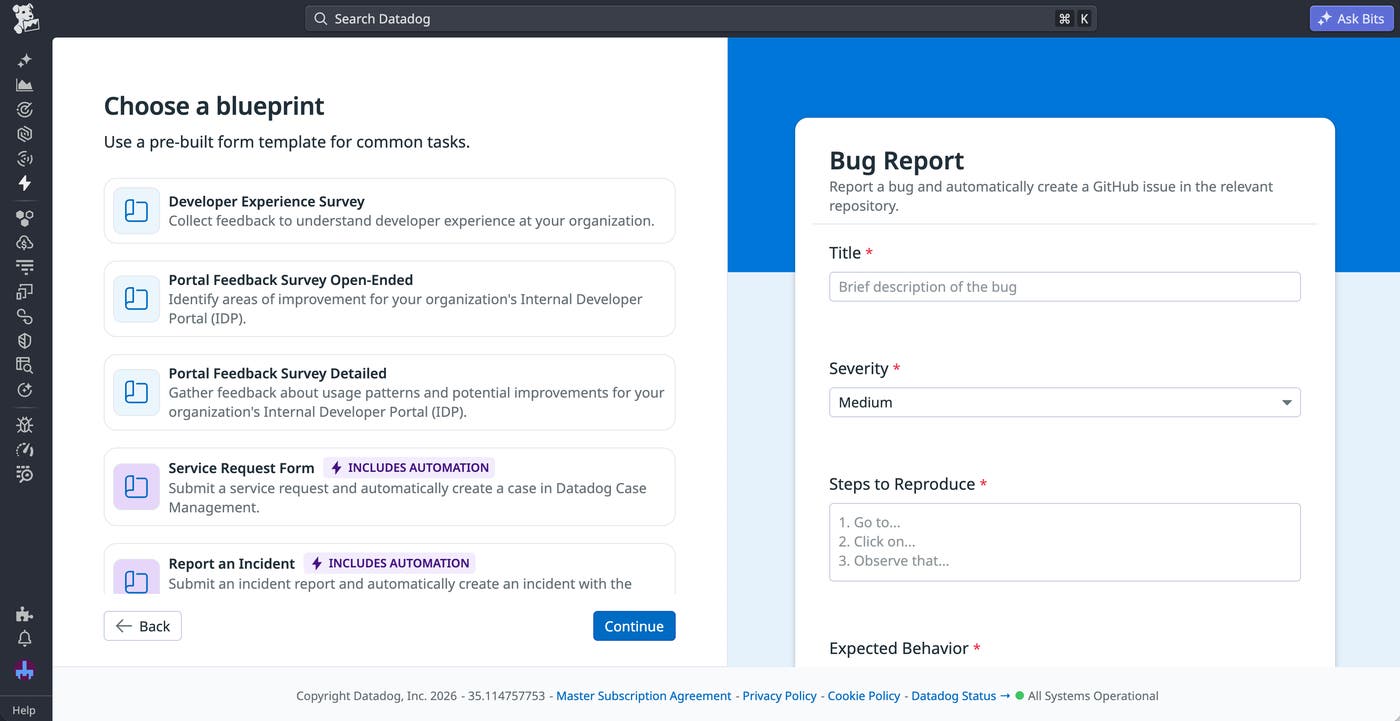
Datadog Forms and Case Management help teams manage incoming requests by connecting structured intake forms directly to operational case tracking. Teams can create forms for workflows such as IT access tickets, customer bug reports, and vulnerability disclosures and share them with Datadog users and external submitters. When a form is submitted, Datadog automatically creates a case populated with the required context so teams can begin triage and resolution with the information they need. Forms support conditional logic and required fields, while Case Management provides assignment, prioritization, notification, and workflow automation capabilities. Together, Forms and Case Management help teams centralize request intake, improve visibility into request trends, and spend less time chasing missing information.
To learn how Forms and Case Management simplify request workflows from intake to resolution, you can read our blog post or check out the documentation.
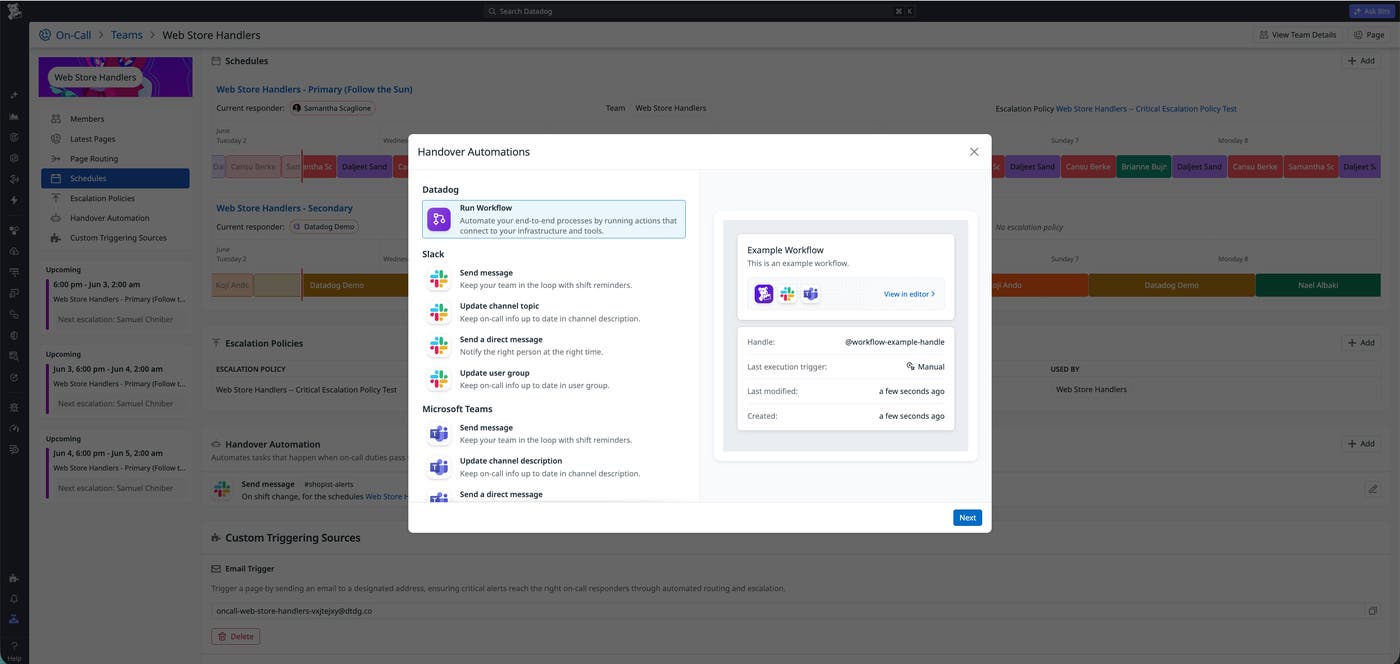
On-call shift changes are moments of high risk. If the handover doesn’t happen clearly, context gets lost and the incoming responder starts cold. Handover automations run actions automatically when shifts change, replacing manual updates like posting in Slack or updating channel topics. Configure per team: post a handover summary to a channel, update the channel topic with the incoming responder’s name, send them a direct message, or sync a Slack user group. Works with Slack, Microsoft Teams, and Datadog Workflow Automation. Learn more in the handover automation documentation.

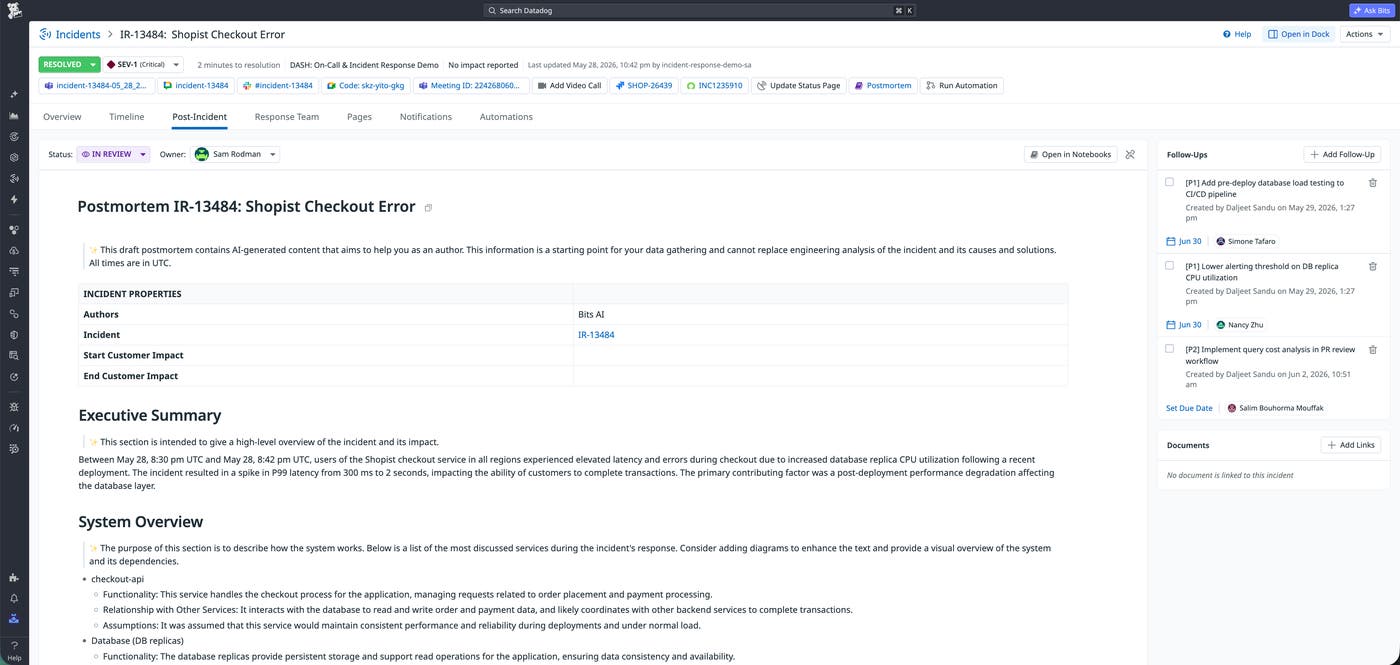
To ensure continuous improvement, post-incident work must be tracked and owned. You can now set a postmortem’s status to Draft, In Review, or Completed directly from the Post-Incident tab or from the incident Slack channel. You can also assign a dedicated postmortem owner, who can be the Incident Commander, to drive the review process to completion. All of this life cycle and ownership data is exposed as Incident facets, which lets engineering leadership easily report on postmortem coverage across the organization, such as by calculating the percentage of SEV-1 incidents with completed postmortems. Learn how to incorporate postmortem data for better reliability reporting on our Incident Postmortems documentation.
On-call knowledge can get lost at the end of every shift: which monitors are flappy, what fixed that 2 a.m. page, which alerts are safe to ignore. On-Call Recall automatically generates a shift summary at the end of every rotation, pulling each page, its monitor, the responder’s actions, and any linked incident into one place. Every page gets a machine-generated verdict (Actionable, Noise, Repeat, Unknown, or Escalated) so the next responder sees what to pay attention to, not just what fired. Repeat detection surfaces what was learned the last time the same monitor paged so engineers stop rediscovering the same fix at 3 a.m. To get started, request access to the Preview.
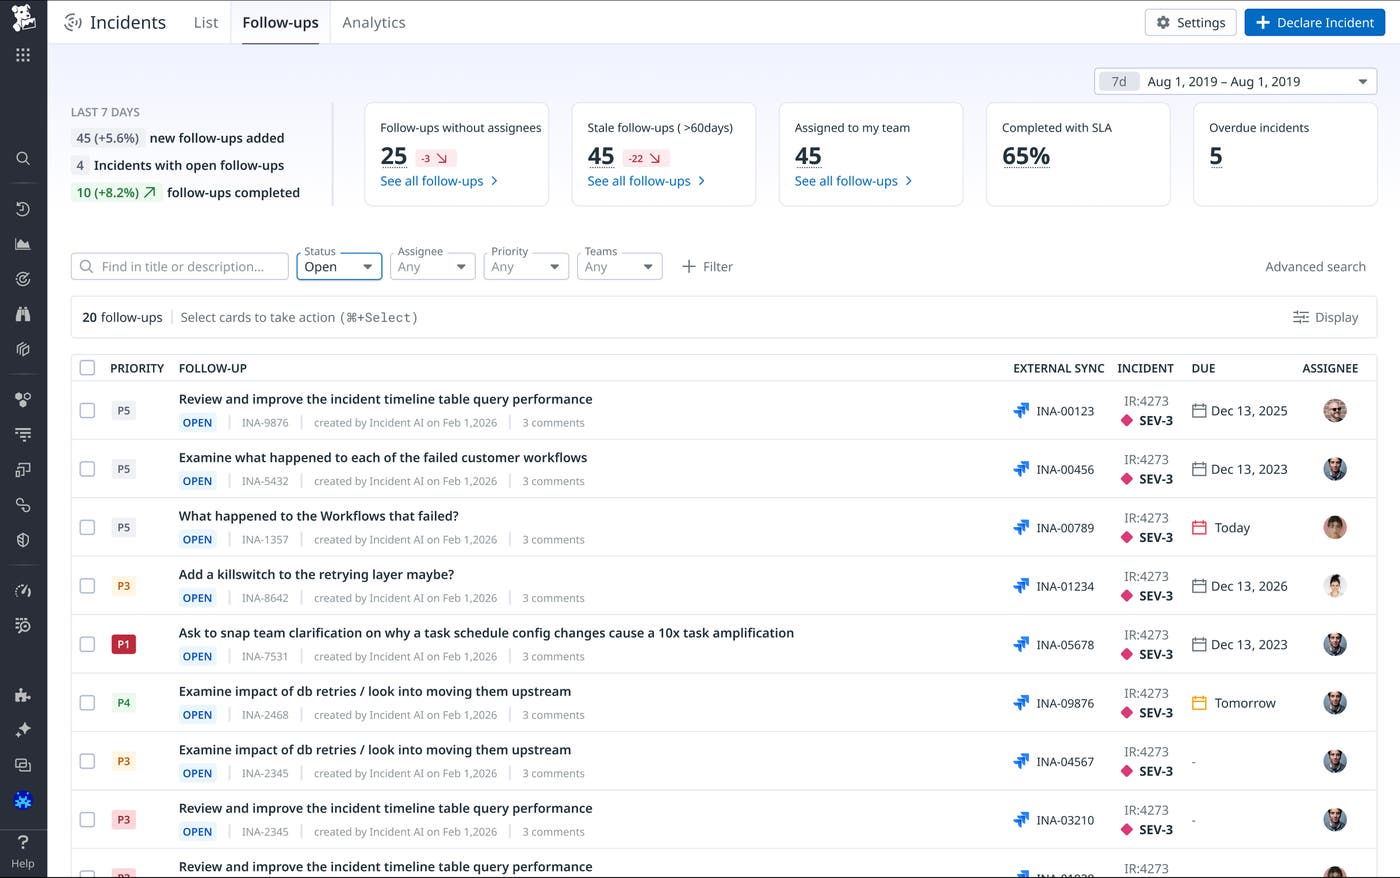
Follow-up tasks created during incidents have historically been buried inside individual incident records, invisible to anyone managing remediation across the organization. A new cross-incident follow-up view at the top level of Incident Management surfaces all open and completed tasks across every incident, filterable by assignee, team, severity, and date. Combined with follow-up analytics, engineering leads can track completion rates, identify recurring gaps, and measure whether remediation work is actually reducing recurrence over time. Learn more in the incident follow-ups documentation.

Microsoft Teams meeting links are now automatically posted and kept up to date in your incident channel so responders always have the right link without hunting for it mid-incident. When automatic channel and meeting creation are both enabled, the meeting link appears in the onboarding message the moment an incident is declared. The channel is also notified when a meeting is manually created or updated through the Datadog UI. Find out more in our Microsoft Teams and Datadog Incident Management integration documentation.

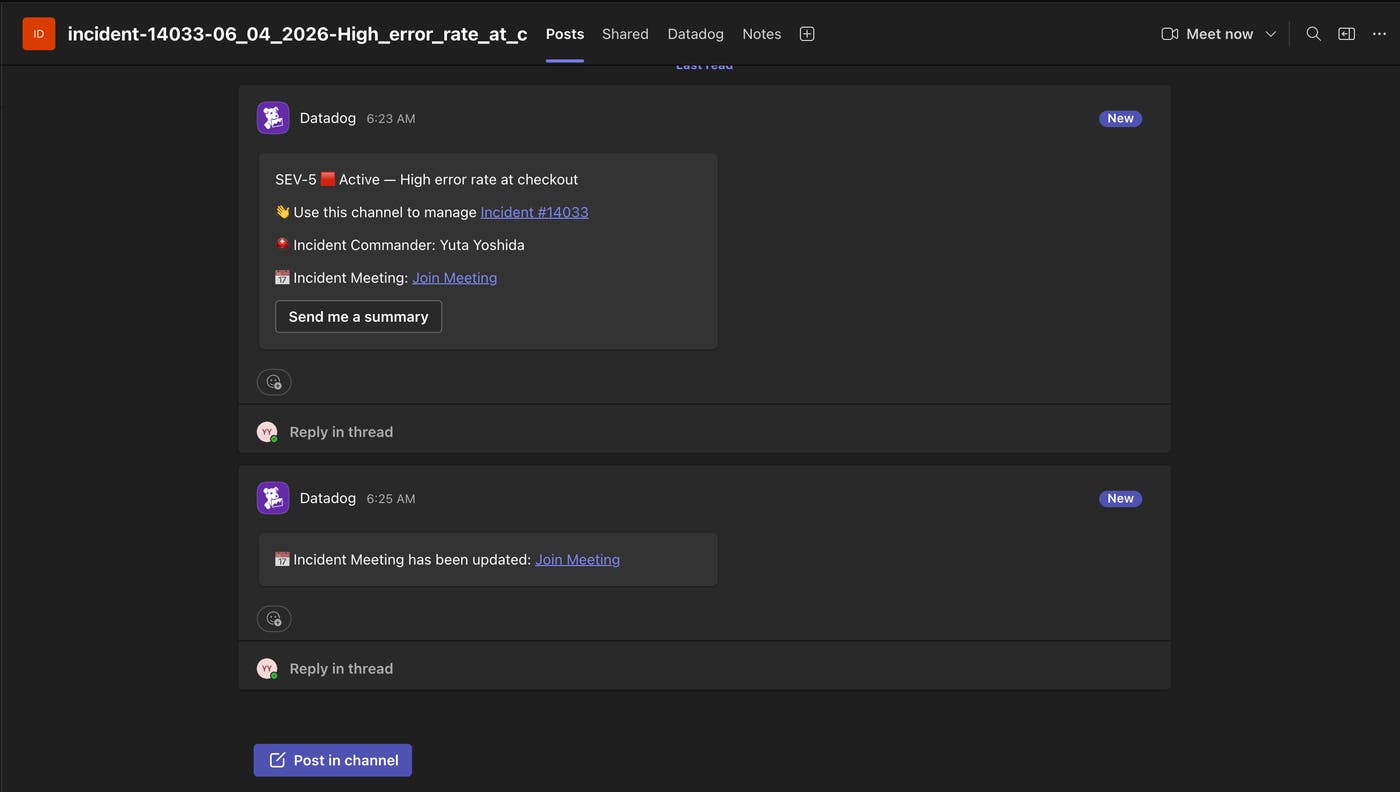
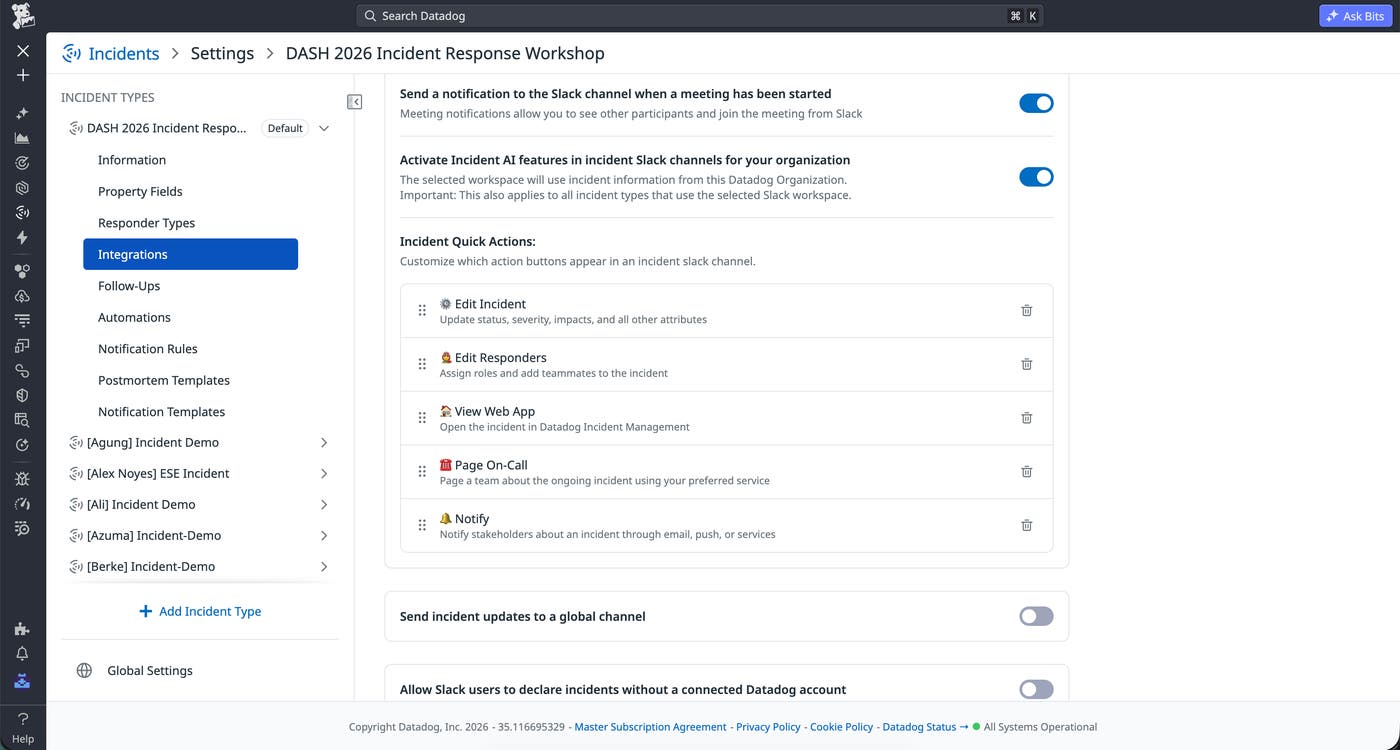
Managing an incident from Slack used to mean memorizing slash commands and hoping you typed them correctly under pressure. The updated Slack action tray surfaces all relevant incident actions the moment you join an incident channel, or on demand by using /datadog, removing friction between you and the action that needs to happen. Update severity, add responders, acknowledge pages, post status updates, and access related past incidents and observability context, all without leaving Slack. To learn more, read our Incident Management Slack integration documentation.

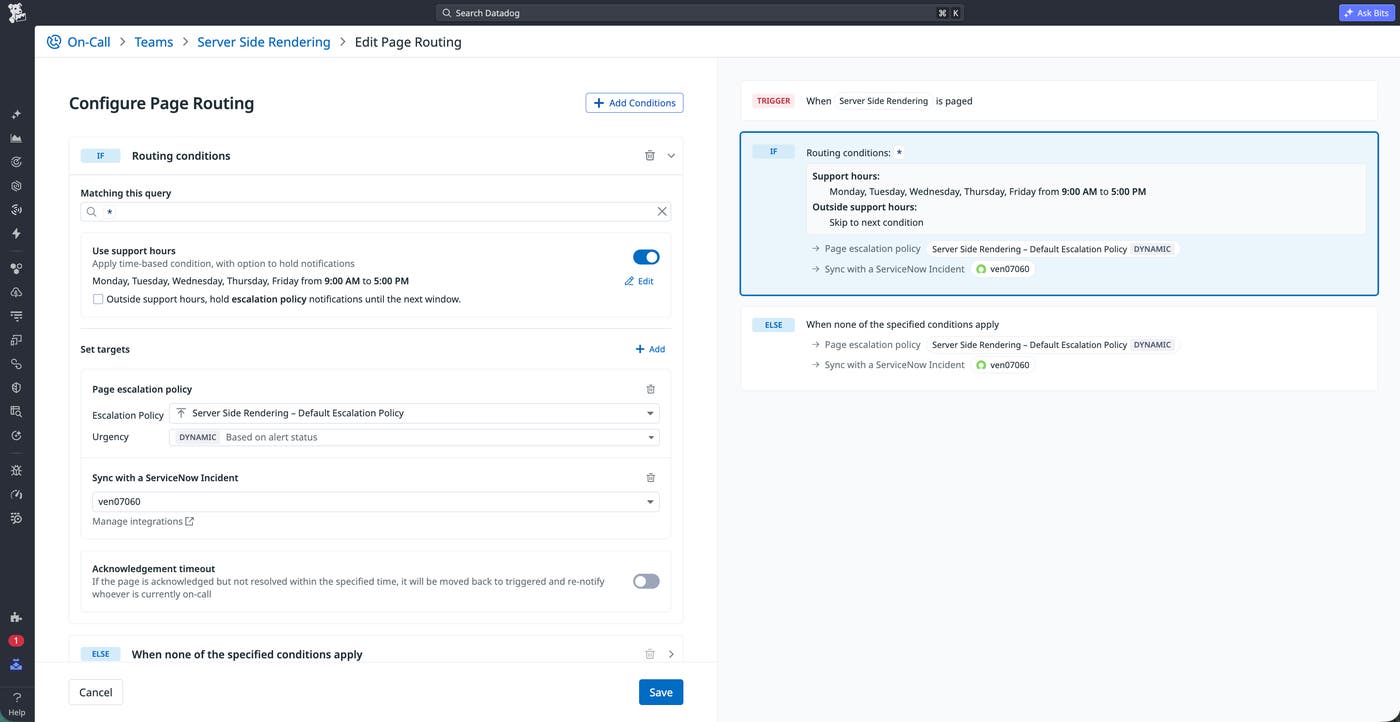
Enterprise teams shouldn’t have to choose between their ITSM workflow and their incident response tooling. Datadog Incident Management now keeps incidents in sync with ServiceNow and Jira. ServiceNow record IDs can replace Datadog incident keys as the display identifier, custom fields map directly to ServiceNow Configuration Items, and incident follow-ups export as bi-synced cases that stay in lockstep with Jira tickets. The result is a single source of truth across your incident and ITSM systems without manual duplication. Learn more in the Incident Management and ServiceNow integration and Incident Management and Jira integration documentation.
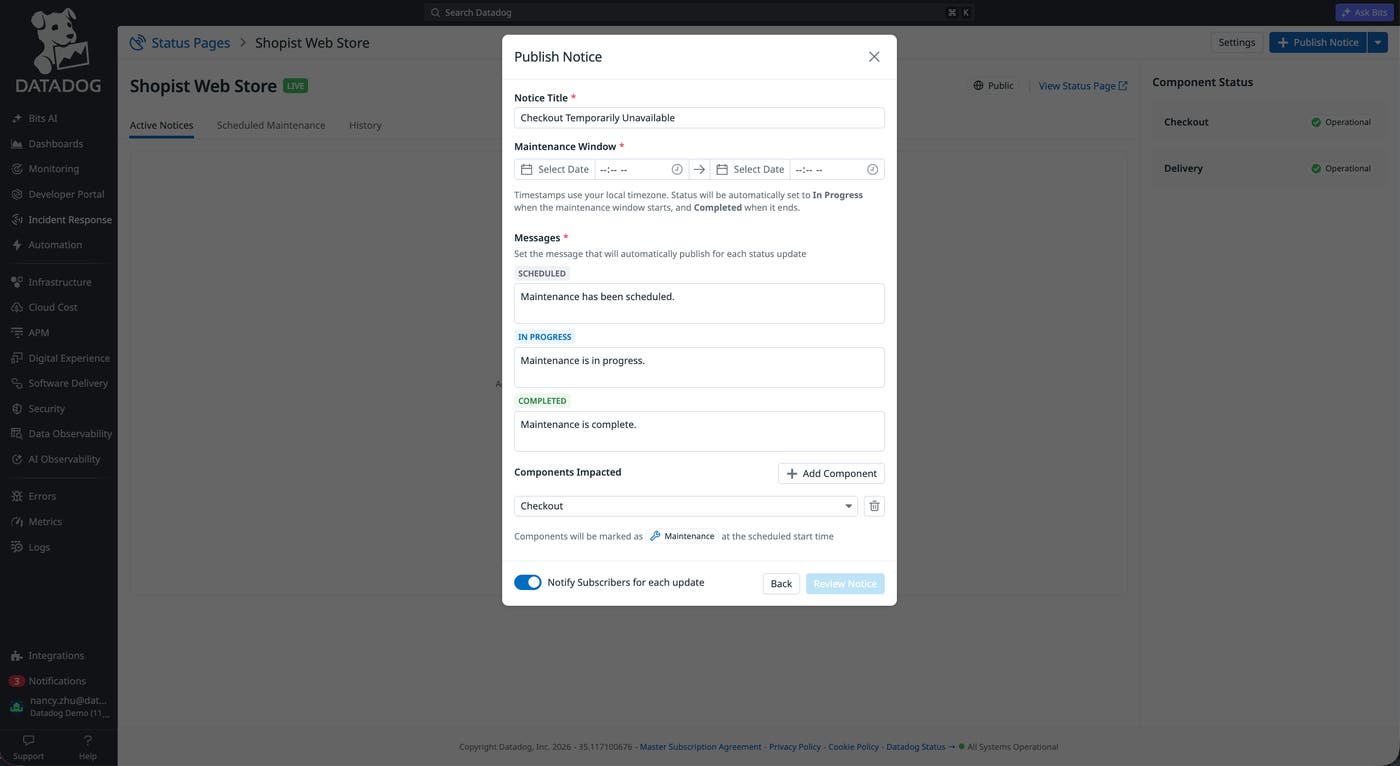
You can now schedule and communicate planned downtime directly from Datadog Status Pages, keeping your stakeholders informed before maintenance begins.
With Maintenance Windows, you can now:
Schedule planned downtime with title, description, time window, and impacted components
Display a notice on your status page so users see upcoming maintenance before work begins
Notify subscribers automatically when maintenance is scheduled, starts, and completes
To get started, visit the documentation.

此内容由惯性聚合(RSS阅读器)自动聚合整理,仅供阅读参考。 原文来自 — 版权归原作者所有。