


Organizations that depend on distributed systems often write their applications in Go to take advantage of concurrency features like channels and goroutines (e.g., Heroku, Basecamp, Cockroach Labs, and Datadog). If you are responsible for building or supporting Go applications, a well-considered logging strategy can help you understand user behavior, localize errors, and monitor the performance of your applications.
This post will show you some tools and techniques for managing Golang logs. We’ll begin with the question of which logging package to use for different kinds of requirements. Next, we’ll explain some techniques for making your logs more searchable and reliable, reducing the resource footprint of your logging setup, and standardizing your log messages.
Go gives you a wealth of options when choosing a logging package, and we’ll explore several of these below. While logrus is the most popular of the libraries we cover, and helps you implement a consistent logging format, the others have specialized use cases that are worth mentioning. This section will survey the libraries log, logrus, and glog.
Golang’s built-in logging library, called log, comes with a default logger that writes to standard error and adds a timestamp without the need for configuration. You can use these rough-and-ready logs for local development, when getting fast feedback from your code may be more important than generating rich, structured logs.
For example, you can define a division function that returns an error to the caller, rather than exiting the program, when you attempt to divide by zero.
package main
import (
"log"
"errors"
"fmt"
)
func divide(a float32, b float32) (float32, error) {
if b == 0 {
return 0, errors.New("can't divide by zero")
}
return a / b, nil
}
func main() {
var a float32 = 10
var b float32
ret, err := divide(a,b)
if err != nil{
log.Print(err)
}
fmt.Println(ret)
}
Because our example divides by zero, it will output the following log message:
2019/01/31 11:48:00 can't divide by zero
We recommend writing Golang logs using logrus, a logging package designed for structured logging that is well-suited for logging in JSON. The JSON format makes it possible for machines to easily parse your Golang logs. And since JSON is a well-defined standard, it makes it straightforward to add context by including new fields—a parser should be able to pick them up automatically.
Using logrus, you can define standard fields to add to your JSON logs by using the function WithFields, as shown below. You can then make calls to the logger at different levels, such as Info(), Warn() and Error(). The logrus library will write the log as JSON automatically and insert the standard fields, along with any fields you’ve defined on the fly.
package main
import (
log "github.com/sirupsen/logrus"
)
func main() {
log.SetFormatter(&log.JSONFormatter{})
standardFields := log.Fields{
"hostname": "staging-1",
"appname": "foo-app",
"session": "1ce3f6v",
}
log.WithFields(standardFields).WithFields(log.Fields{"string": "foo", "int": 1, "float": 1.1}).Info("My first ssl event from Golang")
}
The resulting log will include the message, log level, timestamp, and standard fields in a JSON object:
{"appname":"foo-app","float":1.1,"hostname":"staging-1","int":1,"level":"info","msg":"My first ssl event from Golang","session":"1ce3f6v","string":"foo","time":"2019-03-06T13:37:12-05:00"}
Some logging libraries allow you to enable or disable logging at specific levels, which is useful for keeping log volume in check when moving between development and production. One such library is glog, which lets you use flags at the command line (e.g., -v for verbosity) to set the logging level when you run your code. You can then use a V() function in if statements to write your Golang logs only at a certain log level.
For example, you can use glog to write the same “Can’t divide by zero” error from earlier, but only if you’re logging at the verbosity level of 2. You can set the verbosity to any signed 32-bit integer, or use the functions Info(), Warning(), Error(), and Fatal() to assign verbosity levels 0 through 3 (respectively).
if err != nil && glog.V(2){
glog.Warning(err)
}
You can make your application less resource intensive by logging only certain levels in production. At the same time, if there’s no impact on users, it’s often a good idea to log as many interactions with your application as possible, then use log management software like Datadog to find the data you need for your investigation
Once you’ve chosen a logging library, you’ll also want to plan for where in your code to make calls to the logger, how to store your logs, and how to make sense of them. In this section, we’ll recommend a series of best practices for organizing your Golang logs:
Make calls to the logger from within your main application process, not within goroutines.
Write logs from your application to a local file, even if you’ll ship them to a central platform later.
Standardize your logs with a set of predefined messages.
Send your logs to a central platform so you can analyze and aggregate them.
Use HTTP headers and unique IDs to log user behavior across microservices.
There are two reasons to avoid creating your own goroutines to handle writing logs. First, it can lead to concurrency issues, as duplicates of the logger would attempt to access the same io.Writer. Second, logging libraries usually start goroutines themselves, managing any concurrency issues internally, and starting your own goroutines will only interfere.
Even if you’re shipping your logs to a central platform, we recommend writing them to a file on your local machine first. You will want to make sure your logs are always available locally and not lost in the network. In addition, writing to a file means that you can decouple the task of writing your logs from the task of sending them to a central platform. Your applications themselves will not need to establish connections or stream your logs, and you can leave these jobs to specialized software like the Datadog Agent. If you’re running your Go applications within a containerized infrastructure that does not already include persistent storage—e.g., containers running on AWS Fargate—you may want to configure your log management tool to collect logs directly from your containers’ STDOUT and STDERR streams (this is handled differently in Docker and Kubernetes).
When writing calls to loggers from within their code, teams teams often use different attribute names to describe the same thing. Inconsistent attributes can confuse users and make it impossible to correlate logs that should form part of the same picture. For example, two developers might log the same error, a missing client name when handling an upload, in different ways.
A good way to enforce standardization is to create an interface between your application code and the logging library. The interface contains predefined log messages that implement a certain format, making it easier to investigate issues by ensuring that log messages can be searched, grouped, and filtered.
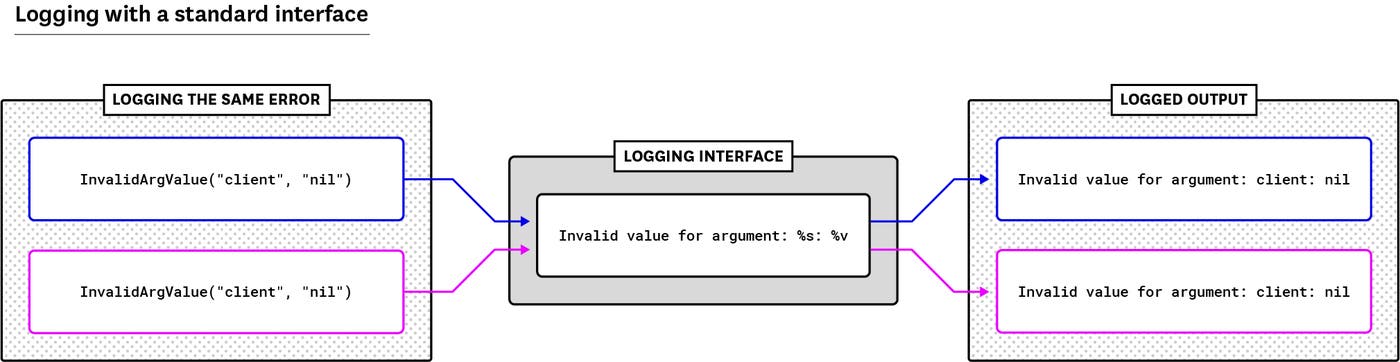
In this example, we’ll declare an Event type with a predefined message. Then we’ll use Event messages to make calls to a logger. Teammates can write Golang logs by providing a minimal amount of custom information, letting the application do the work of implementing a standard format.
First, we’ll write a logwrapper package that developers can include within their code.
package logwrapper
import (
"github.com/sirupsen/logrus"
)
// Event stores messages to log later, from our standard interface
type Event struct {
id int
message string
}
// StandardLogger enforces specific log message formats
type StandardLogger struct {
*logrus.Logger
}
// NewLogger initializes the standard logger
func NewLogger() *StandardLogger {
var baseLogger = logrus.New()
var standardLogger = &StandardLogger{baseLogger}
standardLogger.Formatter = &logrus.JSONFormatter{}
return standardLogger
}
// Declare variables to store log messages as new Events
var (
invalidArgMessage = Event{1, "Invalid arg: %s"}
invalidArgValueMessage = Event{2, "Invalid value for argument: %s: %v"}
missingArgMessage = Event{3, "Missing arg: %s"}
)
// InvalidArg is a standard error message
func (l *StandardLogger) InvalidArg(argumentName string) {
l.Errorf(invalidArgMessage.message, argumentName)
}
// InvalidArgValue is a standard error message
func (l *StandardLogger) InvalidArgValue(argumentName string, argumentValue string) {
l.Errorf(invalidArgValueMessage.message, argumentName, argumentValue)
}
// MissingArg is a standard error message
func (l *StandardLogger) MissingArg(argumentName string) {
l.Errorf(missingArgMessage.message, argumentName)
}
To use our logging interface, we only have to include it in our code and make calls to an instance of StandardLogger.
package main
import (
li "<PATH_TO_PACKAGE>/logwrapper"
)
func main() {
var standardLogger = := li.NewLogger()
// You can then call a method of our standard logger in the context of an error
// you would like to log.
standardLogger.InvalidArgValue("client", "nil")
}
When we run our code, we’ll get the following JSON log:
{"level":"error","msg":"Invalid value for argument: client: nil","time":"2019-03-04T11:21:07-05:00"}
If your application is deployed across a cluster of hosts, it’s not sustainable to SSH into each one in order to tail, grep, and investigate your logs. A more scalable alternative is to pass logs from local files to a central platform.
One solution is to use the Golang syslog package to forward logs from throughout your infrastructure to a single syslog server.
Another is to use a log management solution. Datadog, for example, can tail your log files and forward logs to a central platform for processing and analysis.
You can use attributes to graph the values of certain log fields over time, sorted by group. For example, you could track the number of errors by service to let you know if there’s an incident in one of your services. Showing logs from only the go-logging-demo service, we can see how many error logs this service has produced in a given interval.
You can also use attributes to drill down into possible causes, for instance seeing if a spike in error logs belongs to a specific host. You can then create an automated alert based on the values of your logs.
When troubleshooting an error, it’s often helpful to see what pattern of behavior led to it, even if that behavior involves a number of microservices. You can achieve this with distributed tracing, visualizing the order in which your application executes functions, database queries, and other tasks, and following these execution steps as they make their way through a network. One way to implement distributed tracing within your logs is to pass contextual information as HTTP headers.
In this example, one microservice receives a request and checks for a trace ID in the x-trace header, generating one if it doesn’t exist. When making a request to another microservice, we then generate a new spanID—for this and for every request—and add it to the header x-span.
func microService1(w http.ResponseWriter, r *http.Request) {
client := &http.Client{}
trace := r.Header.Get("x-trace")
if ( trace == "") {
trace = generateTraceId()
}
span := generateSpanId()
// Hit the second microservice with the appropriate headers
reqService2, _ := http.NewRequest("GET", "<ADDRESS>", nil)
reqService2.Header.Add("x-trace", trace)
reqService2.Header.Add("x-span", span)
resService2, _ := client.Do(reqService2)
}
Downstream microservices use the x-span headers of incoming requests to specify the parents of the spans they generate, and send that information as the x-parent header to the next microservice in the chain.
func microService2(w http.ResponseWriter, r *http.Request) {
trace := r.Header.Get("x-trace")
span := generateSpanId()
parent := r.Header.Get("x-span")
if (trace == "") {
w.Header().Set("x-parent", parent)
}
w.Header().Set("x-trace", trace)
w.Header().Set("x-span", span)
if (parent == "") {
w.Header().Set("x-parent", span)
}
w.WriteHeader(http.StatusOK)
io.WriteString(w, fmt.Sprintf(aResponseMessage, 2, trace, span, parent))
}
If an error occurs in one of our microservices, we can use the trace, parent, and span attributes to see the route that a request has taken, letting us know which hosts—and possibly which parts of the application code—to investigate.
In the first microservice:
{"appname":"go-logging","level":"debug","msg":"Hello from Microservice One","trace":"eUBrVfdw","time":"2017-03-02T15:29:26+01:00","span":"UzWHRihF"}
In the second:
{"appname":"go-logging","level":"debug","msg":"Hello from Microservice Two","parent":"UzWHRihF","trace":"eUBrVfdw","time":"2017-03-02T15:29:26+01:00","span":"DPRHBMuE"}
If you want to dig more deeply into Golang tracing possibilities, you can use a tracing library such as OpenTracing or a monitoring platform that supports distributed tracing for Go applications. For example, Datadog can automatically build a map of services using data from its Golang tracing library; visualize trends in your traces over time; and let you know about services with unusual request rates, error rates, or latency.
In this post, we’ve highlighted the benefits and tradeoffs of several Go logging libraries. We’ve also recommended ways to ensure that your logs are available and accessible when you need them, and that the information they contain is consistent and easy to analyze.
To start analyzing all of your Go logs with Datadog, sign up for a free trial.
此内容由惯性聚合(RSS阅读器)自动聚合整理,仅供阅读参考。 原文来自 — 版权归原作者所有。