


This post is part 2 of a 4-part series about monitoring Elasticsearch performance. Part 1 provides an overview of Elasticsearch and its key performance metrics, Part 3 describes how to monitor Elasticsearch with Datadog, and Part 4 discusses how to solve five common Elasticsearch problems.
If you’ve already read Part 1 of this series, you have an idea of how Elasticsearch works, and which metrics can help you assess its performance. In this post, we’ll show you a few of the tools that can help you collect those metrics:
Cluster health and performance APIs
cat API for tabular data
Dedicated monitoring tools (ElasticHQ, Kopf, Marvel)
As mentioned in Part 1, Elasticsearch makes it easy to interact with your clusters via RESTful API—you can easily index documents, update your cluster settings, and submit queries on the fly. These APIs also provide data points that give you a snapshot of how your clusters are performing.
By default, Elasticsearch’s APIs expose metrics on port 9200, and return JSON responses about your clusters, nodes, and indices. There are five main HTTP APIs that you can use to monitor Elasticsearch:
Node Stats API
Cluster Stats API
Index Stats API
Cluster Health API
Pending Tasks API
As you can see from the table below, all of the Elasticsearch metrics covered in Part 1 can be retrieved via these API endpoints. Some of the metrics are exposed on multiple levels, such as search performance, which is provided on an index-level and node-level scope.
| Metric category | Availability |
|---|---|
| Search performance metrics | Node Stats API, Index Stats API |
| Indexing performance metrics | Node Stats API, Index Stats API |
| Memory and garbage collection | Node Stats API, Cluster Stats API |
| Network metrics | Node Stats API |
| Cluster health and node availability | Cluster Health API |
| Resource saturation and errors | Node Stats API, Index Stats API, Cluster Stats API, Pending Tasks API |
The commands in this post are formatted under the assumption that you are running each Elasticsearch instance’s HTTP service on the default port (9200). They are also directed to localhost, which assumes that you are submitting the request locally; otherwise, replace localhost with your node’s IP address.
The Node Stats API is a powerful tool that provides access to nearly every metric from Part 1, with the exception of overall cluster health and pending tasks, which are only available via the Cluster Health API and the Pending Tasks API, respectively. The command to query the Node Stats API is:
curl localhost:9200/_nodes/stats
The output includes very detailed information about every node running in your cluster. You can also query a specific node by specifying the ID, address, name, or attribute of the node. In the command below, we are querying two nodes by their names, node1 and node2 (node.name in each node’s configuration file):
curl localhost:9200/_nodes/node1,node2/stats
Each node’s metrics are divided into several sections, listed here along with the metrics they contain from Part 1.
The largest section is called indices, which contains detailed statistics gathered across all of the indices stored on the node in question. This is where you will find many key metrics, including but not limited to:
Query and fetch performance metrics from Part 1 that are prefixed indices.search.*
Indexing performance metrics from Part 1 that are prefixed indices.indexing.*, indices.refresh.*, and indices.flush.*
Fielddata cache metrics (cache size and evictions)
The other sections are as follows:
os: Information about the operating system’s resource usage, including CPU utilization and memory usage.
process: Like the os section, this section offers metrics about resource usage, but limited to what the Elasticsearch JVM process is using. This section also provides the number of open file descriptors being used by Elasticsearch.
jvm: This is where you will find all of the JVM metrics, including JVM heap currently in use, amount of JVM heap committed, and the total count and time spent on young- and old-generation garbage collections. Note that garbage collection count is cumulative, so the longer a node has been running, the higher this number will be.
thread_pool: Provides the number of active, queued, and rejected threads for each thread pool; the main ones to focus on are bulk (renamed to write in v. 6.3.x+), merge, and search.
fs: File system information (available disk space and disk I/O stats).
transport: Stats about cluster communication (bytes sent and received).
http: Number of HTTP connections currently open and total number of HTTP connections opened over time.
breakers (only applicable for version 1.4 or later): Information about the circuit breakers. The most important section here is “fielddata”, which tells you the maximum size a query can be before tripping this circuit breaker. It also tells you how many times the circuit breaker has been tripped. The higher this number is, the more you may want to look into optimizing your queries or upgrading your memory.
You can also limit your query to one or more categories of stats by adding them at the end of the command in comma-separated form:
curl localhost:9200/_nodes/datanode1/stats/jvm,http
The resulting output provides information limited to datanode1’s JVM and HTTP metrics:
{
"cluster_name": "elasticsnoop",
"nodes": {
"GSbeuE0ZSYyjAZFskaGegw": {
"name": "datanode1",
"transport_address": "127.0.0.1:9300",
"host": "127.0.0.1",
"ip": "127.0.0.1",
"version": "2.3.3",
"build": "218bdf1",
"http_address": "127.0.0.1:9200",
"jvm": {
"pid": 16699,
"version": "1.8.0_91",
"vm_name": "Java HotSpot(TM) 64-Bit Server VM",
"vm_version": "25.91-b14",
"vm_vendor": "Oracle Corporation",
"start_time_in_millis": 1471370337269,
"mem": {
"heap_init_in_bytes": 268435456,
"heap_max_in_bytes": 1038876672,
"non_heap_init_in_bytes": 2555904,
"non_heap_max_in_bytes": 0,
"direct_max_in_bytes": 1038876672
},
"gc_collectors": [
"ParNew",
"ConcurrentMarkSweep"
],
"memory_pools": [
"Code Cache",
"Metaspace",
"Compressed Class Space",
"Par Eden Space",
"Par Survivor Space",
"CMS Old Gen"
],
"using_compressed_ordinary_object_pointers": "true"
},
"http": {
"bound_address": [
"[fe80::1]:9200",
"[::1]:9200",
"127.0.0.1:9200"
],
"publish_address": "127.0.0.1:9200",
"max_content_length_in_bytes": 104857600
}
}
}
}
The Cluster Stats API provides cluster-wide information, so it basically adds together all of the stats from each node in the cluster. It does not provide the level of detail that the Node Stats API offers, but it is useful for getting a general idea of how your cluster is doing. The command to query this API is:
curl localhost:9200/_cluster/stats
The output provides important high-level information like cluster status, basic metrics about your indices (number of indices, shard and document count, fielddata cache usage) and basic statistics about the nodes in your cluster (number of nodes by type, file descriptors, memory usage, installed plugins).
Need to check on stats pertaining to one particular index? Consult the Index Stats API, substituting index_name with the actual name of the index:
curl localhost:9200/index_name/_stats?pretty=true
Ending your request with ?pretty=true formats the resulting JSON output. The output delivers many of the same categories of metrics found within the indices section of the Node Stats API output, except limited to the scope of this particular index. You can access metrics about indexing performance, search performance, merging activity, segment count, size of the fielddata cache, and number of evictions from the fielddata cache. These metrics are provided on two levels: aggregated across all shards in the index, and limited to just the index’s primary shards.
Querying the Index Stats API is helpful if you know that there are certain indices in your cluster that you want to monitor more closely because they are receiving more index or search requests.
This API exposes key information about the health of your cluster in a JSON response:
curl localhost:9200/_cluster/health?pretty=true
{
"cluster_name": "my_cluster",
"status": "red",
"timed_out": false,
"number_of_nodes": 2,
"number_of_data_nodes": 2,
"active_primary_shards": 28,
"active_shards": 53,
"relocating_shards": 0,
"initializing_shards": 0,
"unassigned_shards": 2,
"delayed_unassigned_shards": 0,
"number_of_pending_tasks": 0,
"number_of_in_flight_fetch": 0,
"task_max_waiting_in_queue_millis": 0,
"active_shards_percent_as_number": 96.36363636363636
}
The output offers an overview of shard status (number of active, initializing, and unassigned shards), number of nodes, and the cluster status. In this example, the cluster status is red because one or more primary shards have not been assigned, meaning that data is missing and search results will not be complete.
The Pending Tasks API is a quick way to look at your cluster’s pending tasks in more detail. As mentioned in part 1, pending tasks are tasks that only the master node can perform, like creating new indices or redistributing shards around the cluster. If the master node is unable to keep up with the rate of these requests, pending tasks will begin to queue and you will see this number rise. To query pending tasks, run:
curl localhost:9200/_cluster/pending_tasks
If all is well, you’ll receive an empty list as the JSON response:
{"tasks":[]}
Otherwise, you’ll receive information about each pending task’s priority, how long it has been waiting in the queue, and what action it represents:
{
"tasks" : [ {
"insert_order" : 13612,
"priority" : "URGENT",
"source" : "delete-index [old_index]",
"executing" : true,
"time_in_queue_millis" : 26,
"time_in_queue" : "26ms"
}, {
"insert_order" : 13613,
"priority" : "URGENT",
"source" : "shard-started ([new_index][0], node[iNTLLuV0R_eYdGGDhBkMbQ], [P], v[1], s[INITIALIZING], a[id=8IFnF0A5SMmKQ1F6Ot-VyA], unassigned_info[[reason=INDEX_CREATED], at[2016-07-28T19:46:57.102Z]]), reason [after recovery from store]",
"executing" : false,
"time_in_queue_millis" : 23,
"time_in_queue" : "23ms"
}, {
"insert_order" : 13614,
"priority" : "URGENT",
"source" : "shard-started ([new_index][0], node[iNTLLuV0R_eYdGGDhBkMbQ], [P], v[1], s[INITIALIZING], a[id=8IFnF0A5SMmKQ1F6Ot-VyA], unassigned_info[[reason=INDEX_CREATED], at[2016-07-28T19:46:57.102Z]]), reason [master {master-node-1}{iNTLLuV0R_eYdGGDhBkMbQ}{127.0.0.1}{127.0.0.1:9300} marked shard as initializing, but shard state is [POST_RECOVERY], mark shard as started]",
"executing" : false,
"time_in_queue_millis" : 20,
"time_in_queue" : "20ms"
} ]
}
The cat API offers an alternate way to view the same metrics that are available from Elasticsearch’s previously mentioned APIs. Named after the UNIX cat command, the cat API returns data in tabular form instead of JSON. The commands available are shown below:
curl http://localhost:9200/_cat
=^.^=
/_cat/allocation
/_cat/shards
/_cat/shards/{index}
/_cat/master
/_cat/nodes
/_cat/indices
/_cat/indices/{index}
/_cat/segments
/_cat/segments/{index}
/_cat/count
/_cat/count/{index}
/_cat/recovery
/_cat/recovery/{index}
/_cat/health
/_cat/pendingtasks
/_cat/aliases
/_cat/aliases/{alias}
/_cat/threadpool
/_cat/plugins
/_cat/fielddata
/_cat/fielddata/{fields}
/_cat/nodeattrs
/_cat/repositories
/_cat/snapshots/{repository}
For example, to query specific metrics from the cat nodes API, you must first find out the names of the available metrics. To do so, run:
curl localhost:9200/_cat/nodes?help
The response will show you the names of metrics, along with descriptions. You can then use those metric names to form your query. For example, if you want to find out the heap used (heapCurrent), number of segments (segmentsCount), and number of completed merges (mergesTotal), you would list the metric names in comma-separated form at the end of the query like so:
curl 'localhost:9200/_cat/nodes?v&h=heapPercent,segmentsCount,mergesTotal'
Running the command with ?v at the end tells the API to return the column headers. The output would provide the specific metrics in a simple tabular format:
heapPercent segmentsCount mergesTotal
11 115 32
These metrics should match what’s in the Node Stats API’s output for jvm.mem.heap_used_percent, segments.count, and merges.total. The cat API is a great way to quickly get a sense of the status of your clusters, nodes, indices, or shards in a readable format.
Elasticsearch’s HTTP APIs quickly deliver useful statistics about your clusters, but these metrics can only tell you about one particular moment in time. The other downside is that the more nodes you need to monitor, the longer the resulting output. As you’re sifting through all of that JSON, it can be difficult to identify problematic nodes and spot troubling trends.
In order to monitor Elasticsearch more effectively, you’ll need a tool that can regularly query these APIs on your behalf and aggregate the resulting metrics into a meaningful representation of the state of your cluster. In this section, we’ll show you how to install and use some of these tools so you can start collecting Elasticsearch metrics.
ElasticHQ is an open source monitoring tool available as a hosted solution, plugin, or download. It provides metrics about your clusters, nodes, and indices, as well as information related to your queries and mappings. See a full list of metrics collected here.
To install the plugin, run the following command from the elasticsearch/bin directory:
./plugin install royrusso/elasticsearch-HQ
After you’ve installed the plugin, open up a browser and navigate to localhost:9200/_plugin/hq/ and select the name of the cluster you want to monitor.
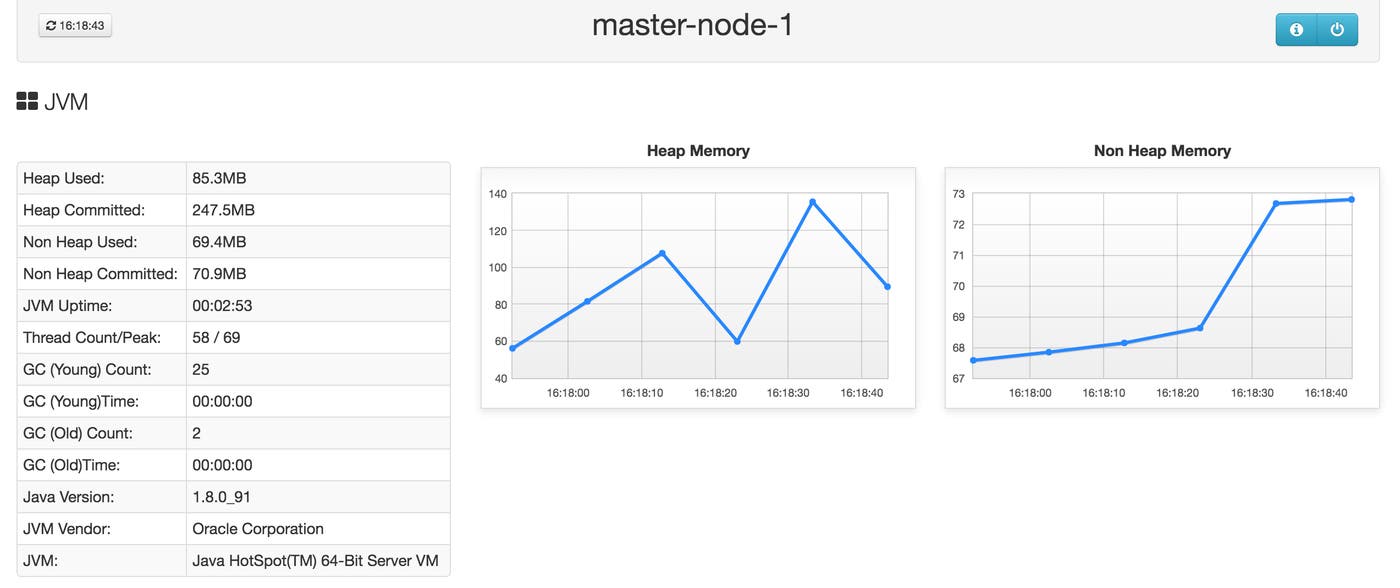
The Cluster Overview page shows you the state of your cluster’s health and shards, as well as index-level information (number of documents stored on each index, size of the index in bytes, and number of primary and replica shards per index). Navigating to localhost:9200/_plugin/hq/#nodediagnostics will give you at-a-glance information about refresh and flush time, memory usage, cache activity, disk space usage, and network usage. You can drill down into a node to see node-specific graphs of JVM heap usage, the operating system (CPU and memory usage), thread pool activity, processes, network connections, and disk reads/writes.
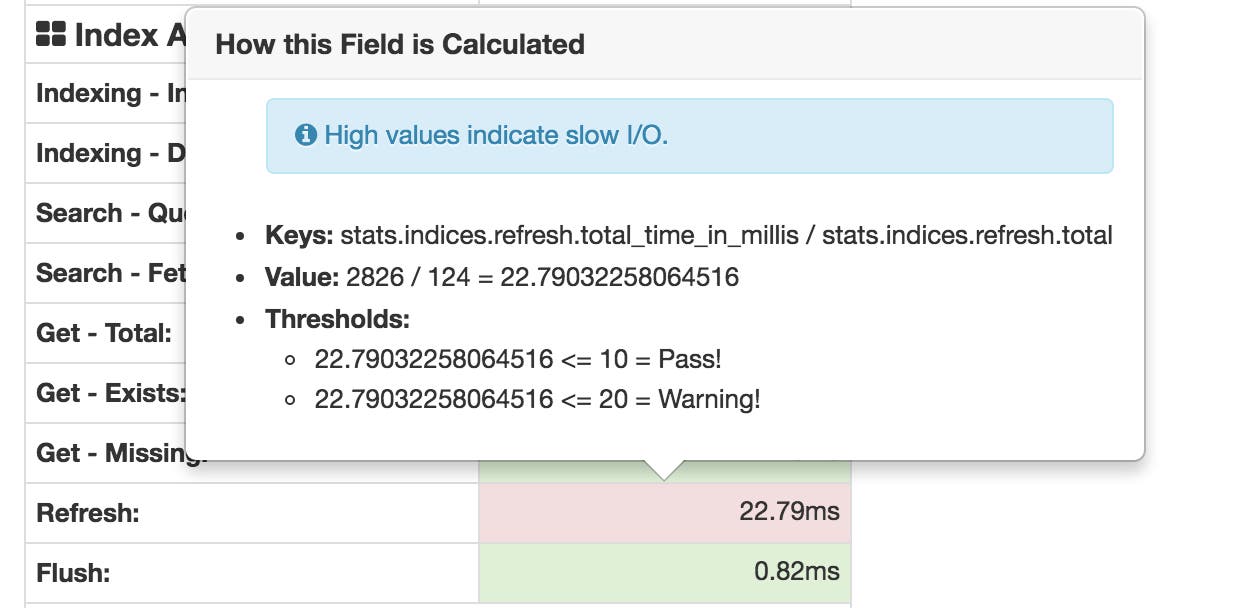
ElasticHQ automatically color-codes metrics to highlight potential problems. For example, in the screenshot below, we see a potential issue with the index’s refresh time highlighted in red. In this example, since the average refresh process takes over 20 milliseconds, it warns that you may have a problem with slow I/O.
Like the Index Stats API, you can also navigate into any particular index to see that index’s query and fetch time, document count, and get-by-ID metrics.
Kopf is another open source tool that makes it easier to query and interact with your clusters using many of the available API methods. It also provides some monitoring functionality, although it does not allow you to view any timeseries graphs for the metrics provided.
To install Kopf, navigate to your elasticsearch/bin directory and run:
./plugin install lmenezes/elasticsearch-kopf/{branch|version}
open http://localhost:9200/_plugin/kopf
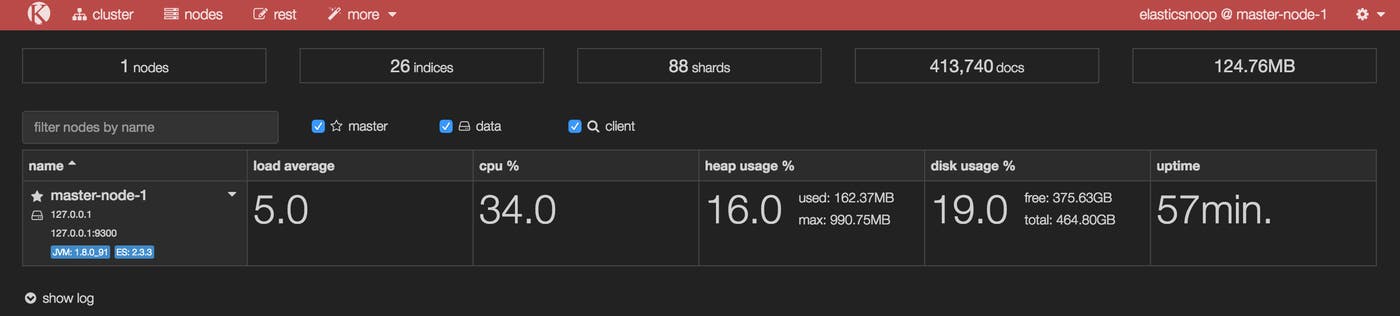
The Kopf dashboard displays everything from overall cluster health to node-level stats, such as per-node load average, CPU usage, heap usage, disk usage, and uptime:
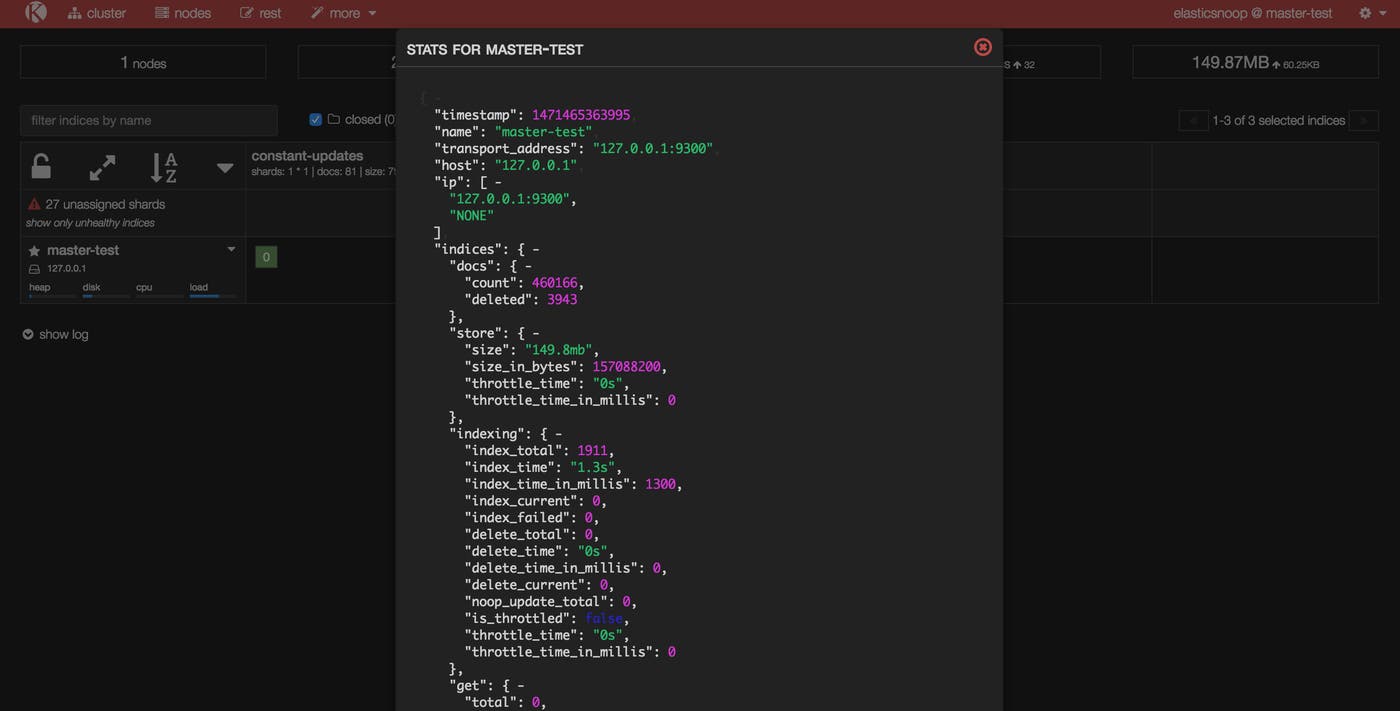
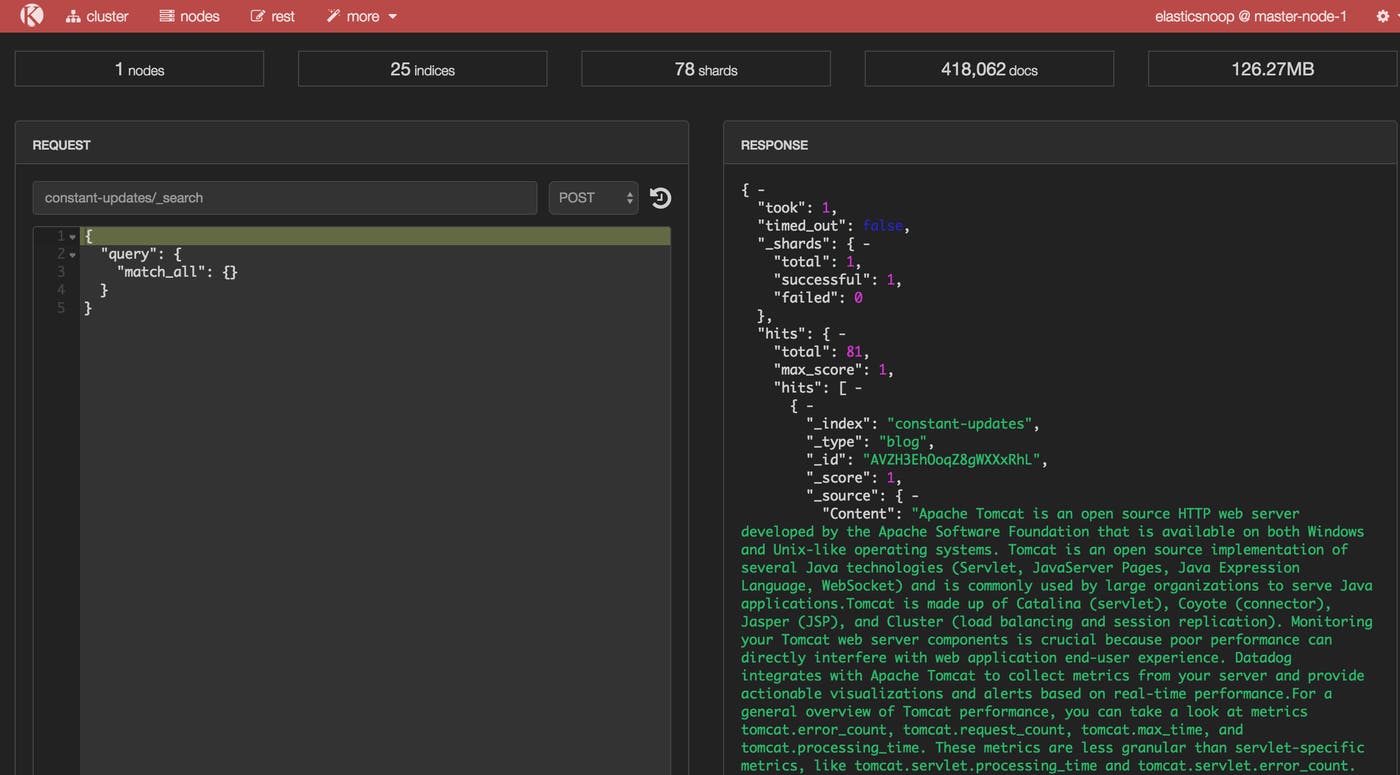
You can also access each node’s Node Stats API information in JSON format, as shown below for a node by the name of master-test:
Elastic, the company behind Elasticsearch, created Marvel, a dedicated monitoring solution that helps you assess and visualize many of the metrics mentioned in Part 1. Marvel is free to use in development and production with a basic license. It provides clear visibility into the state of your cluster(s) on every level.
These instructions assume that you are using Elasticsearch version 2.0+; for earlier versions, please consult the correct installation instructions here.
First, install the plugin in your elasticsearch/bin directory:
./plugin install license
./plugin install marvel-agent
You also need to download Kibana, Elastic’s visualization and analytics platform, if you haven’t already. Install Marvel into your kibana/bin directory and then fire it up:
./kibana plugin --install elasticsearch/marvel/latest
./kibana
Last but not least, start up Elasticsearch:
./elasticsearch
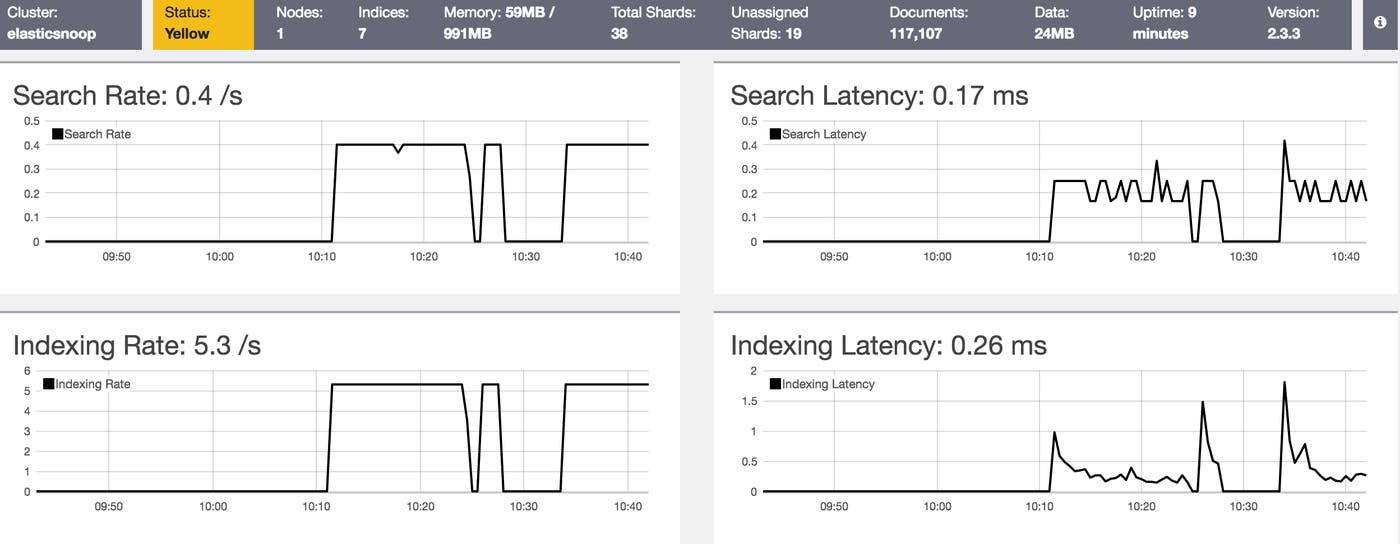
Marvel should now be accessible at http://localhost:5601/app/marvel. When you open it up, you’ll see a dashboard of graphs that display search rate, search latency, indexing rate, and indexing latency across your entire cluster. You can also get an idea of how these metrics have changed over different intervals, ranging from the last 15 minutes to the last 5 years.
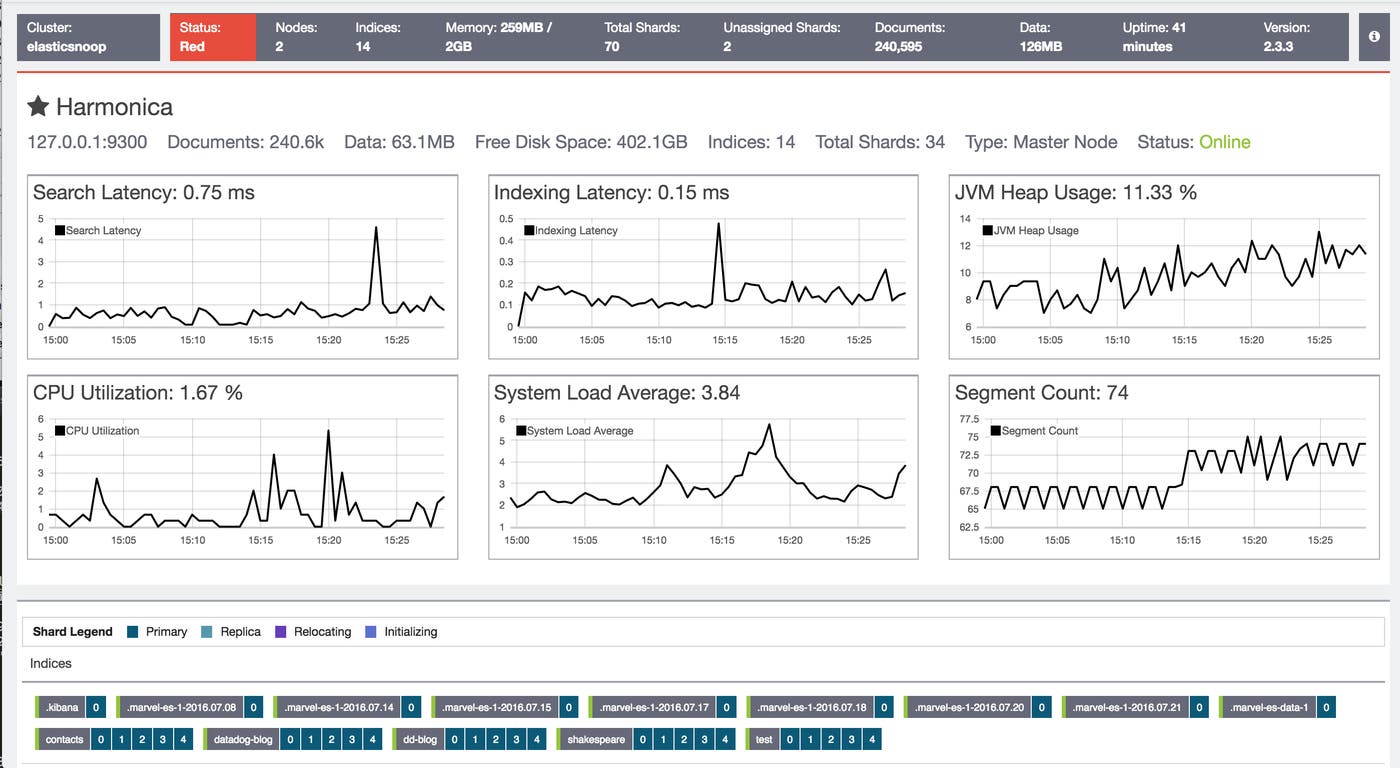
Marvel also graphs node-specific metrics like search latency, indexing latency, JVM heap usage, CPU utilization, system load average, and segment count.
As you’ve seen, there are several good options for viewing Elasticsearch metrics in isolation. To monitor Elasticsearch health and performance in context with metrics and events from the rest of your infrastructure, you need a more comprehensive monitoring system.
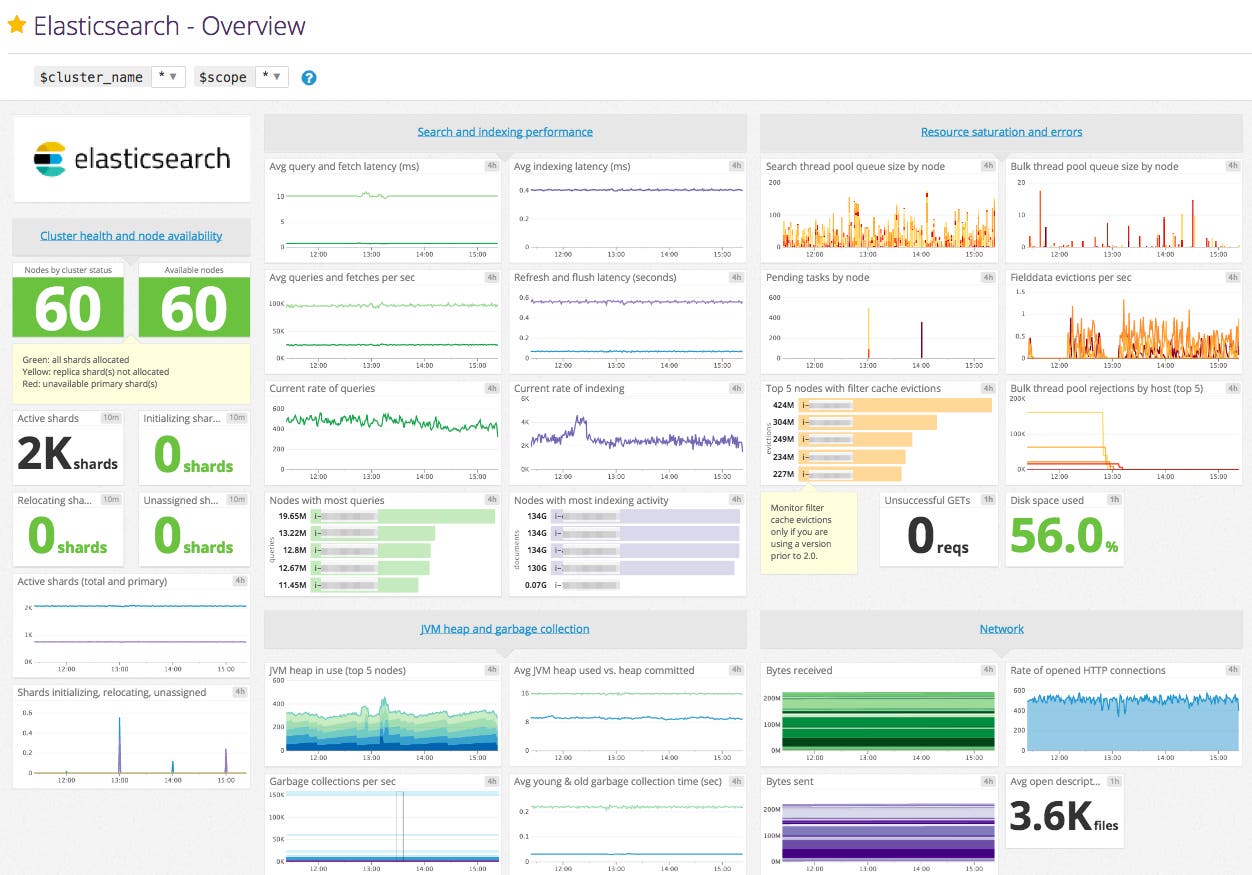
Datadog’s Elasticsearch integration enables you to collect and graph all of the metrics mentioned in Part 1. You can monitor and correlate them with detailed system-level metrics from your nodes as well as metrics and events from other components of your stack. For example, if you’re using NGINX as a proxy with Elasticsearch, you can easily graph NGINX metrics for requests and connections alongside key metrics from your Elasticsearch cluster.
Datadog’s support for aggregation and filtering by tags makes it easy to compare metrics from Elasticsearch’s different node types, such as data nodes and master nodes. You can also set up targeted alerts to find out when your cluster needs attention—for instance, when you’re running out of disk space on a data node.
The next part of this series describes how to monitor Elasticsearch with Datadog, and shows you how to set up the integration in your own environment. Or you can start monitoring Elasticsearch right away with a free trial.
此内容由惯性聚合(RSS阅读器)自动聚合整理,仅供阅读参考。 原文来自 — 版权归原作者所有。