


Apache HTTP Server is one of the most popular web servers in use today for engineering teams, and its prevalence naturally makes it a frequent target for attackers. In May 2026, the Apache Software Foundation patched CVE-2026-23918, a high-severity double-free vulnerability in Apache 2.4.66’s mod_http2 module. For teams not using Apache’s MPM prefork, the vulnerability would enable an attacker to crash worker processes or achieve remote code execution (RCE) in some specific cases. CVE-2026-23918 is an example of an HTTP/2 vulnerability that centers on RST_STREAM, the frame a client sends to cancel an in-flight stream. Earlier examples include CVE-2023-44487, a denial-of-service (DoS) exploit that affected most HTTP/2 implementations, and CVE-2023-45802, an Apache-specific memory issue where the mod_http2 module failed to release memory after a stream reset.
These vulnerabilities exploit RST_STREAM in ways that Apache’s default logging wasn’t designed to catch. Since HTTP/1.1 managed one request per connection, monitoring activity at the transport layer wasn’t necessary. TCP handled the life cycle of a connection, and access logs were sufficient to capture malicious activity. HTTP/2’s architecture introduced the ability to carry multiple requests simultaneously as streams within a single TCP connection, so detecting exploits that target the stream life cycle requires a different approach to logging than most Apache operators needed before.
This post will cover how to configure logs to capture HTTP/2 abuse in Apache web servers, what exploitation attempts look like in those logs, and how to monitor that activity with Datadog.
With HTTP/1.1’s model for handling requests, access logs can reliably capture the full picture of server activity by design. For example, a brute-force login attempt can produce repeated POST requests to the same endpoint, and each attempt is logged separately. HTTP/2 requires servers to manage stream phases across multiple concurrent requests within a single connection, which creates a broader attack surface than HTTP/1.1. An attacker can open and reset streams on the same connection repeatedly without ever completing a request, cycling through streams in rapid succession. The initial TCP connection may appear once in your access logs, but everything that happens at the stream level is invisible without debug logging.
To surface stream-level activity in your error logs, set LogLevel http2:debug in your Apache configuration and reload your server. The LogLevel option raises only the mod_http2 module to the debug level, which surfaces stream life cycle events like resets. Debug logs capture every protocol event per stream, which makes them valuable for forensics but too verbose and costly to leave on continuously.
If you’re running Apache 2.4.66 with mod_http2 enabled, consider enabling debug logging on vulnerable servers during that window of elevated risk while you apply and test any patches. More generally, you can enable debug logging when you have specific reason to suspect HTTP/2 abuse, and disable it once you’ve captured the information you need for your investigation.
Since HTTP/2 attacks work by forcing inefficient resource usage on the server, the initial signs often show up as degraded performance. For example, you may see latency spikes on typically healthy HTTP/2-enabled servers or a high number of busy workers without a proportional request rate. You may also see a sudden stream of server errors because workers can’t keep up with demand.
Each of these symptoms can point to HTTP/2 stream abuse, and debug logs give you the stream-level visibility to confirm it. If you notice performance degradation on a host where debugging is already enabled, you can look for two primary patterns in your logs: a high rate of stream resets from a single source, and segmentation fault (segfault) errors immediately following reset activity on the same stream.
The first pattern looks like a burst of streams opened and immediately reset from the same IP address. It can also look like one or more long-lived connections, each with a high reset count and a low completion rate. The attack is effective because it requires very little bandwidth from the client while forcing the server to repeatedly allocate and free resources for streams that never complete. That asymmetric workload surfaced in the 2023 Rapid Reset attacks against Cloudflare, where attackers replicated it across thousands of botnet-controlled clients and produced request rates of over 200 million per second.
The RST_STREAM pattern maps to both CVE-2023-44487 and CVE-2023-45802 and looks like a high volume of the following log output:
[Thu May 07 16:17:48.694281 2026] [http2:debug] [pid 10:tid 104] h2_session.c(414): [client 172.18.0.4:44092] AH03067: h2_stream(10-0-7): RST_STREAM by client, error=0
The h2_stream(10-0-7) line is the stream identifier and includes the connection for the HTTP/2 session, the server ID, and the stream ID within that session. A sequence of rapidly incrementing streams IDs from the same connection is consistent with an attacker quickly opening and resetting streams.
These particular logs also include error=0, which is the standard NO_ERROR code for resetting a stream without a specific error condition. In legitimate traffic, it appears when a client cancels a request it no longer needs, but attackers exploit it in this scenario because it doesn’t trigger server-side error handling that might throttle the connection.
The second pattern looks like a sequence of HEADERS and RST_STREAM frames on the same stream, which is what triggers CVE-2026-23918. The HEADERS frame opens a new stream and carries the request, while the RST_STREAM frame that immediately follows cancels it. If an RST_STREAM frame carrying a non-zero error code arrives before the multiplexer finishes registering it, the server triggers a double-free. The result is a corrupted memory state that crashes the worker process, which security researchers found can give attackers a path to remote code execution.
Unlike the Rapid Reset scenario, the attacks that use HEADERS and RST_STREAM sequences don’t depend on generating a high volume of logs. A single HEADERS and RST_STREAM pair on one TCP connection is enough to trigger the crash on a vulnerable server. When a worker crashes from the race condition, Apache logs a segmentation fault under error code AH00052, as seen in the following log output:
[Fri May 15 18:30:39.150466 2026] [core:notice] [pid 10:tid 104] AH00052: child pid 429 exit signal Segmentation fault (11)
Apache’s core module logs segfaults, which means they show up in your standard error logs without debug logging enabled. Seeing AH00052 in your error logs warrants enabling debug logging to investigate further.
If the crash recurs, you can look for the HEADERS and RST_STREAM sequence immediately preceding the AH00052 error on the same stream, as seen in the following log output:
[Thu May 07 16:17:48.693252 2026] [http2:debug] [pid 10:tid 104] h2_stream.c(609): [client 172.18.0.4:44092] AH03082: h2_stream(10-0-3,IDLE): created
[Thu May 07 16:17:48.693408 2026] [http2:debug] [pid 10:tid 104] h2_session.c(360): [client 172.18.0.4:44092] AH10302: h2_stream(10-0-3,IDLE): recv FRAME[HEADERS[length=5, hend=1, stream=3, eos=0]], frames=4/3 (r/s)
[Thu May 07 16:17:48.693511 2026] [http2:debug] [pid 10:tid 104] h2_session.c(360): [client 172.18.0.4:44092] AH10302: h2_stream(10-0-3,OPEN): recv FRAME[RST_STREAM[length=4, flags=0, stream=3,error=8]], frames=5/3 (r/s)
[Thu May 07 16:17:48.693599 2026] [http2:debug] [pid 10:tid 104] h2_session.c(414): [client 172.18.0.4:44092] AH03067: h2_stream(10-0-3): RST_STREAM by client, error=8
[Thu May 07 16:17:48.693676 2026] [http2:debug] [pid 10:tid 104] h2_mplx.c(1184): [client 172.18.0.4:44092] h2_stream(10-0-3,CLOSED): very early RST, drop
[Thu May 07 16:17:48.693777 2026] [http2:debug] [pid 10:tid 104] h2_session.c(1443): [client 172.18.0.4:44092] AH03078: h2_session(10-0,IDLE,0): transit [IDLE] -- input read --> [BUSY]
[Fri May 15 18:30:39.150466 2026] [core:notice] [pid 10:tid 104] AH00052: child pid 429 exit signal Segmentation fault (11)
The h2_mplx.c: very early RST, drop line is worth noting because it indicates that the reset activity arrived before the multiplexer finished queuing the stream for processing. This scenario doesn’t occur in typical traffic patterns. When you see this line immediately following HEADERS and RST_STREAM frames on the same stream, it indicates that the requester triggered the timing window for the double-free race condition.
Datadog provides a built-in Apache integration, which gives you valuable insights into server performance and activity before you even start investigating logs. For example, you can track request processing time or the number of busy workers to identify the initial signs of HTTP/2 abuse.
To take advantage of the specific error logs that capture HTTP/2 exploits, you will need to create a custom log parser, as seen in the following screenshot:
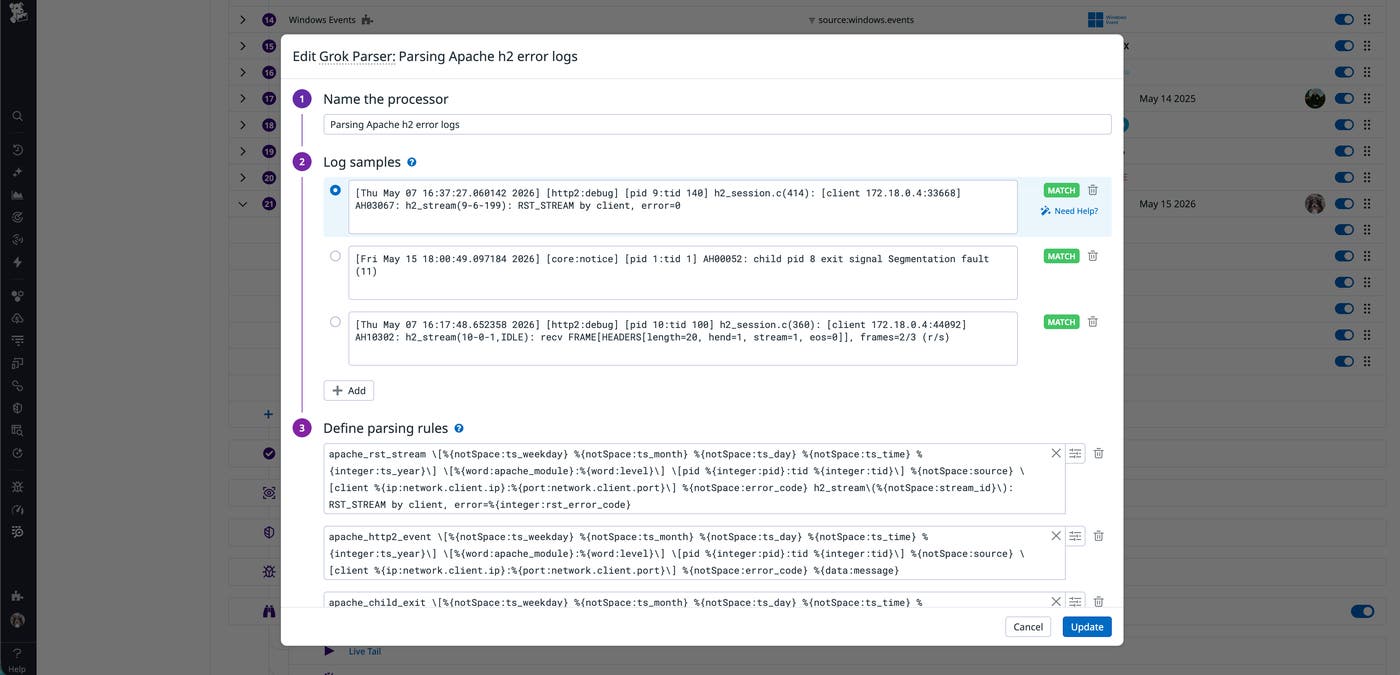
You can add the following rules in your Grok Parser to parse the HEADERS, RST_STREAM, and segmentation error logs:
apache_rst_stream \[%{notSpace:ts_weekday} %{notSpace:ts_month} %{notSpace:ts_day} %{notSpace:ts_time} %{integer:ts_year}\] \[%{word:apache_module}:%{word:level}\] \[pid %{integer:pid}:tid %{integer:tid}\] %{notSpace:source} \[client %{ip:network.client.ip}:%{port:network.client.port}\] %{notSpace:error_code} h2_stream\(%{notSpace:stream_id}\): RST_STREAM by client, error=%{integer:rst_error_code}
apache_http2_event \[%{notSpace:ts_weekday} %{notSpace:ts_month} %{notSpace:ts_day} %{notSpace:ts_time} %{integer:ts_year}\] \[%{word:apache_module}:%{word:level}\] \[pid %{integer:pid}:tid %{integer:tid}\] %{notSpace:source} \[client %{ip:network.client.ip}:%{port:network.client.port}\] %{notSpace:error_code} %{data:message}
apache_child_exit \[%{notSpace:ts_weekday} %{notSpace:ts_month} %{notSpace:ts_day} %{notSpace:ts_time} %{integer:ts_year}\] \[%{word:apache_module}:%{word:level}\] \[pid %{integer:pid}:tid %{integer:tid}\] %{notSpace:error_code} child pid %{integer:child_pid} exit signal %{data:exit_signal}
These parsing rules extract key fields from the logs, including:
Timestamp
Log level and Apache module
Apache error code
Client IP and port for the HEADERS and RST_STREAM logs
RST_STREAM error code
The Apache and RST_STREAM error codes in particular are worth extracting because they indicate the vulnerability associated with the log activity. Apache error codes tell you which event the server is reporting, such as an AH00052 error for a worker process crashing. The RST_STREAM error code points to the specific exploit in progress. For example, the Rapid Reset pattern (CVE-2023-44487 and CVE-2023-45802) will trigger logs with error=0 (NO_ERROR). The double-free vulnerability (CVE-2026-23918) triggers non-zero values, such as error=8 for CANCEL events.
You can use these fields to filter by in Log Management and create new detection rules for Cloud SIEM. We’ll look at creating two rules to help you monitor for high-volume reset activity and worker process crashes.
For scenarios such as the 2023 Rapid Reset attack (CVE-2023-44487) and the related mod_http2 memory issue (CVE-2023-45802), you can create a detection rule that monitors for a high rate of NO_ERROR log entries within a short window of time. The rule relies on your debug logs, so it should be used as a forensic tool that you would review when you already suspect abuse.
To catch high-volume stream resets with Datadog Cloud SIEM, you can create a detection rule with the following configuration:
Name: Apache HTTP/2: High-volume RST_STREAM activity from single source (CVE-2023-44487, CVE-2023-45802)
Query: source:apache @apache_module:http2 @rst_error_code:0
Group by: @network.client.ip
Time window: 1 minute
Threshold: more than X events per group
The query filters to logs with a NO_ERROR code and groups them by IP address, and the 1-minute window is used to catch bursts of traffic. The threshold should be based on your servers’ typical traffic patterns. Legitimate HTTP/2 requests generate several debug log entries each—a HEADERS frame for the request and HEADERS and DATA frames for the response at minimum—so setting the threshold too low could cause the rule to trigger on day-to-day traffic.
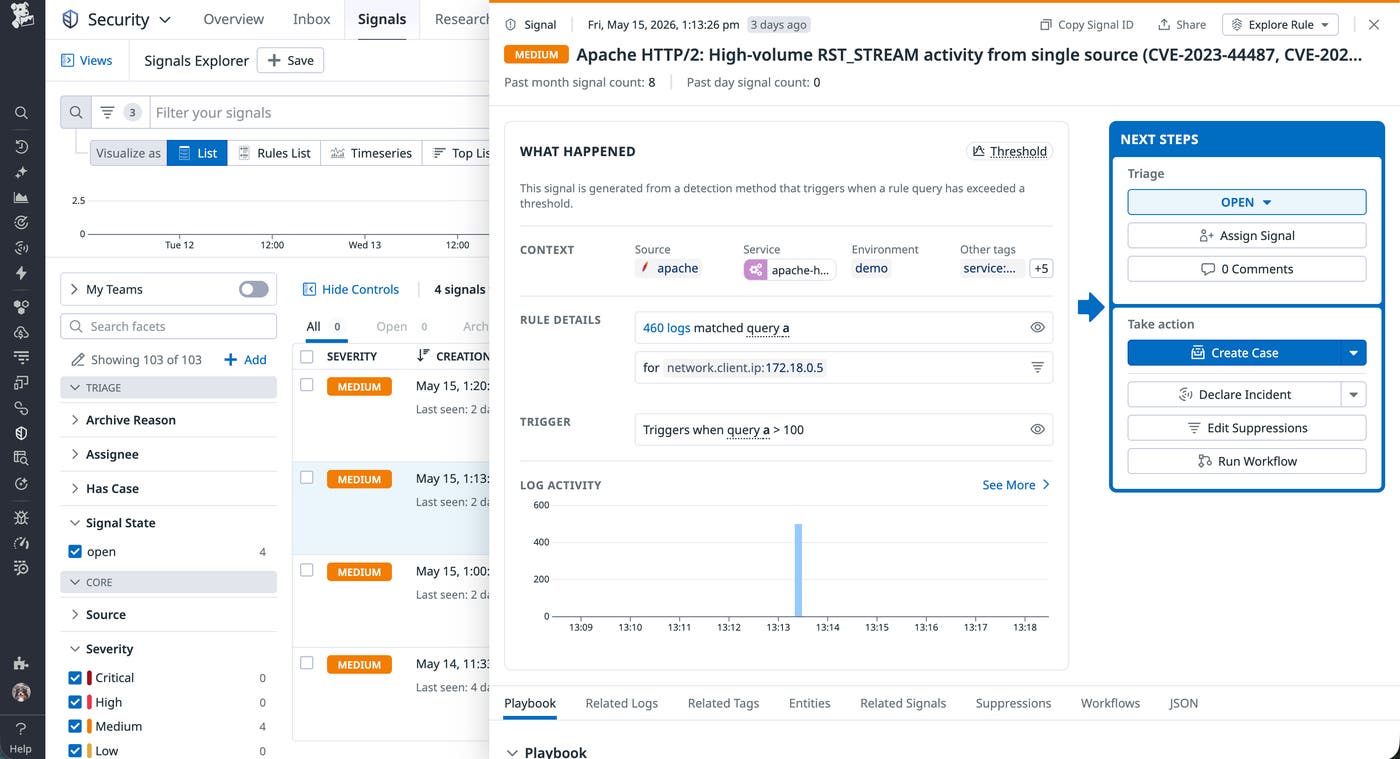
If the detection rule triggers a signal, you can review it to determine if you need to block the source IPs at the load balancer or web application firewall (WAF) level.
A single HEADERS and RST_STREAM pair on one TCP connection is enough to trigger the double-free race condition and crash the worker, in which Apache will log an AH00052 error.
To catch worker crashes with Datadog Cloud SIEM, create a detection rule with the following configuration:
Name: Apache HTTP/2: Worker process segfault (CVE-2026-23918)
Query: source:apache @apache_module:core @error_code:AH00052
Group by: @host
Threshold: at least 3 event per group
The rule relies on Apache’s core module, so it can be used even if you don’t have debug logging enabled. The query filters to AH00052 logs and groups them by host. The threshold of 3 events is intentionally low because unexpected worker crashes on a typically stable HTTP/2-enabled server are worth investigating for CVE-2026-23918.
When the rule generates a signal, you can pivot to view the affected Apache host’s logs in Datadog Log Management, grouping fields by the client IP:
host:affected-host @apache_module:http2 @rst_error_code:>0
If the query returns one or more events with non-zero RST_STREAM error codes from a single client IP, it’s likely a sign that your servers are exposed to the CVE-2026-23918 vulnerability. To respond, block the source IP and confirm if affected hosts are running Apache 2.4.66 with mod_http2 enabled. If so, then you should apply the 2.4.67 patch or temporarily disable HTTP/2 on your servers while you prepare the update.
Detecting HTTP/2 abuse in Apache requires stream-level visibility that standard access logs don’t provide by default. Datadog Cloud SIEM uses debug logs to help you identify high-volume RST_STREAM activity and worker crashes in your Apache web servers before they escalate.
For a broader look at Apache web server performance, read our three-part monitoring guide covering key metrics and logs. To start monitoring Apache logs, you can sign up for a free 14-day trial.
此内容由惯性聚合(RSS阅读器)自动聚合整理,仅供阅读参考。 原文来自 — 版权归原作者所有。