








Incidents put systems and organizations to the test. They pose particular challenges at scale: in complex distributed environments overseen by many different teams, managing incidents requires extensive structure and planning. But incidents, by definition, break structures and foil plans. As a result, they demand carefully orchestrated yet highly flexible forms of response.
This post will provide a look into how we manage incidents at Datadog. We’ll cover our entire process, including:
Identifying incidents
Coordinating incident response
Postmortem analysis
Along the way, we’ll provide insights into the tools we’ve developed for handling incidents, such as Datadog Incident Management, On-Call, Teams, Software Catalog, and Workflow Automation—each of which plays an integral part in our own processes.
There are two core components to incident management at Datadog. One is our culture of resilience and blameless organizational accountability. These values are deeply rooted in our products and our sense of responsibility towards our customers, and we uphold them in part through regular incident training for all of our engineers, as well as through continual review of our incident management processes.
We’ll cover building resilience and maintaining transparency later in this post. We’ll start where incidents themselves start, which brings us to the other core component of incident management at Datadog: monitoring our own systems.
Datadog manages operations according to a “you build it, you own it” model. That means that every component of our systems is monitored via Datadog by the team that builds and manages it. Teams define service level objectives (SLOs), collect a wide range of telemetry data on their services, and configure monitors to alert them to potentially urgent events in that data around the clock. Many teams also rely on Datadog Real User Monitoring (RUM), Synthetic Monitoring, and Error Tracking to ensure fulfillment of their SLOs.
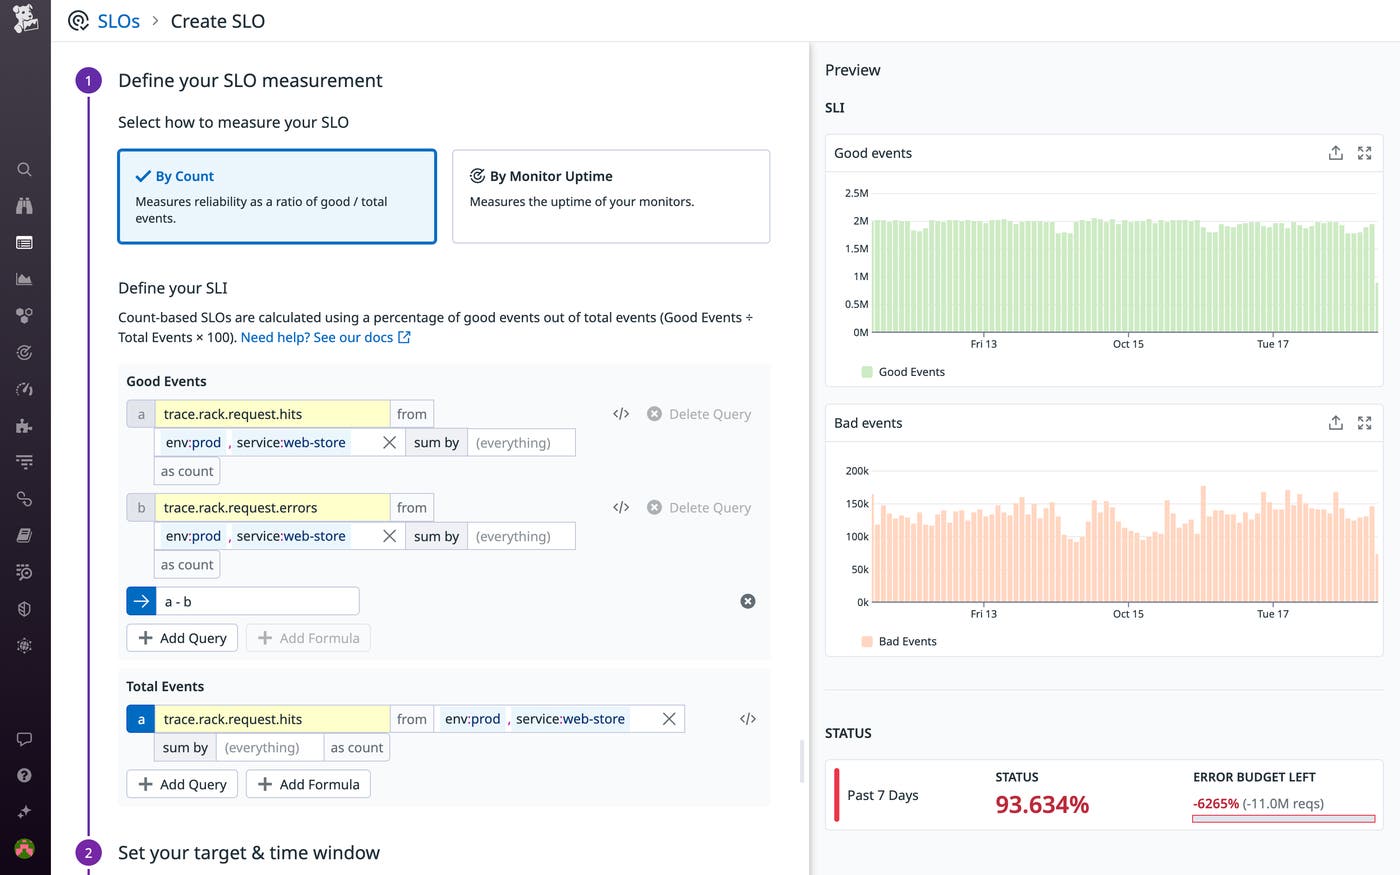
Datadog Teams and Software Catalog, which help centralize information about our services and simplify their collective management, are essential for clarifying ownership and enabling collaboration among our teams. All services used in our production environment must be registered in the Software Catalog; their ownership must be registered using Teams. We use automated checks to guarantee this, as well as to verify that key data on each team and service (Slack channels, URLs, etc.) is valid and up to date. All of this helps ensure that the overall picture of our production services and their ownership stays complete and current.
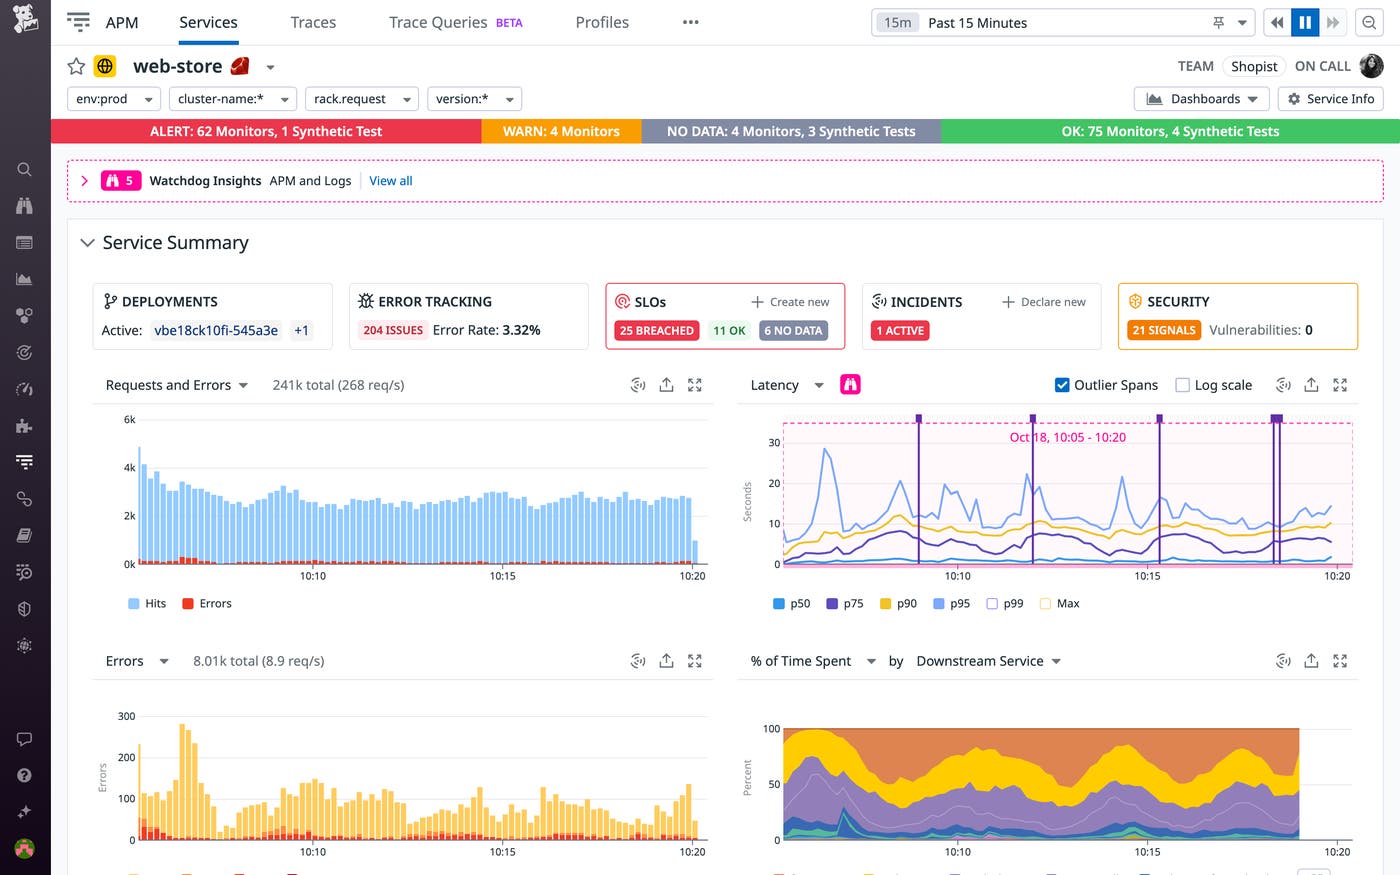
Because we monitor Datadog using Datadog, we also use some last-resort out-of-band monitoring tools in order to ensure that we are alerted in the exceptionally rare case of an incident that renders our platform broadly unavailable.
Once we’ve detected any potentially urgent issue—namely, anything that might impact our customers—we declare an incident. Our low threshold for declaring incidents means that we run through our incident management process frequently. This helps us refine our processes and keep our engineers up to date.
We use our own Incident Management tool to declare incidents, which you can do directly from many points within our UI, such as any monitor, dashboard, or Security Signal, as well as from our Slack integration.
Our Incident Management tool plays a vital role throughout every incident at Datadog. At the outset, it enables us to quickly assign a severity level based on initial triage, set up communications channels, and designate first-line responders. We use Datadog On-Call to page our responders and provide them with real-time context for alerts, as well as schedules and contact information for our on-call rotations. This helps us ensure that the right engineers are notified and provided with the relevant telemetry and points of contact as soon as possible.
Our goal in triage is to quickly gauge and communicate the scope of an incident’s impact. Precision is a secondary concern, especially during initial triage: above all, mitigating customer impact is always our top priority. The point is to rapidly convey urgency and put a proportional response in motion. When in doubt, we use the highest severity level that might potentially apply, and we regularly reassess impact and adjust incident severity levels (we train our incident commanders to do so at least once an hour during incidents with major customer impact).
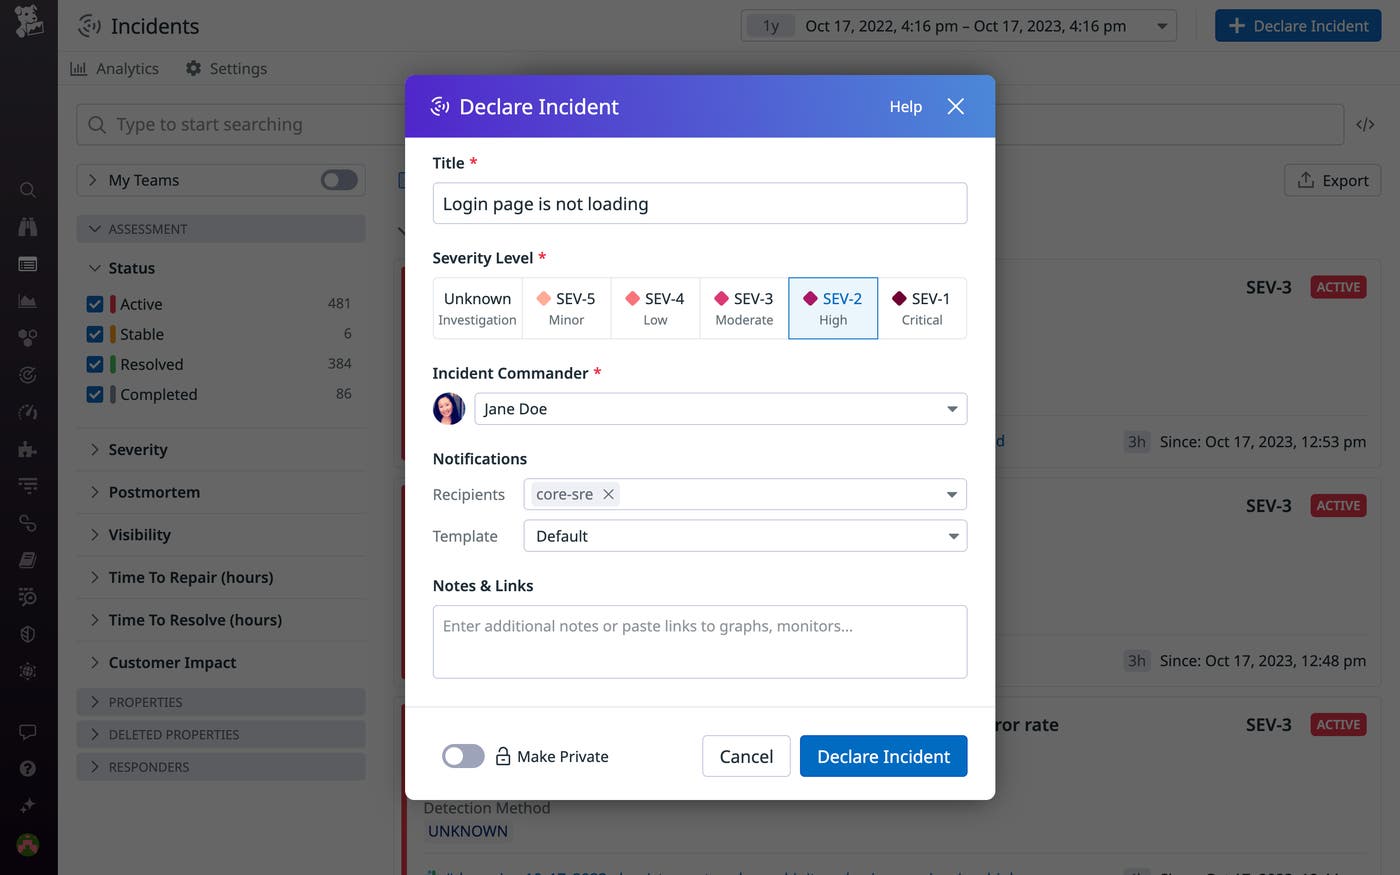
We use a five-level severity scale for incidents, with SEV-1 designating critical incidents affecting many users and SEV-5 designating a minor issue.
| Severity | External Factors | Internal Factors |
|---|---|---|
| SEV-1 | - Impacts a large number of customers or a broad feature - Warrants public and executive communications | - Threatens production stability or halts productivity - Blocks most teams |
| SEV-2 | - Major functionality unavailable | - Impacts most teams’ ability to work |
| SEV-3 | - Partial loss of functionality | - Blocks or delays many or most teams |
| SEV-4 | - Does not impact product usability but has the potential to | - Blocks or delays one or two teams |
| SEV-5 | - Cosmetic issue or minor bug - Planned operational tasks | - Planned operational work - Does not block any users |
Initial triage helps determine our response team for each incident. When a high-severity incident is declared, our Incident Management tool automatically pages members of our on-call rotation for major incident response. This around-the-clock rotation comprises senior engineers in multiple time zones who specialize in incident command. A member of this rotation will step into the incident command role in case of a severe incident, in which the customer impact is extensive, or one in which many different teams are involved, making coordination especially complex.
As a rule, we steer clear of ready-made recovery procedures, which are effectively impossible to maintain for dynamic, enterprise-scale systems such as our own. Instead, our incident management process is designed to help those who know our systems best guide remediation. We look to facilitate collaboration and enable responders to focus on containing customer impact, above all, as well as to investigate root causes (with the primary aim of preventing recurrence).
To coordinate our incident response, we rely on incident commanders to drive the decision-making and manage communications both internally—among responders and with executives—and with our customers. We also rely on a range of tooling, from our own On-Call tool to Slack, that helps us keep responders on the same page and paves the way for effective collaboration.
Incident commanders steer our incident response by setting clear priorities and determining an appropriate overall approach to the incident. This may entail gauging risks and weighing them against impact—for example, deciding whether or not to bypass normal rollout safety mechanisms in order to expedite remediation, given the perceived safety of the fix and the severity of the impact.
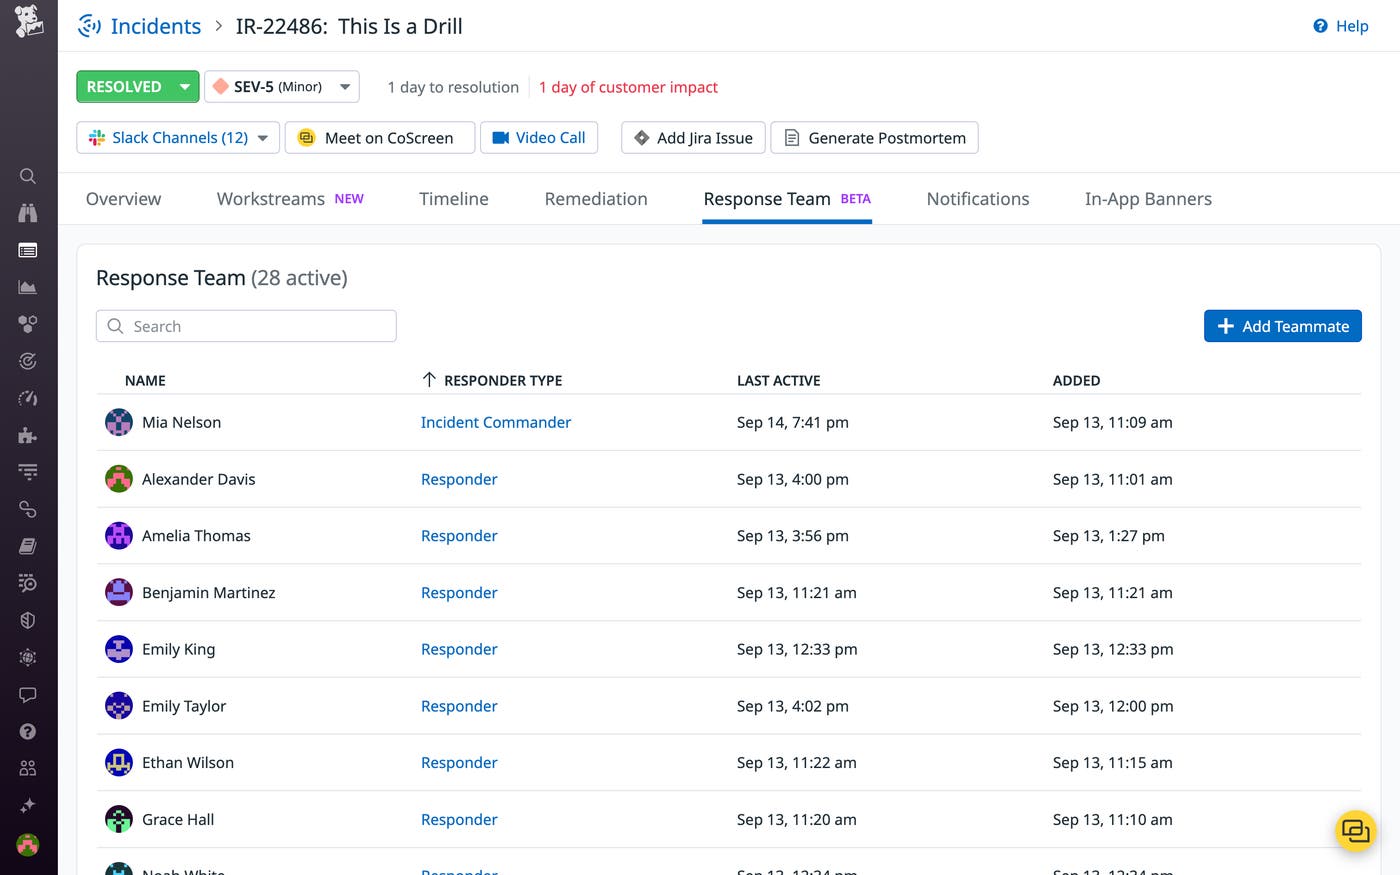
Steering incident response also means facilitating the work of responders. This means:
Assembling a response team. Incident commanders must determine and page the right people for the response.
Resolving technical debates. The perfect may be the enemy of the good during incident response. As guiding decision-makers, incident commanders help avoid prolonged debates and indecision, which can cost precious time.
Keeping stress levels down and preventing exhaustion. Incident commanders are in charge of keeping the incident response even-keeled and sustainable. They are responsible for coordinating shifts and breaks in order to ensure that responders stay alert and don’t get fatigued or overwhelmed.
Providing status reports. We’ll delve into how we maintain communications with diverse stakeholders later in this post.
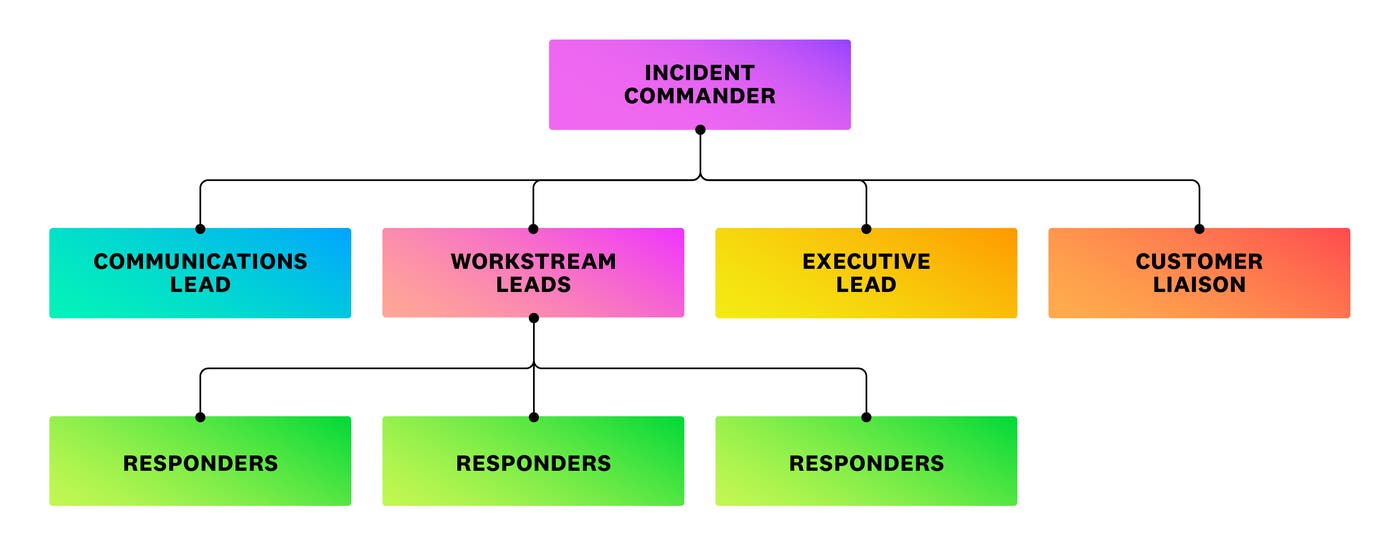
Incident commanders may also delegate various aspects of their work to auxiliary support roles, which can be integral to our response depending on the nature of the incident:
Workstream leads help coordinate our incident response when it involves many responders operating on multiple fronts.
Communications leads help manage internal communications and status updates.
Executive leads are engineering executives who work alongside customer liaisons, managers from our customer support team, to manage communications with customers.
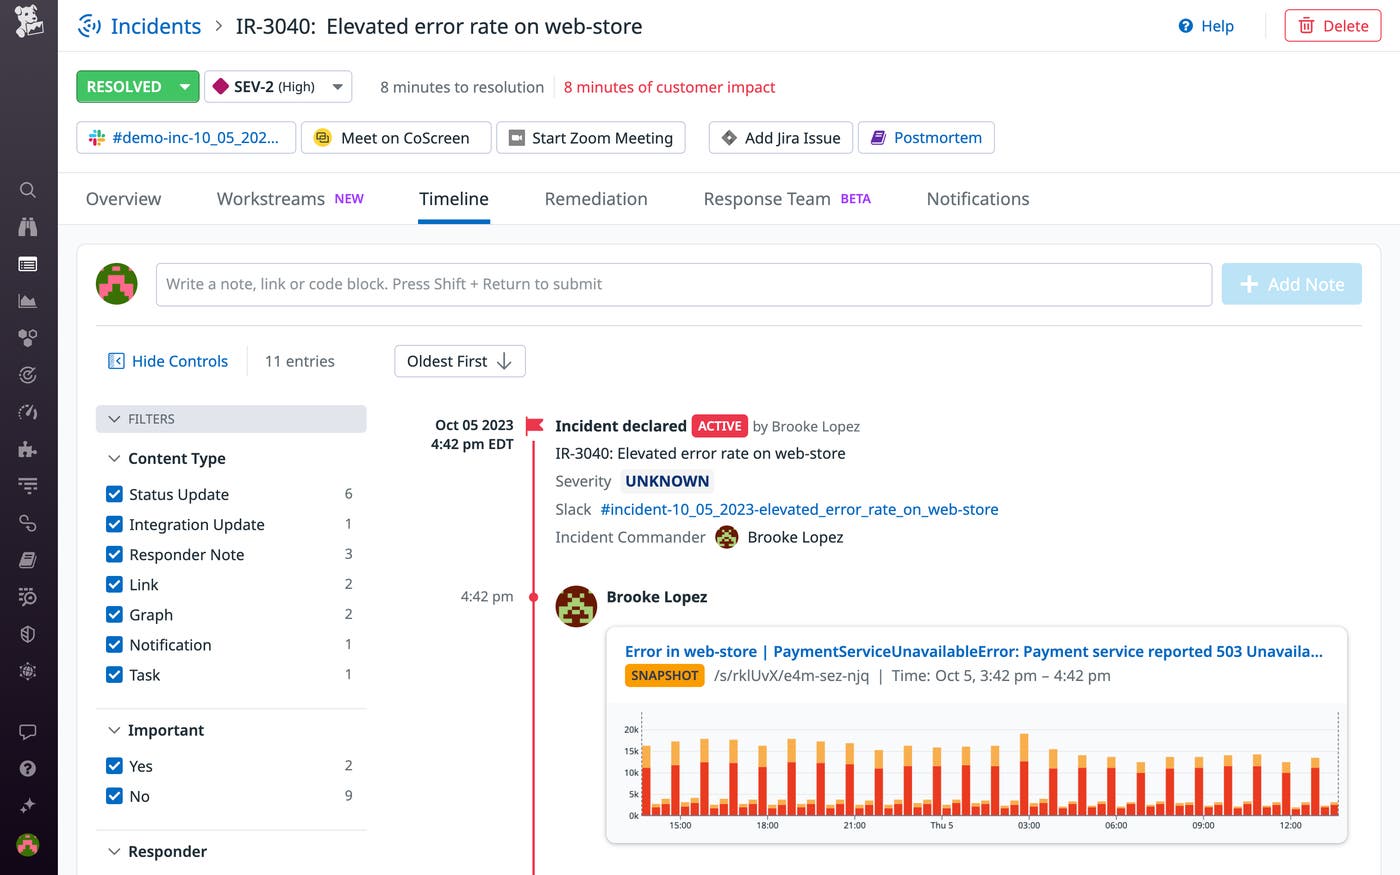
Once we declare an incident using our Incident Management tool, it automatically generates an incident timeline as well as a dedicated Slack channel. Incident timelines enable us to construct a chronology of key data pulled from across Datadog and our integrations, as well as the steps taken in our response. Each timeline automatically incorporates everything from changes in incident status to responders’ deliberation in dedicated Slack channels.
When we page our responders, we use the notification templates provided by our Incident Management tool to automatically direct them to the relevant incident Slack channels. These channels help us maintain a focused, concerted response, keeping all responders on the same page. Whenever a responder joins an incident channel, our Bits AI copilot automatically provides a summary of the incident and our response so far, helping them quickly get up to speed. Responders can also collaborate with Bits directly in Slack by asking follow-up questions to investigate affected services or pull relevant telemetry from Datadog dashboards—streamlining triage and analysis and minimizing the need for context-switching. And since messages from these channels are automatically mirrored to our incident timelines, they also help us build a clear picture of the response after the fact, during postmortem analysis.
Incident commanders use our Incident Management tool to define and delegate specific tasks for remediation and follow-up. When a task is created, this tool automatically notifies assignees.
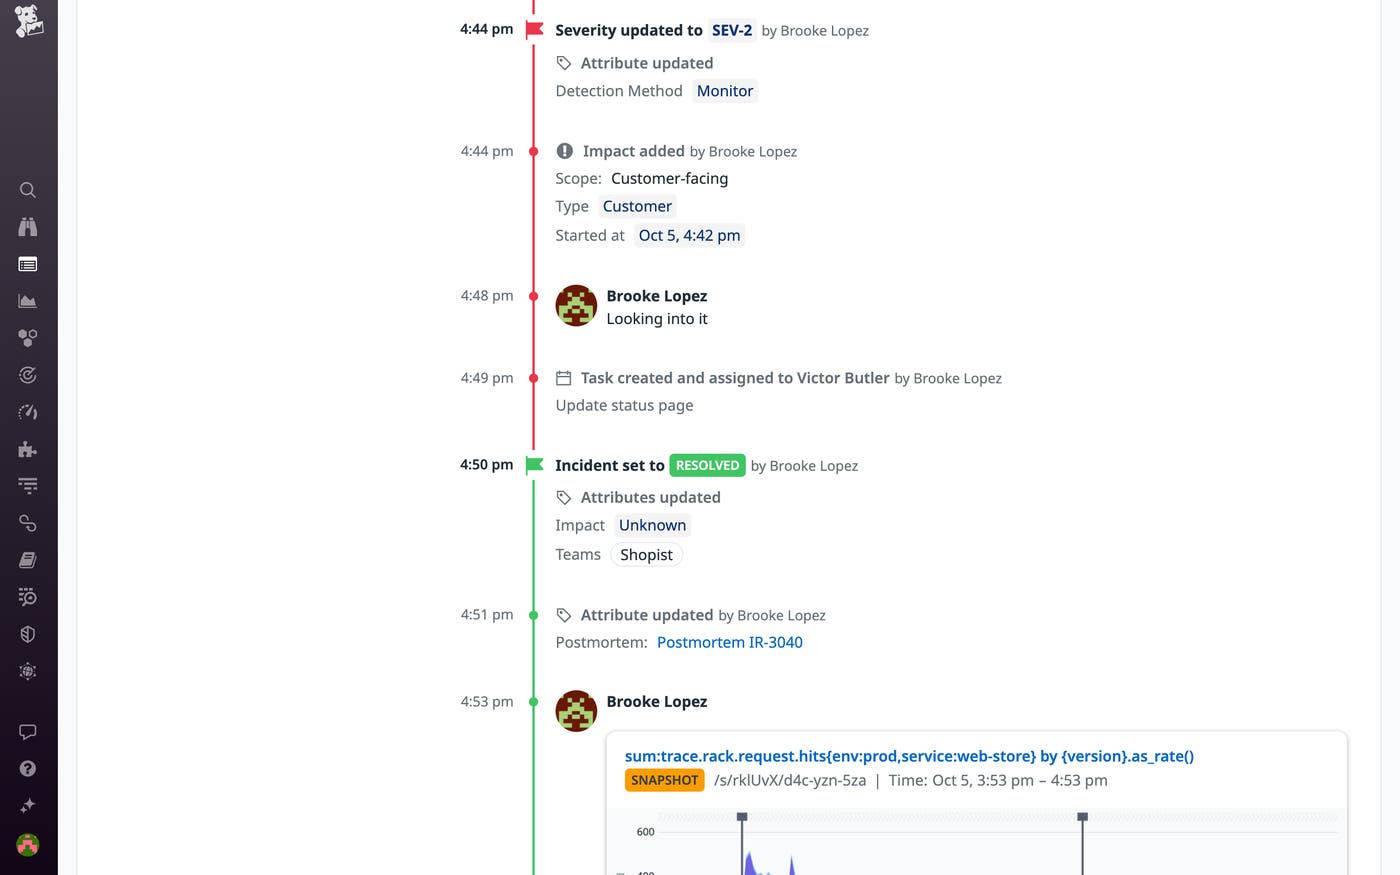
We also use our Workflow Automation tool to send regular reminders of tasks such as updating incident status pages and, later on, for completing follow-up items such as incident postmortems.
Especially severe and complex incidents may necessitate multiple paths of response by teams of responders. Under these circumstances, we rely on the Workstreams feature of Datadog Incident Management, which enables us to clearly define and delegate various facets of our response.
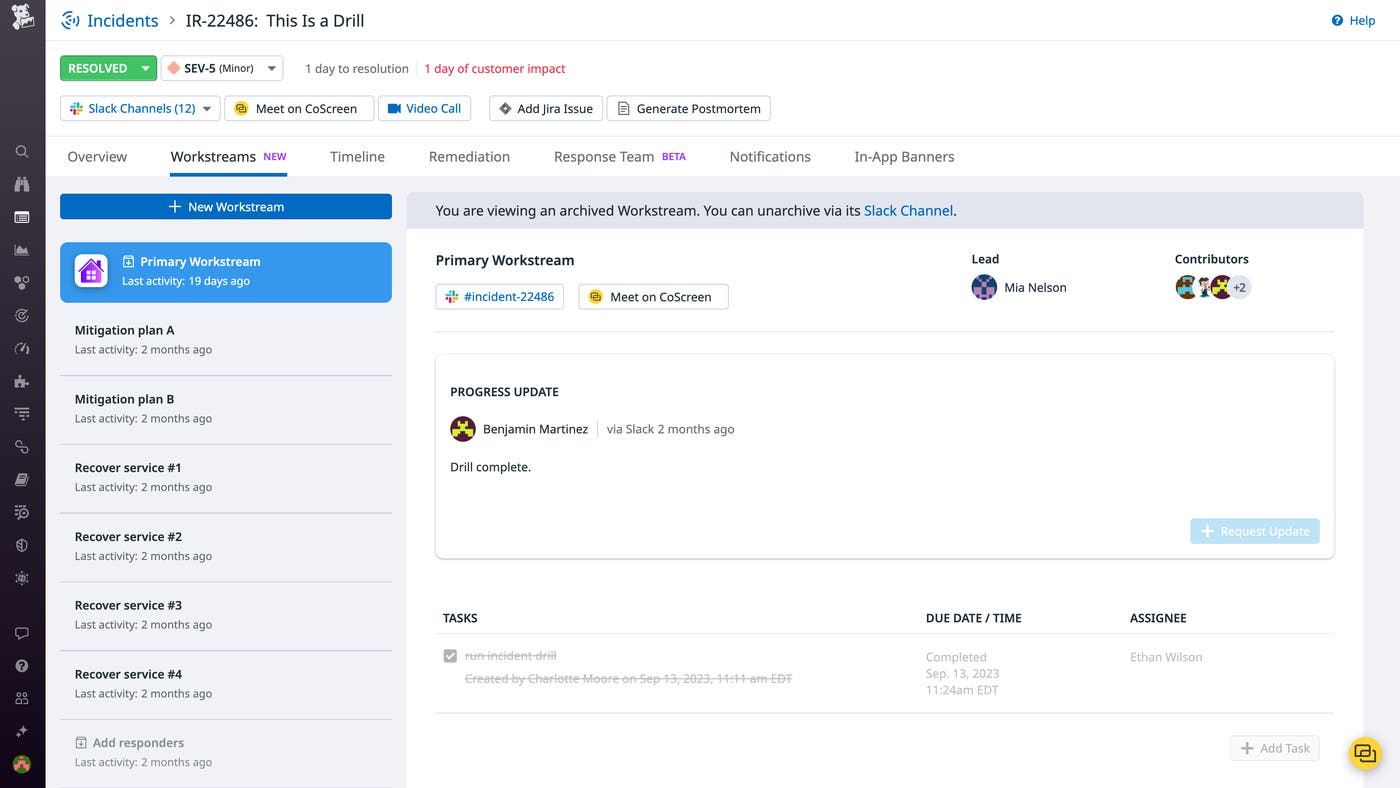
Incident Management Workstreams enable us to maintain an organized response while pursuing multiple avenues of mitigation—such as recovering separate services in cases where multiple services are compromised—and exploring different solutions in parallel, helping us contain impact faster.
Maintaining communication with customers and executives is essential during high-severity incidents. Incident commanders, executive engineering leads, and customer liaisons manage this communication in order to ensure that responders can focus on investigating incidents and containing their impact.
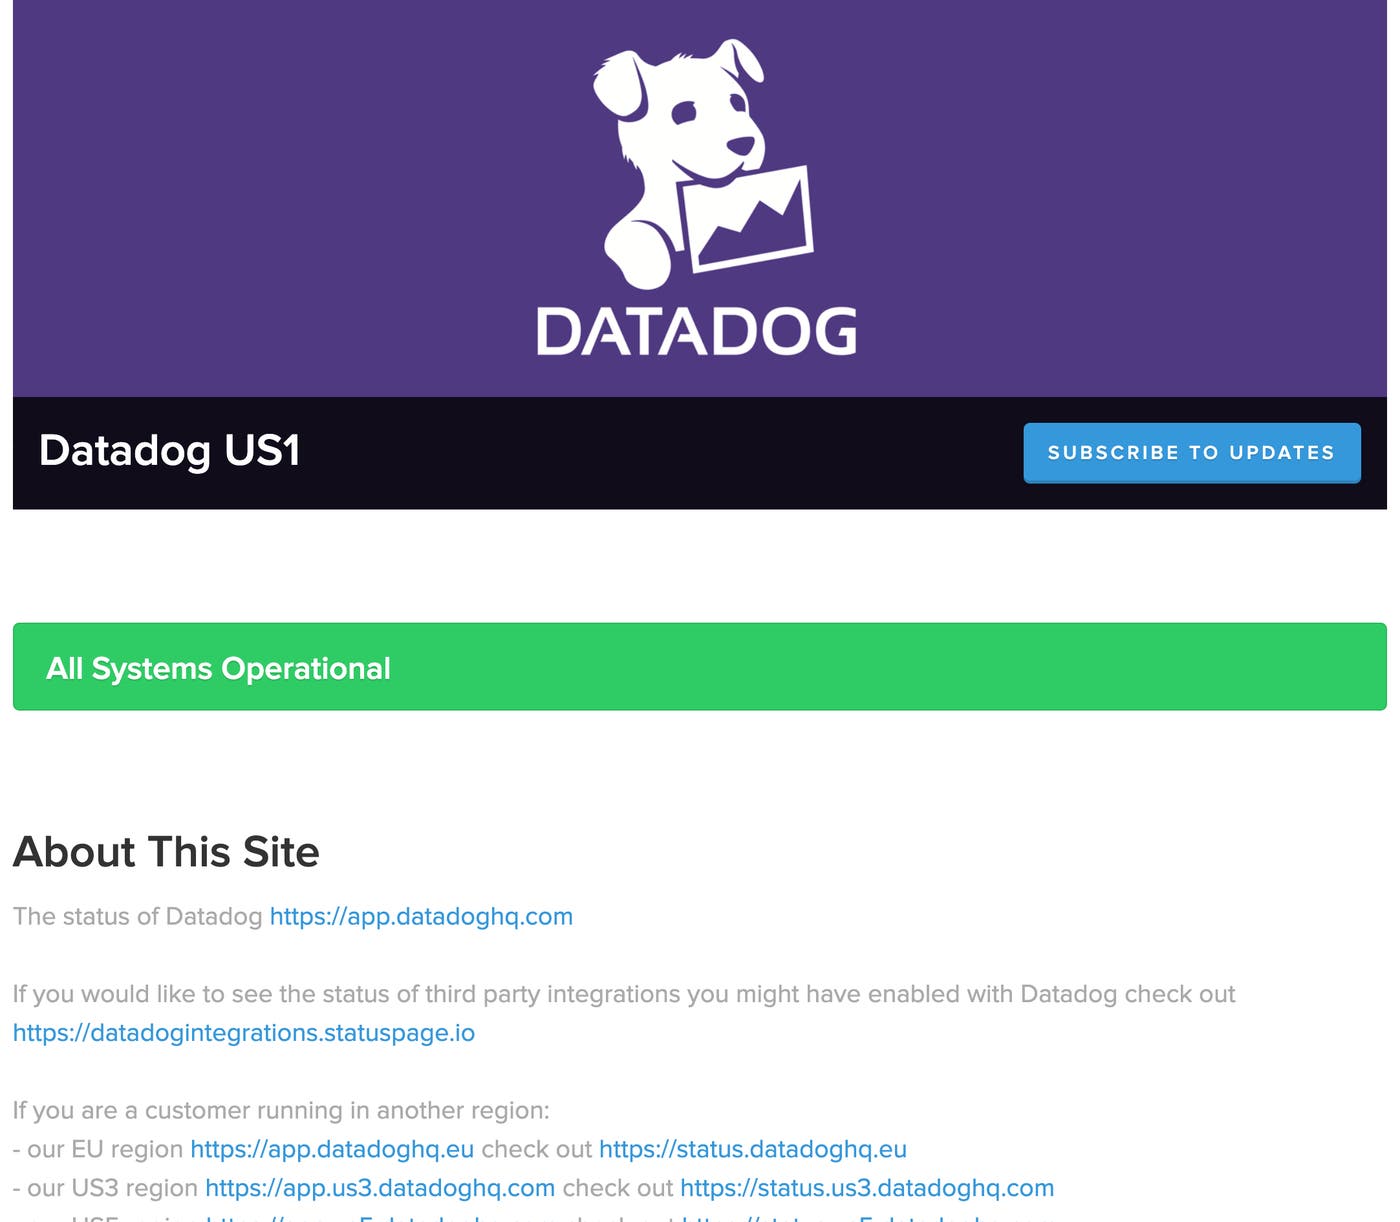
At Datadog, we are as transparent and proactively communicative as possible with our customers during and after incidents. As a rule, we notify customers of any incident affecting them without waiting for them to notify us. During major incidents, we provide them with regularly updated status pages.
Once an incident’s impact on customers is completely contained, we declare it stable by updating its status with our Incident Management tool or via our Slack integration.
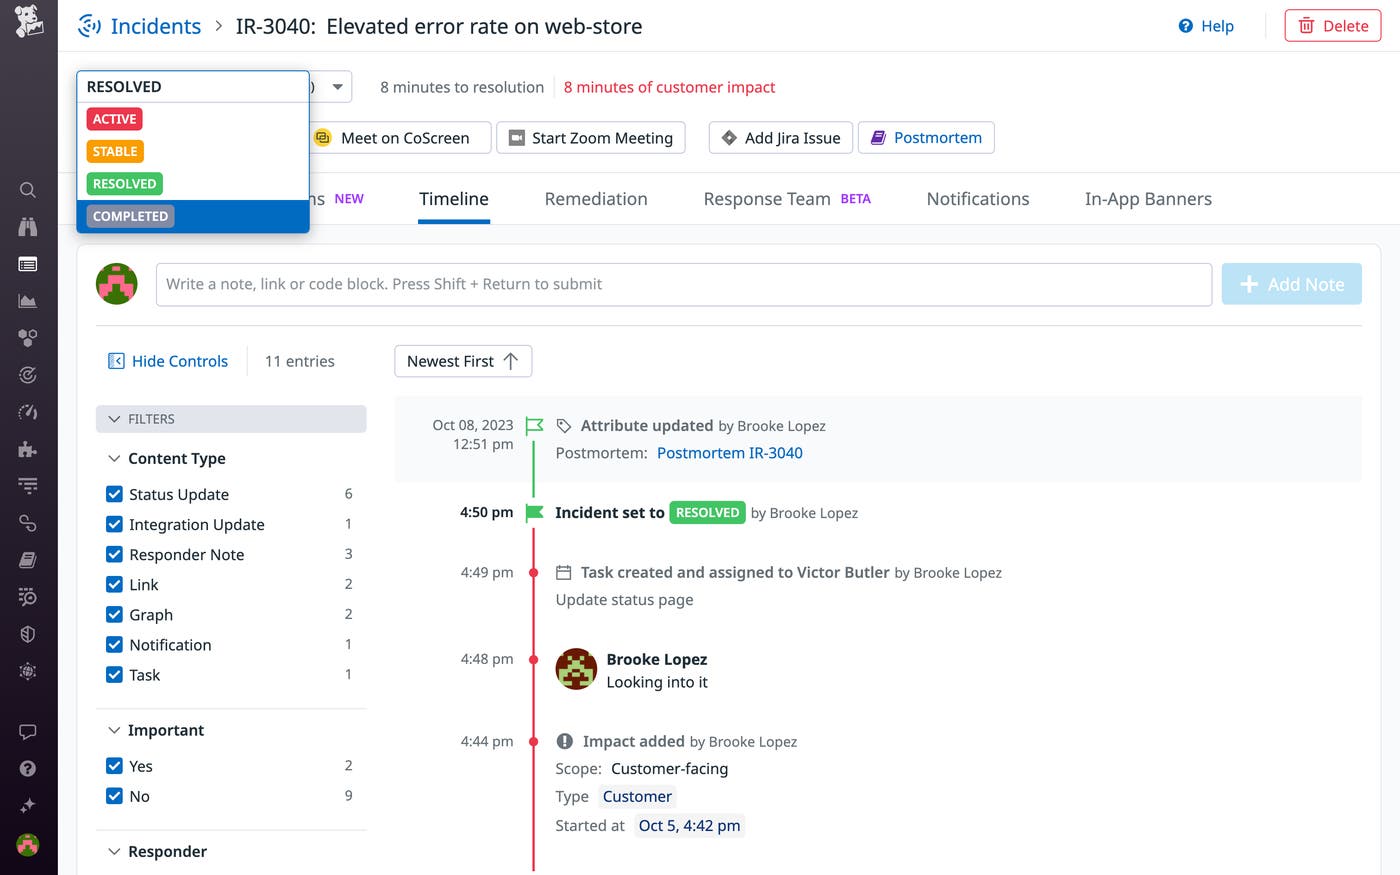
This marks the end of customer impact on the incident timeline and automatically posts notifications to the associated Slack channels. In cases of high-severity incidents, we then notify our customers that the impact has been contained and that they can expect more information soon.
Once the effects of an incident have been contained and its root causes are sufficiently well-understood to justify confidence that it will not immediately recur, we declare the incident resolved and our emergency response stands down.
We treat the resolution of every incident as an opportunity to take stock of and absorb its lessons through documentation and analysis. This is a moment to demonstrate our accountability to our customers, and often—in big ways or small—to update our engineering roadmap.
Our engineers use incident timelines and Datadog Notebooks, which allows you to incorporate real-time or historical graphs into Markdown documents, to write a detailed postmortem for every high-severity incident.
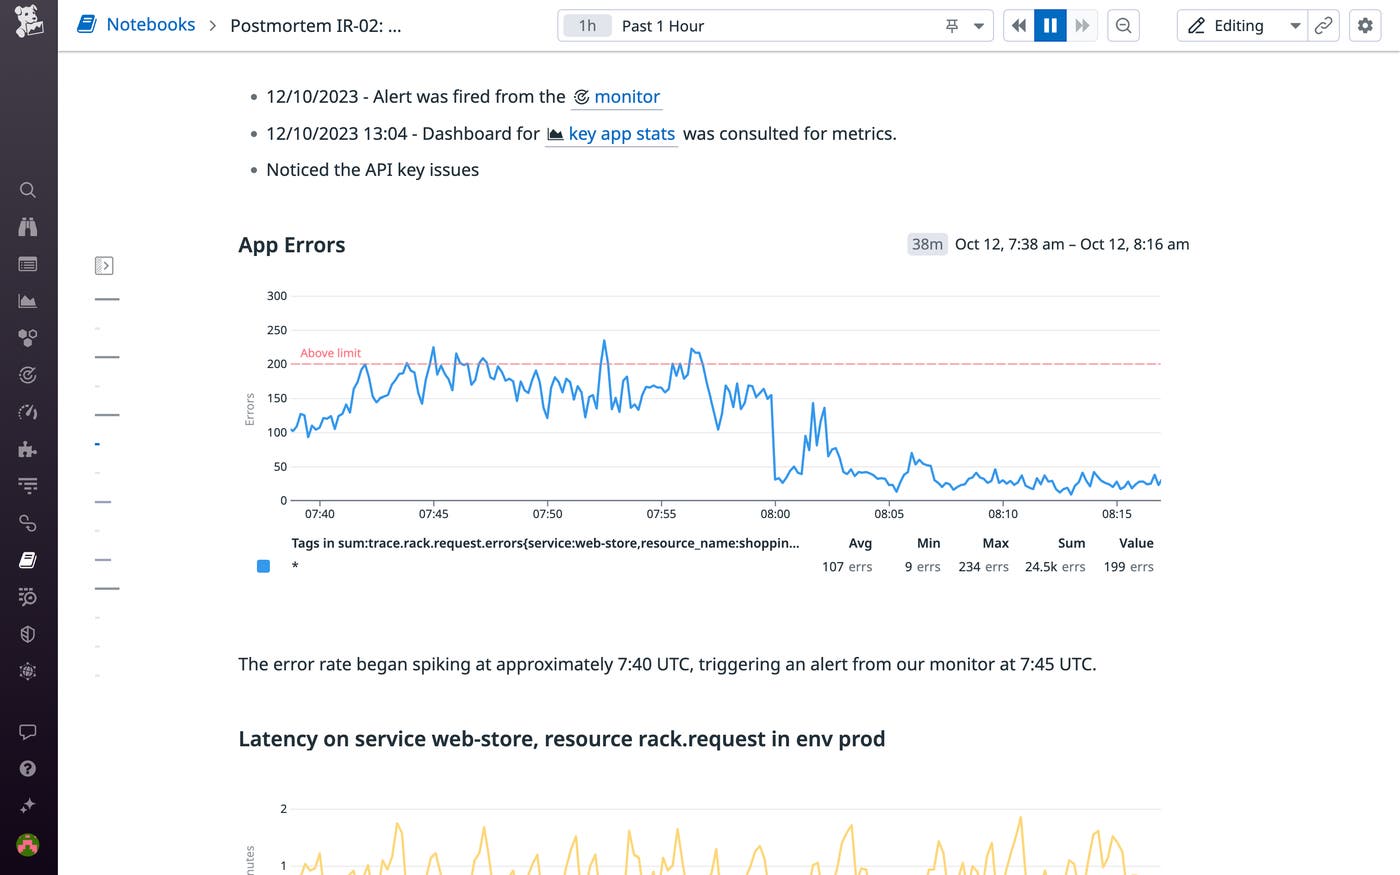
Postmortems are an important way to maintain transparency with our customers. They are equally important as internal tools, helping us understand how and why our systems have failed and correct our course as we move ahead.
We treat every incident as a systemic failure—never an individual one. Even if an incident is triggered by human error, we know that it has ultimately occurred because our systems could not prevent the issue in the first place. This philosophy is part of the bedrock of incident management at Datadog. In the short term, it helps our incident response: incidents are high-pressure situations, and eschewing personal blame helps to alleviate pressure on responders and encourage them to find creative solutions. In the long term, it helps us build resilience. Human error is inevitable, making blameless incident analysis the only true path to more reliable systems.
In order to maintain the culture of resilience that drives incident management at Datadog, we conduct incident trainings on an ongoing basis. All Datadog engineers are required to complete comprehensive training before going on call as responders, and follow up with refresher training sessions every six months.
The purpose of our incident training is not to impose rigidly prescriptive recovery procedures. As we covered earlier in this post, incidents are inherently unpredictable, and such procedures tend to be difficult or impossible to maintain at scale. Instead, our incident trainings have several overarching goals:
To empower those who know our systems intimately—component by component, service by service—to guide mitigation.
To establish standards of availability in order to ensure a timely response to every incident. On-call responders are expected to make sure that they have cell service and can get to a keyboard quickly, respond to alerts within minutes, and hand off their work to subsequent responders as needed.
To delineate steps and guidelines for declaring and triaging incidents, as well as for declaring stabilization and resolution.
To establish our protocol for incident command and other coordinating roles.
To emphasize our blameless incident culture.
To clarify our priorities in incident remediation, which we’ll discuss in more detail in the next section of this post.
We prioritize several metrics in order to clarify our priorities and gauge the success of our incident management. Mean time to repair (MTTR) is often cited as a gauge of successful incident response. But we find that prioritization of MTTR risks motivating the wrong behavior by encouraging quick fixes that may not address an incident’s underlying causes. What’s more, in most cases, the sample size of incidents is too small and the variability of incidents too great to make MTTR a meaningful value.
Here are the metrics we most value as indicators of successful incident management, and which we use to guide us in refining our process in the long term:
Low rates of recurrence. These testify to the effectiveness of past remediation efforts.
Increasing levels of incident complexity. These testify to the effectiveness of the cumulative safeguards developed in the course of managing previous incidents (consider the Swiss Cheese Model).
Decreased time to detection. This testifies to the effectiveness of our monitoring and alerting.
Low rate of spurious alerts. Together with decreased time to detection, this speaks to the quality of our monitoring and a lower potential for alert fatigue.
We also rely on qualitative surveys for incident responders, which help us gauge engineers’ confidence in handling incidents and guide our incident training.
Effective incident management hinges on in-depth, real-time awareness of systems, consistent communication, and creative adaptability. At Datadog, we seek to meet these criteria through effective monitoring, the cultivation of a healthy and proactive culture around incident management, and the development of purpose-built tools. Complex systems like our own are always evolving. Our incident management process helps us respond to unexpected turns in this evolution, and ensure that we are steering our systems towards greater reliability.
To manage incidents with Datadog, you can get started with Incident Management, Teams, Software Catalog, Notebooks, and any of the other tools discussed in this post today. If you’re new to Datadog, you can sign up for a 14-day free trial.
此内容由惯性聚合(RSS阅读器)自动聚合整理,仅供阅读参考。 原文来自 — 版权归原作者所有。