


Tags provide critical context for troubleshooting issues across any dimension of your environment. By applying best practices for tagging your systems, you can efficiently organize and analyze all your monitoring data, and set up automated multi alerts to streamline alerting workflows.
Similar to any tags you would add to your services and infrastructure, monitor tags—tags that you apply to your monitors—are an essential feature for organizing and simplifying your workflows. This blog post will highlight recommended best practices for tagging your monitors, and cover the many benefits of using monitor tags extensively to:
Easily filter monitors and events
Configure downtime for monitors
Build rich dashboards
Better organize your service-level objectives
Monitor tags add dimensions to your monitors, allowing you to filter, aggregate, and visualize them just like any other kind of monitoring data (i.e., metrics, logs, and traces) in Datadog. When used judiciously, monitor tags help you effectively organize your monitors and streamline the way you manage and utilize your monitors—which in turn makes it easier to troubleshoot issues.
If your organization has many teams—all using a wide array of monitors to track their services—monitor tags allow everyone to get essential context around every monitor, and immediately use that information to respond appropriately. Simply by looking at a monitor’s tags, anyone in your organization can immediately understand why that monitor exists, which team owns it, which service is involved, and gather other useful information at a glance.
When you create a monitor, you should think about how to tag it with information that describes how this monitor relates to your infrastructure, applications, teams, and other monitors. While there are many ways to use tags to organize your monitors, in general, we recommend:
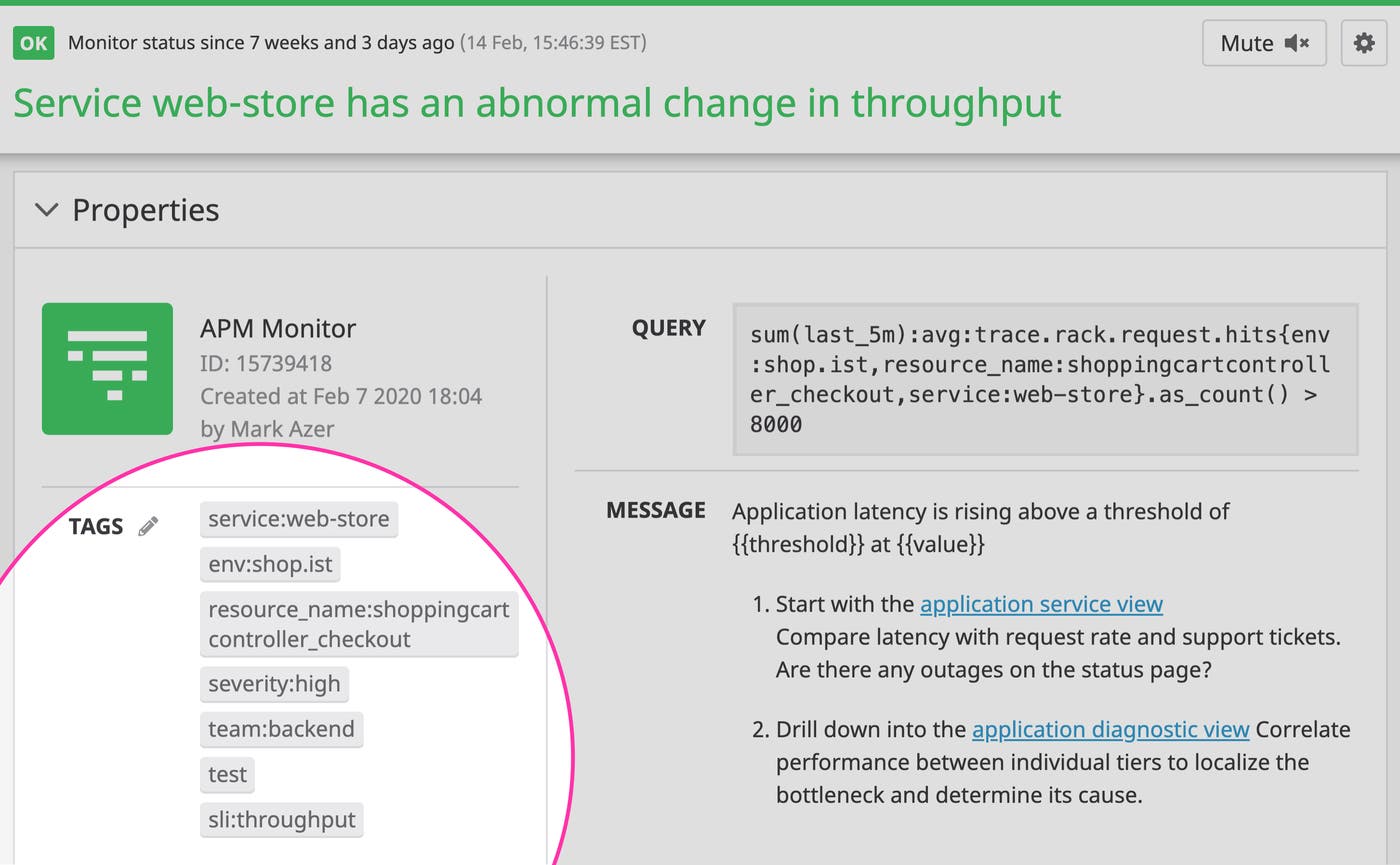
At a minimum, tagging each monitor with the relevant team, service, and environment, in key:value format.
Tagging your monitors by severity/priority, using your organization’s internal prioritization terminology or scores. This doesn’t just make it easier to filter out monitors by priority—it also helps you think about how important specific monitors are when you are creating them. This is also a critical consideration that can help you reduce alert fatigue caused by a large number of unnecessary monitors.
Tagging each APM monitor with the specific endpoint/resource it is alerting on.
If you intend to use a monitor as a Service Level Indicator (SLI) in a Service Level Objective (SLO), tag that monitor with the type of SLI that it represents (throughput, latency, availability, etc.).
In Datadog, you also have the option to tag monitors with values but no keys. In certain circumstances, keyless tags can be useful for describing something that is particularly unique about a specific monitor that doesn’t make sense to group with other values using a key. For example, if you are creating a monitor as a test, you could simply tag it with test. However, in general, we recommend using key:value tags wherever possible, because it can be difficult to organize and standardize tags that don’t have meaningful keys to help group them together.
Below is an example of an APM monitor tagged with all of the above suggestions.
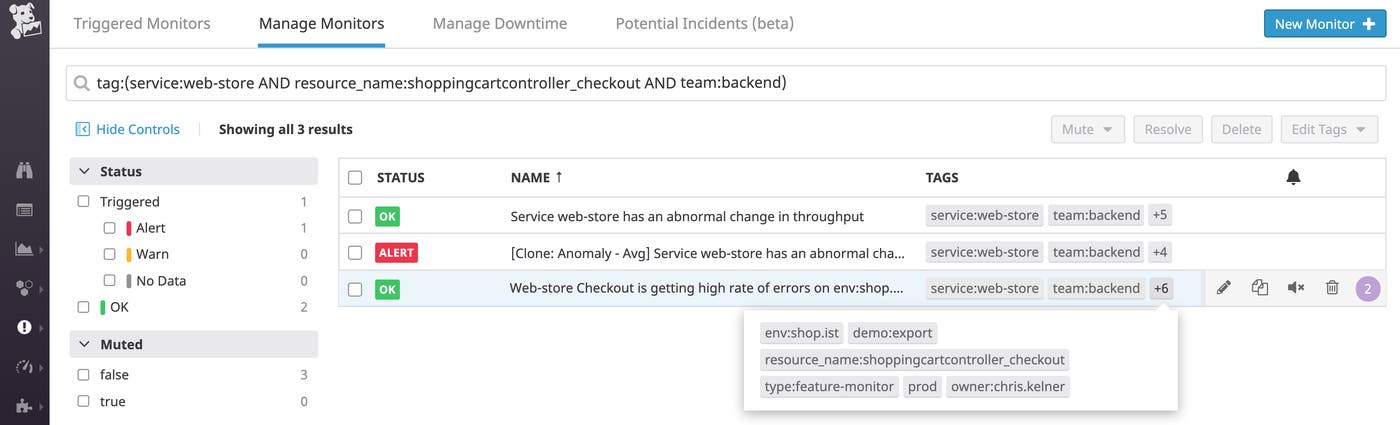
Once your monitors are tagged with useful metadata, you can use those tags to quickly find specific monitors in your Datadog account. Simply include a tag facet in your search query, using tag:<KEY>:<VALUE> for key-value pair tags and tag:<VALUE> for keyless tags. You can also use boolean logic operators to search for any specific combination of tags.
In the example below, we are searching the Manage Monitors page for monitors tagged with service:web-store, resource_name:shoppingcartcontroller_checkout, and team:backend.
To programmatically manage or search for monitors, you can use the tags argument in the datadog_monitor Terraform resource. You can also use the Datadog Monitors API to programmatically search for specific monitors, using the same tag query. Doing so returns the IDs and other details of all the monitors that match your search query, which in turn can be fed as the inputs for other API capabilities, such as muting and resolving monitors.
from datadog import initialize, api
options = {
'api_key': '<DATADOG_API_KEY>',
'app_key': '<DATADOG_APPLICATION_KEY>'
}
initialize(**options)
# Search monitors
api.Monitor.search(query="tag:(service:web-store AND resource_name:shoppingcartcontroller_checkout AND team:backend)")
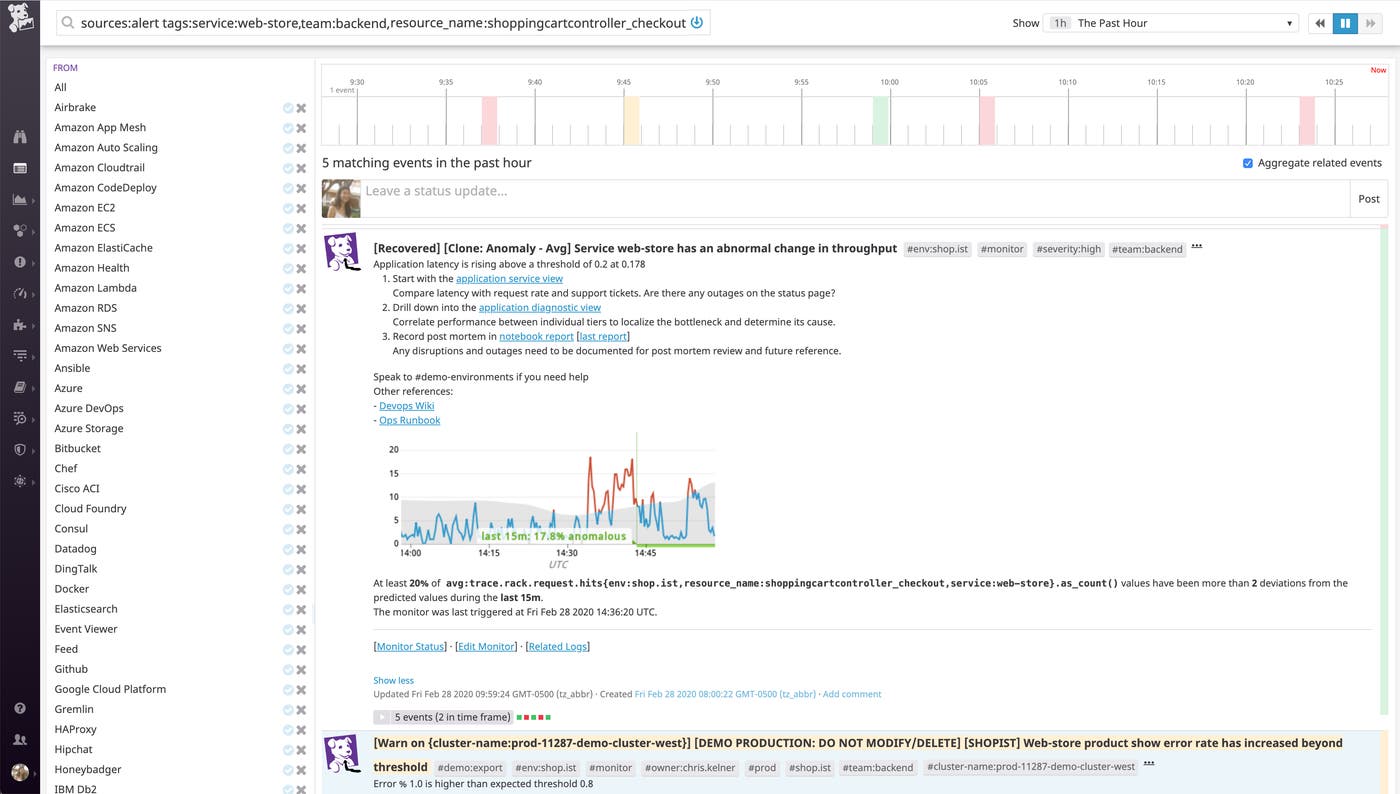
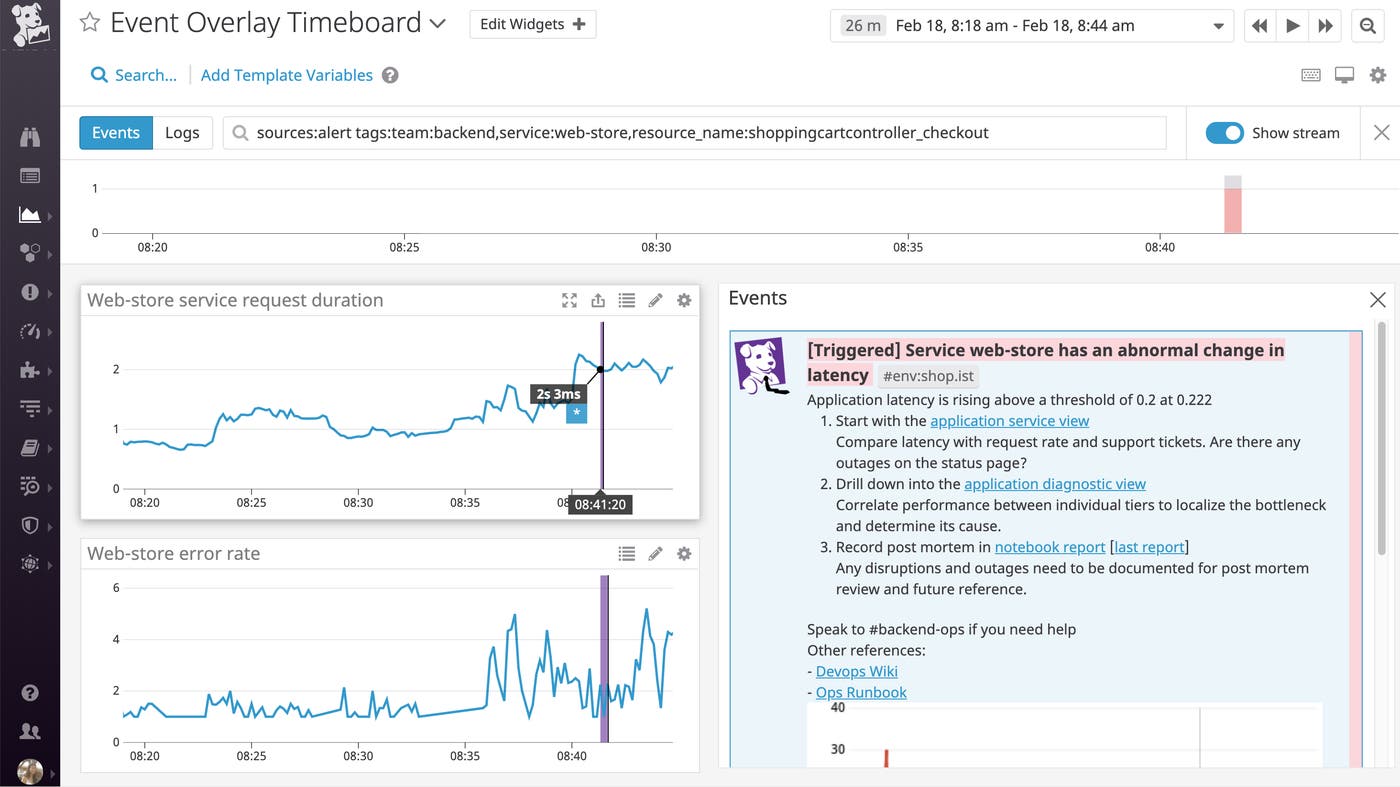
Whenever monitors trigger or recover from an alerting state, Datadog creates an event that helps you track this change in status. You can include sources:alert in your search query to find monitor-related events in Datadog’s event stream. Adding a tags query allows you to use tags to drill down with precision. In this case, we are using monitor tags to filter for events that are associated with a specific team and service.
With the Datadog Events API, you can also use the tags argument to programmatically query the Datadog event stream for monitor-related events.
from datadog import initialize, api
import time
options = {
'api_key': '<DATADOG_API_KEY>',
'app_key': '<DATADOG_APPLICATION_KEY>'
}
initialize(**options)
end_time = time.time()
start_time = end_time - 100
api.Event.query(
start=start_time,
end=end_time,
sources=["alert"],
tags=["team:demo-env,service:web-store,resource_name:shoppingcartcontroller_checkout"],
unaggregated=True
)
Utilizing tags in your searches allows you to respond faster to triggered monitors, begin your troubleshooting process sooner, and minimize an issue’s potential impact on your users.
In certain situations, you may not want your monitors to trigger (e.g., during scheduled maintenance windows). To plan for these situations and reduce potential alert fatigue, you can configure downtime for your monitors, which will suppress any notifications that would have been sent during the specified period. This does not impact the status of your monitors (i.e. this does not prevent a monitor from entering a triggered status like ALERT or WARN) but is beneficial for ensuring that your team does not receive unnecessary alert notifications.
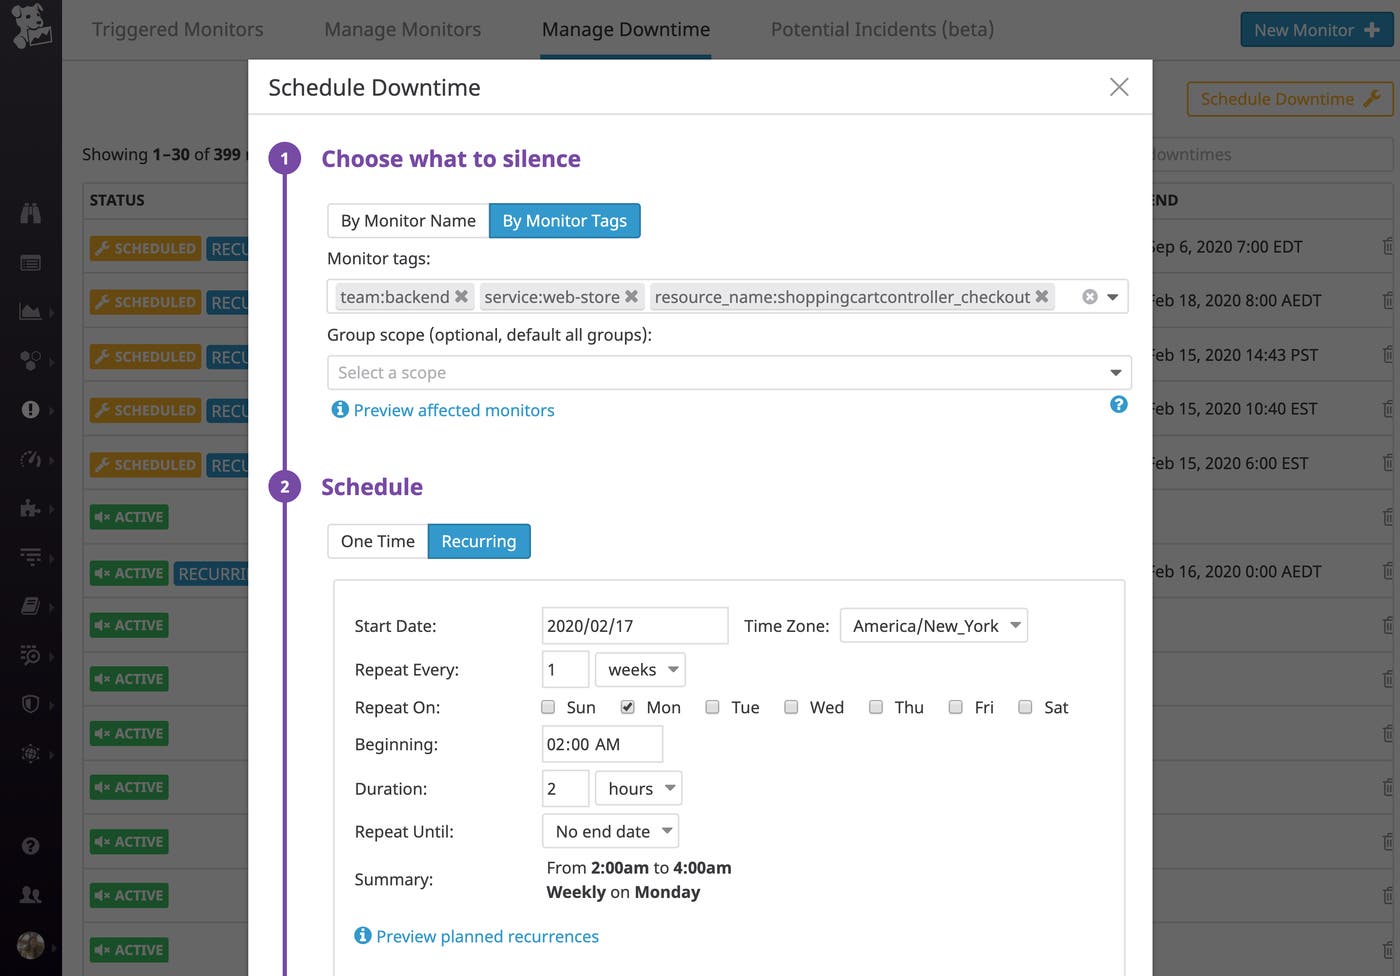
You can schedule downtime by searching for the names of the monitors you want to mute. However, if there are a large number of monitors that will be affected by a maintenance window, it will quickly become a very tedious process to manually enter the name of each monitor. Fortunately, if you’ve tagged your monitors, you can enter a specific set of tags to schedule downtime for a meaningful group of monitors. Thus, using the same example, if you want to mute all monitors that are associated with the backend team, web-store service, and shoppingcartcheckout_controller resource, you could enter those tags in the Datadog UI, as shown below.
You can also use tags when programmatically scheduling downtime, via the monitor_tags argument of the Datadog Downtimes API or the datadog_downtime resource in Terraform.
from datadog import initialize, api
import time
options = {
'api_key': '<DATADOG_API_KEY>',
'app_key': '<DATADOG_APPLICATION_KEY>'
}
initialize(**options)
# Repeat for 2 hours (starting now) on every Saturday day for 4 weeks.
start_ts = int(time.time())
end_ts = start_ts + (2 * 60 * 60)
end_reccurrence_ts = start_ts + (4 * 7 * 24 * 60 * 60) # 4 weeks from now
recurrence = {
'type': 'weeks',
'period': 1,
'week_days': ['Sat'],
'until_date': end_reccurrence_ts
}
# Schedule downtime
api.Downtime.create(
scope='env:demo',
monitor_tags='team:demo-env,service:web-store,resource_name:shoppingcartcontroller_checkout'
start=start_ts,
end=end_ts,
recurrence=recurrence
)
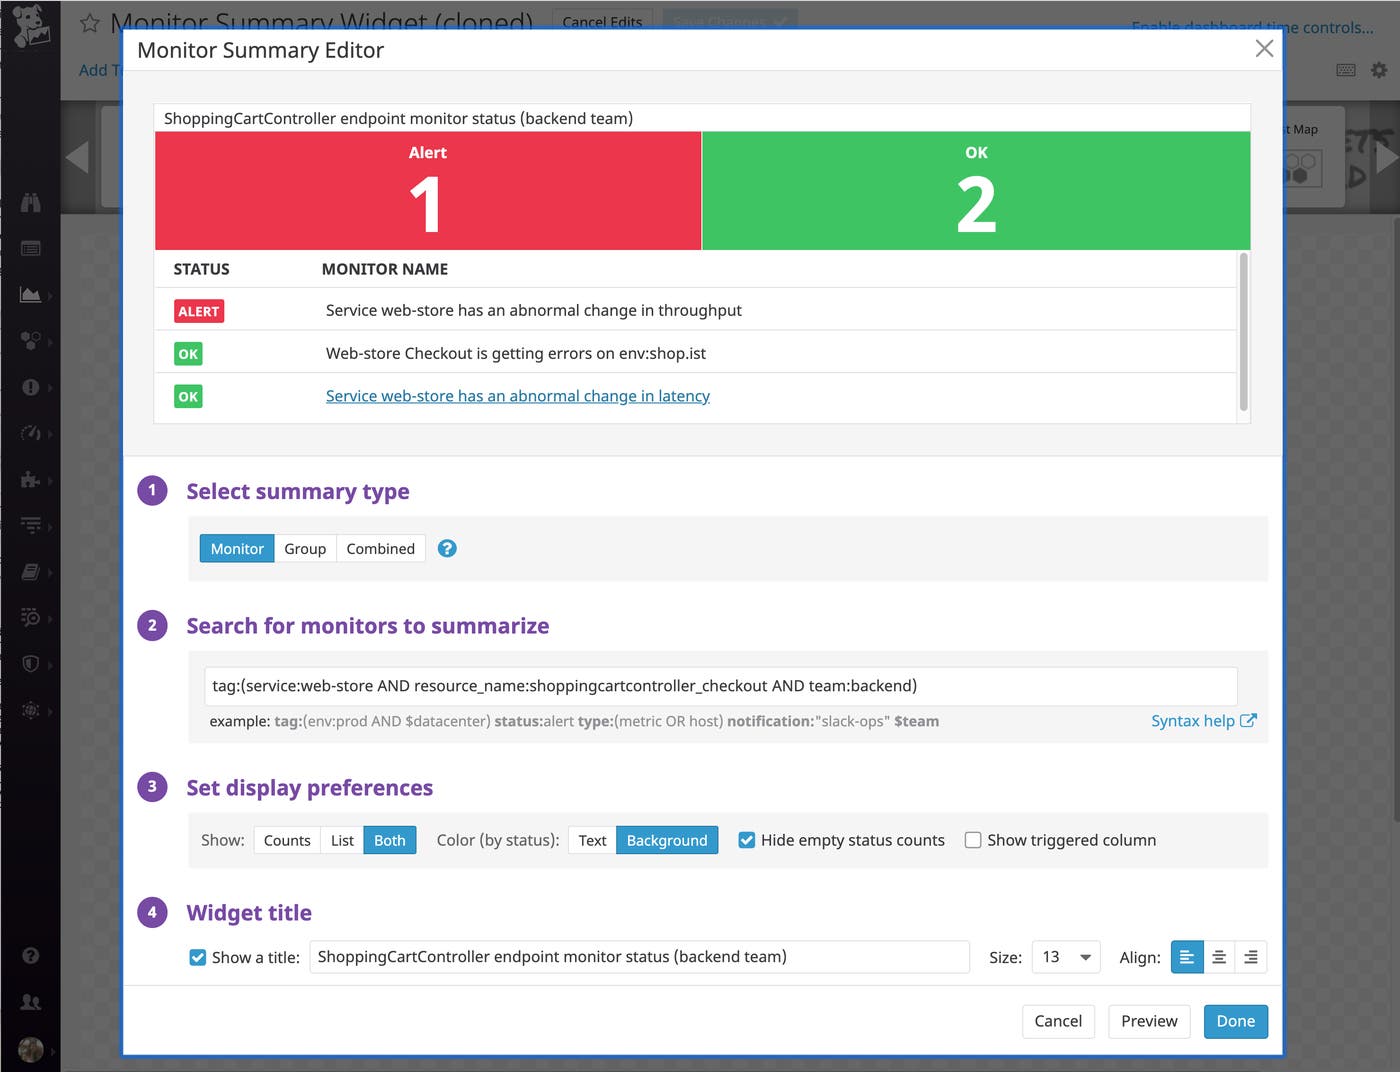
You can also use monitor tags to enhance your dashboards. For instance, you can add a monitor summary widget to any screenboard to view the state of relevant monitors at a glance. To create and filter results in a monitor summary widget, enter a search query in the widget editor, just like you would in the Manage Monitors or Triggered Monitors pages. You can also create Monitor Summary widgets programmatically with the Monitor Summary Widget API.
Below is an example of a Monitor Summary widget that uses the same search query as the Manage Monitors page example from above.
You can also use the same tag-based query to overlay events—such as triggered monitors—on timeseries graphs in your dashboards.
If you intend to use a monitor as an SLI in your SLOs, we recommend tagging that monitor with the type of SLI it tracks. This allows you to easily find all of the monitors that track a specific type of SLI by using the sli tag to search the Manage Monitors or Triggered Monitors pages.
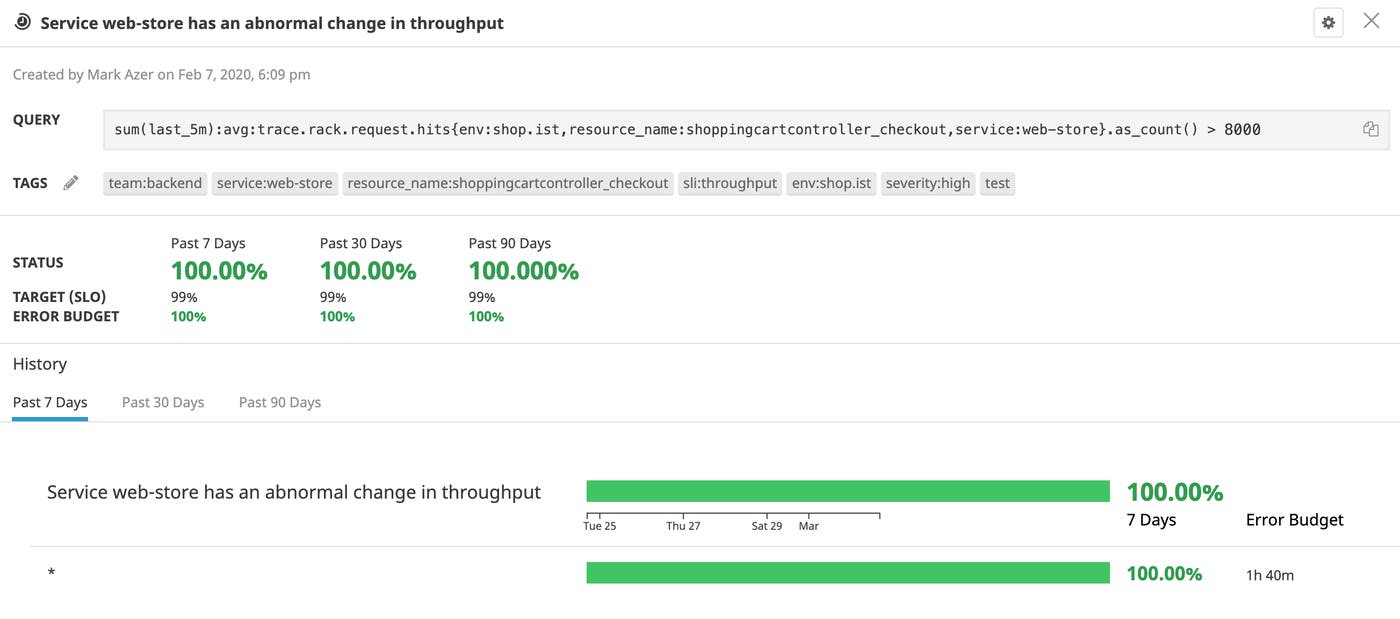
Tagging your SLI-based monitors also helps you better organize your SLOs. When you create a monitor-based SLO, that SLO will automatically inherit the tags of its constituent monitors. This means that you’ll be able to use these tags whenever you need to quickly filter your Service Level Objectives view to find a specific SLO based on the team, environment, or any other relevant tag. Below, we can see the details panel of an SLO that uses the same monitor from our previous examples as its SLI. Since the SLO automatically inherited this monitor’s tags, we can use those tags to search for this SLO in the Service Level Objectives view.
In this post, we’ve covered best practices for tagging your monitors, and explored how tags can help you quickly find the information you need for troubleshooting issues in real time. We’ve also seen how key:value tags help you:
streamline the way you schedule downtime for monitors;
create rich dashboards that display the real-time status of specific monitors; and
effectively organize your service-level objectives.
Once you’ve tagged your monitors with relevant metadata, you will be able to quickly resolve issues, reduce mean time to resolution, and minimize potential impact on your customers. If you’re already using Datadog, check out our documentation to learn about more best practices for tagging monitors. If not, get started by signing up for a free trial.
此内容由惯性聚合(RSS阅读器)自动聚合整理,仅供阅读参考。 原文来自 — 版权归原作者所有。