惯性聚合 高效追踪和阅读你感兴趣的博客、新闻、科技资讯
阅读原文 在惯性聚合中打开

推荐订阅源

www.infosecurity-magazine.com
Security Archives - TechRepublic
TaoSecurity Blog
TaoSecurity Blog
Cloudbric
Cloudbric
cs.CL updates on arXiv.org
N
News and Events Feed by Topic
Threat Intelligence Blog | Flashpoint
S
Securelist
The Cloudflare Blog
让小产品的独立变现更简单 - ezindie.com
D
DataBreaches.Net
S
Schneier on Security
L
LangChain Blog
Jina AI
Jina AI
M
MIT News - Artificial intelligence
Recent Announcements
T
Tenable Blog
B
Blog RSS Feed
V
Visual Studio Blog
Simon Willison's Weblog
G
Google Developers Blog
T
The Exploit Database - CXSecurity.com
Exploit-DB.com RSS Feed
WordPress大学
WordPress大学
W
WeLiveSecurity
I
InfoQ
The Hacker News
The Hacker News
雷峰网
雷峰网
月光博客
月光博客
P
Privacy & Cybersecurity Law Blog
O
OpenAI News
Hacker News: Ask HN
Hacker News: Ask HN
T
Threat Research - Cisco Blogs
GbyAI
GbyAI
The Last Watchdog
The Last Watchdog
P
Privacy International News Feed
Cyberwarzone
Cyberwarzone
S
SegmentFault 最新的问题
L
Lohrmann on Cybersecurity
人人都是产品经理
人人都是产品经理
V
V2EX
V
Vulnerabilities – Threatpost
cs.CV updates on arXiv.org
C
Cybersecurity and Infrastructure Security Agency CISA
freeCodeCamp Programming Tutorials: Python, JavaScript, Git & More
T
Troy Hunt's Blog
Application and Cybersecurity Blog
阮一峰的网络日志
阮一峰的网络日志
SecWiki News
SecWiki News
Microsoft Azure Blog

Datadog | The Monitor blog

Introducing our open source AI-native SAST Instrument and monitor Boomi integration flows with OpenTelemetry and Datadog Not all index scans are equal: How we cut query latency by over 99% Platform engineering metrics: What to measure and what to ignore Integrate Recorded Future threat intelligence with Datadog Cloud SIEM CI/CD security: threat modeling using a MITRE-style threat matrix CI/CD security: How to secure your GitHub ecosystem Ingress NGINX is EOL: A practical guide for migrating to Kubernetes Gateway API Operating agentic AI with Amazon Bedrock AgentCore and Datadog LLM Observability: Lessons from NTT DATA Introducing the Datadog Code Security MCP Capture and analyze custom heatmaps in Session Replay Understand session replays faster with AI summaries and smart chapters Monitor ClickHouse query performance with Datadog Database Monitoring How we designed empathetic alert sounds for on-call engineers Search and act across Datadog to resolve issues faster with Bits Assistant Measure the business impact of every product change with Datadog Experiments Analyzing round trip query latency Configuring JavaScript caches for better performance Introducing Bits AI Dev Agent for Code Security Datadog achieves ISO 42001 certification for responsible AI Monitor Nutanix clusters, hosts, and VMs with Datadog Monitor Juniper Mist in Datadog A new Host Map for modern infrastructure Annotate traces to improve LLM quality with Datadog LLM Observability What’s new in Cloud SIEM: AI-powered investigations, enhanced threat intelligence, and scalable security operations Explore Kubernetes with native OpenTelemetry data Monitor Oracle Fusion Cloud Applications with Datadog Announcing the Datadog Terraform provider v4.0.0 Scaling Kubernetes workloads on custom metrics How to design cloud environments for AI-powered threat analysis Monitor Aruba Central in Datadog How we centralize and remediate risks with Datadog Case Management Accelerate incident response with Datadog and ServiceNow Monitor your application and network load balancer logs Understanding Karpenter architecture for Kubernetes autoscaling Tools for collecting metrics and logs from Karpenter Monitor Karpenter with Datadog What your product data is actually saying Key metrics for monitoring Karpenter Securing Datadog’s platform in the AI age: The role of observability data Four ways engineering teams use the Datadog MCP Server to power AI agents Approaching your observability migration with the right mindset Meet the new Bits AI SRE: Deeper reasoning, twice as fast Key learnings from the 2026 State of DevSecOps study Use plain English to query your multi-cloud infrastructure in Resource Catalog Simplifying troubleshooting across the user journey with Datadog Synthetic Monitoring Protect your OCI resources with Datadog Cloud Security This Month in Datadog - February 2026 Amazon EC2 security: How misconfigured and public AMIs expand your cloud attack surface Enable end-to-end visibility into your Java apps with a single command Measure and improve mobile app startup performance with Datadog RUM Evaluating our AI Guard application to improve quality and control cost Identify untested code across every level of your codebase Make use of guardrail metrics and stop babysitting your releases Monitor Versa Networks SD-WAN performance in Datadog Improve performance and reliability with APM Recommendations Remediate transitive vulnerabilities faster with Datadog Software Composition Analysis Generate audit-ready vulnerability and compliance reports with Datadog Sheets Monitor Fortinet FortiManager performance in Datadog Improve test coverage across codebases with Datadog Code Coverage Move fast, don’t break things: Consistent testing standards at scale Enrich logs with ServiceNow CMDB context before routing to any SIEM or logging tool Monitor Lustre with Datadog Make faster, better product decisions with Datadog Product Analytics Surface and remediate runtime posture issues with Workload Protection Findings Protect agentic AI applications with Datadog AI Guard How to optimize JavaScript code with CSS Trace Google Pub/Sub workloads in Cloud Run with Datadog Detect human names in logs with ML in Sensitive Data Scanner How we cut our NLQ agent debugging time from hours to minutes with LLM Observability Debug PostgreSQL query latency faster with EXPLAIN ANALYZE in Datadog Database Monitoring Datadog acquires Propolis Unify and correlate frontend and backend data with retention filters Scale compliance across global frameworks with Datadog Cloud Security Monitor Arista VeloCloud SD-WAN performance with Datadog Building reliable dashboard agents with Datadog LLM Observability Simplify log collection and aggregation for MSSPs with Datadog Observability Pipelines Mitigation for Node.js denial-of-service vulnerability affecting Datadog APM Automate flaky test fixes with the Bits AI Dev Agent and Test Optimization How we built an AI SRE agent that investigates like a team of engineers Datadog integrations 2025 recap: Observability for AI, security, and hybrid cloud Design effective executive dashboards with Datadog Implement dbt data quality checks with dbt-expectations Bring faster visibility into AWS Lambda functions with remote instrumentation Troubleshoot faster with the GitLab Source Code integration in Datadog How Cambia Health Solutions saved $30,000 monthly with Cloud Cost Management and the Datadog Resource Catalog Normalize any logs for Cloud SIEM with Datadog's OCSF processor Optimizing Datadog at scale: Cost-efficient observability at Zendesk Detect, diagnose, and resolve network issues easily with CNM Network Health Connect engineering errors to user impact in early-stage products Cilium configuration for Kubernetes operations at scale Designing feedback loops for progressive delivery Ship features faster and safer with Datadog Feature Flags Choosing the right OpenTelemetry Collector distribution Route your monitor alerts with Datadog monitor notification rules Automate Cloud SIEM investigations with Bits AI Security Analyst Cloud threat detection: How to identify risky activity across control and data planes Collecting Kafka performance metrics Monitoring Kafka with Datadog Monitoring Kafka performance metrics
Monitor your Linux Web Apps on Azure App Service with Datadog
Jordan Obey · 2023-04-24 · via Datadog | The Monitor blog
Jordan Obey

Jordan Obey

Senior Technical Content Writer

Azure App Service is a fully managed platform-as-a-service (PaaS) solution for deploying web applications, event-driven functions, RESTful APIs, and more. Azure App Service enables developers to quickly build and release services that scale dynamically—without worrying about provisioning and maintaining infrastructure. Last year, we released the Datadog extension for Azure App Service for deep visibility into your Windows .NET applications. But you may have web applications that are optimized for other runtimes, frameworks, and operating systems. To provide further visibility into Azure App Service, we’ve released Web App tracing and custom metrics for Azure App Service applications running in Linux-based environments with support for .NET, Node.js, Java, Python, and PHP runtimes.

In this post, we’ll look at how you can capture distributed traces across your Azure App Service Linux web applications, write and submit custom metrics, and tie it all together with the Azure Serverless view to gain quick insights and speed up troubleshooting.

Distributed request tracing for Linux apps

After you instrument your Azure App Service Linux web application, its request traces will be captured automatically. These traces are available through Datadog APM and are visualized as flame graph spans that represent the time it took for processes to execute in response to a request. Flame graphs trace the lifecycle of requests as they propagate across your stack, enabling you to see when your Linux web applications interact with any of your other cloud resources, such as an Azure SQL Database or Azure Function.

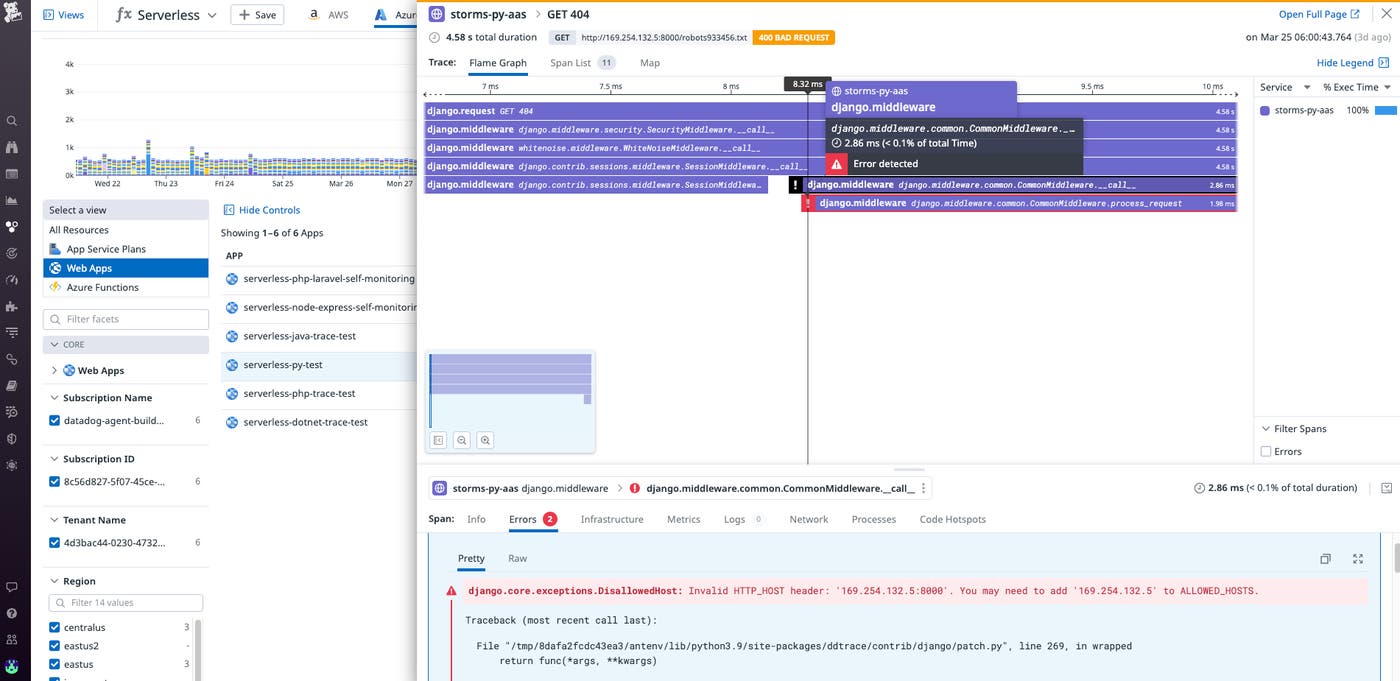
Datadog APM also automatically tags errorful spans to surface emergent issues. For instance, in the screenshot below we can see that a request to a Django Web App deployed in an Azure App Service Linux environment is throwing a DisallowedHost exception. This may indicate misconfigured settings or, more urgently, a legitimate security breach attempt.

azure-linux01

Write and submit custom metrics

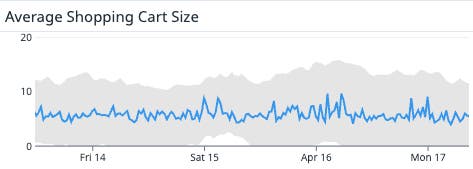
Sending custom metrics to Datadog is critical for monitoring key performance indicators (KPIs) that are important to your specific business and applications. If you are operating an ecommerce site running in a Linux environment, for example, you can create custom metrics for KPIs such as the number of visitors, average shopping cart size, average weekly revenue, and more. These metrics expand your monitoring capabilities by providing the flexibility to visualize telemetry tailored to your needs.

azure-linux03

To start monitoring the KPIs of your choice and keep track of your applications’ performance, simply enable custom metrics in your Azure application settings and install the DogStatsD client for your runtime.

Pivot between Linux Web App telemetry in the Serverless view

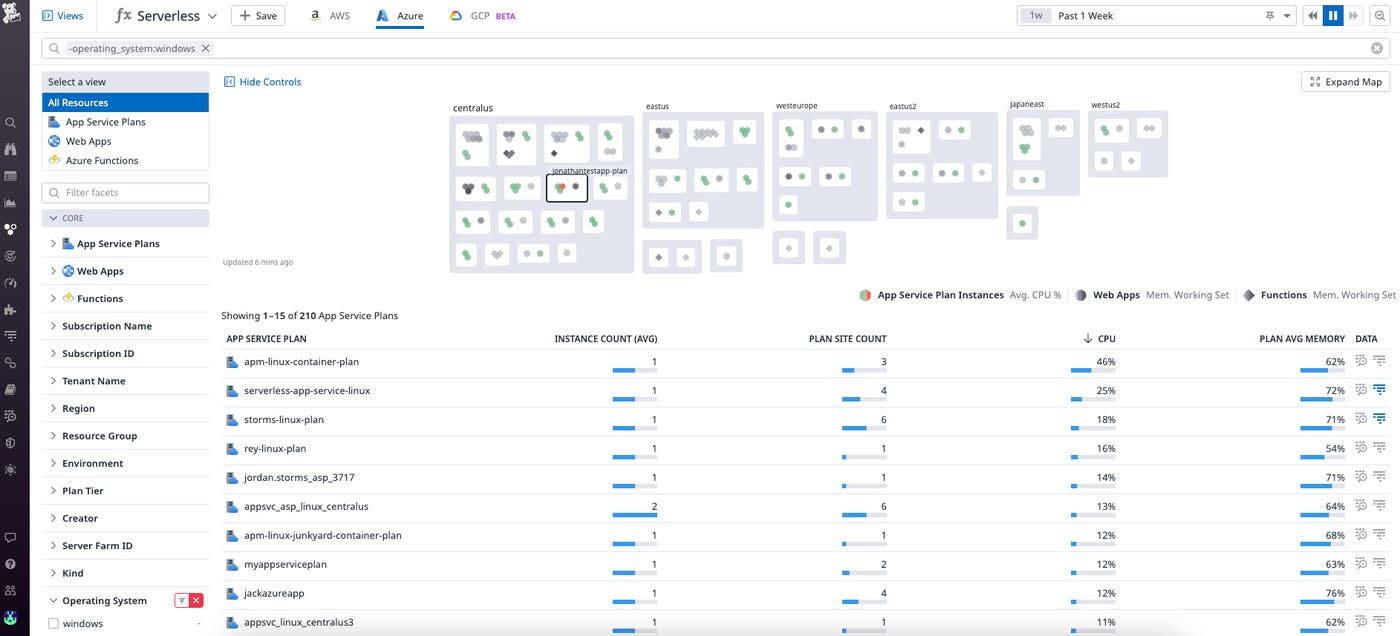
Datadog’s Serverless view provides you with a birds-eye view of your entire Azure App Service architecture, enabling you to monitor your Linux web applications in context. And because Datadog automatically tags your instrumented Azure App Service resources, you can easily narrow your view down to the subset of resources you care most about. In the screenshot below, we’ve narrowed our view to only show the regions where Linux web applications are deployed.

azure-linux02

You can then filter your view down further to uncover slow or resource-intensive Web Apps for troubleshooting. Let’s say that you see a Web App named linux-example-aas-app with an unusually high response. From the Serverless view, you can click on that Web App and immediately pivot to its associated metrics and traces to surface root causes behind the issue that need addressing such as 4xx or 5xx errors.

Get started today

Distributed tracing and custom metrics are now currently available for Azure App Service Linux Web Apps with support for .NET, Node.js, Java, Python, and PHP runtimes. To learn more about how Datadog provides visibility into your Azure App Service web applications, check out our documentation here.

If you aren’t already using Datadog, sign up today for a 14-day free trial.