


Datadog gives front- and backend developers unified visibility into the health and performance of their applications across the full development lifecycle. At this year’s DASH, we announced features that enable developers to instrument services more efficiently and visualize distributed traces and code profiles in more ways to identify opportunities for optimization. We also launched new data observability features that give teams deep, end-to-end insights into their data streams, including the ability to track data quality, database schemas, and more. And frontend developers can get a more comprehensive view of their applications’ user experience through new Datadog RUM and Error Tracking features.
In this post, see these and other offerings to help you monitor every aspect of your applications. Then, check out our keynote roundup for more announcements like:
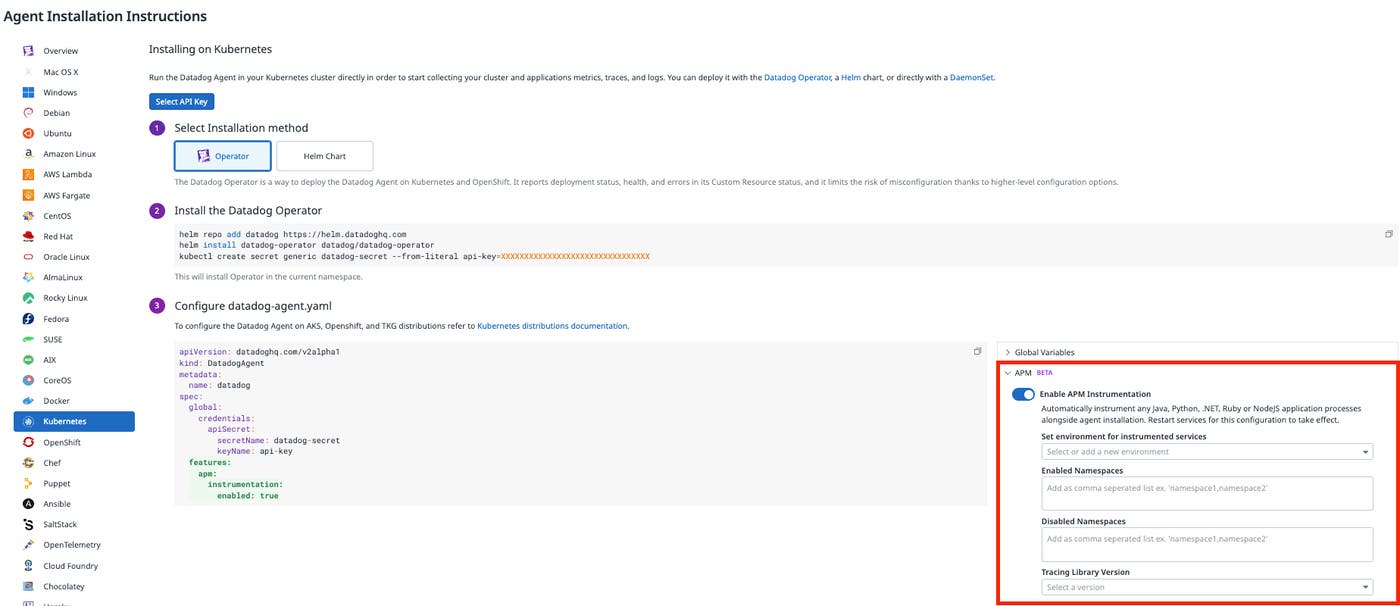
Datadog’s market-leading APM solution provides users deep, service-level insight with telemetry in context and AI assistance so they can observe, troubleshoot, and improve their cloud-scale applications. However, organizations can struggle to efficiently set up APM via the instrumentation of code owned by disparate infrastructure and application teams. To help customers roll out distributed tracing more quickly and easily across their entire organization, we released the Preview for Single Step Instrumentation last year. With this feature, one engineer can instrument all services in minutes at the same time they install the Datadog Agent, which automatically adds the relevant client library to the application’s code. Since last year, we’ve added support for:
ARM64 in addition to x86 chip architectures
Enabling APM across entire Kubernetes clusters or designated namespaces
Auto-generated service names for Java web applications that map closer to your mental model
Specifying the versions of APM libraries that instrument your applications
See our documentation to get started.
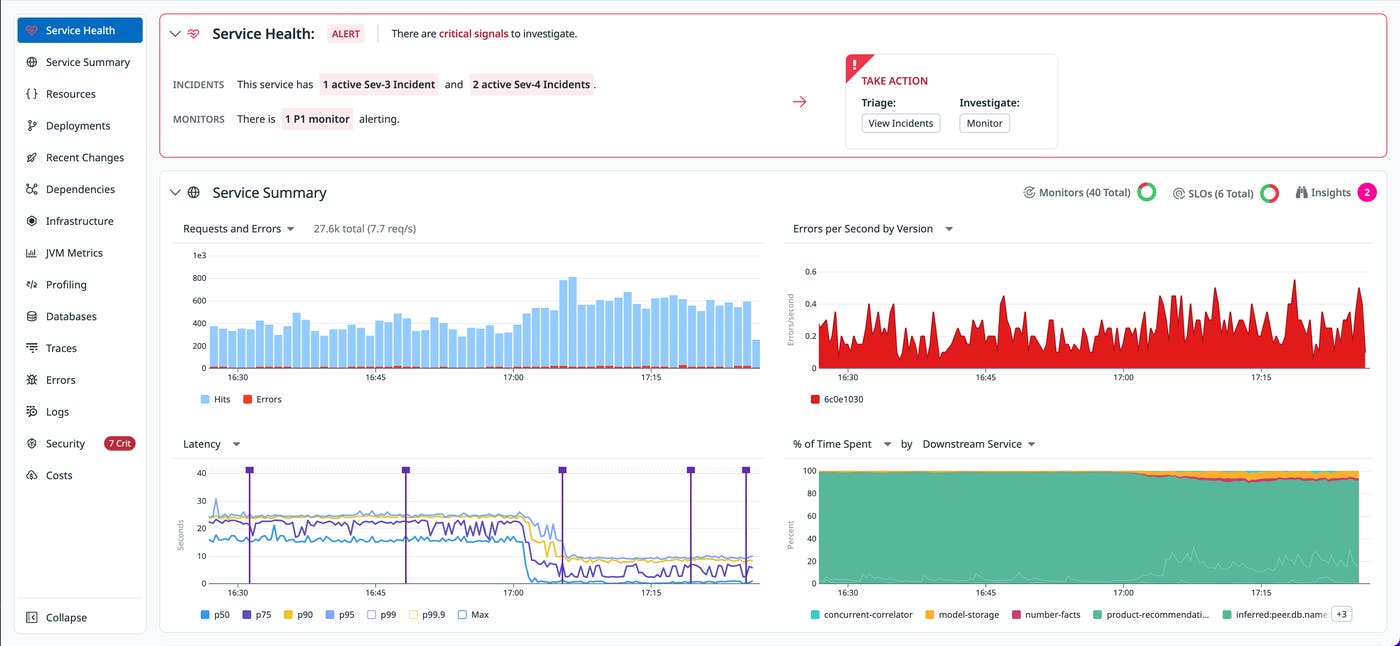
Datadog APM’s Service Pages tie together telemetry from across your infrastructure to help troubleshoot problems. However, interpreting all these signals at a glance can be challenging, and it can be difficult to understand how your services impact end users in order to triage issues and conduct postmortems. Service Pages now make it easier to understand the state of your services at a glance. The Service Health tab surfaces any critical signals related to the service, including active incidents and any monitors in an alert state. And, for each resource, the Frontend Impact tab provides key visibility into the frontend impact of service-level issues. Fill out this form to request access to these features.
When collecting distributed traces from your services, finding a balance between the volume of spans to ingest to get sufficient visibility on your environments and staying within your budgeted usage can be a challenge. To help solve that issue, Datadog now offers adaptive ingestion sampling. Datadog will automatically adjust sampling rates across specified services and endpoints to hit your budget at the end of the month while maintaining visibility into low traffic resources that can be missed with standard sampling strategies. APM adaptive sampling rates are now in Preview. Fill out this form to request access to this feature.
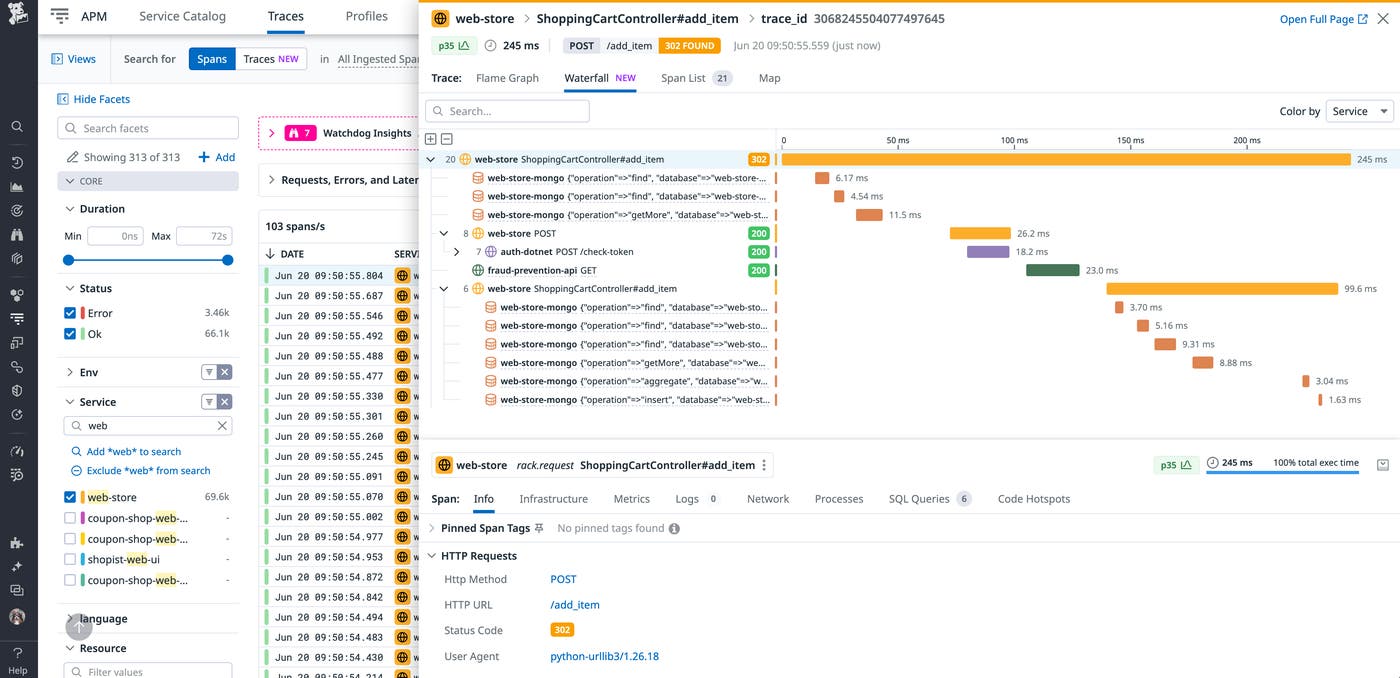
Large, complex traces can be challenging to effectively visualize and investigate. Now, in addition to flame graphs, Datadog APM provides a waterfall trace visualization that helps you easily navigate through the spans that compose a full trace in clear chronological order. Cycle through errors to understand how they propagate to downstream services, and easily identify parent—child relationships between spans for asynchronous requests. See our documentation for more information and get started today with Datadog APM and distributed tracing.
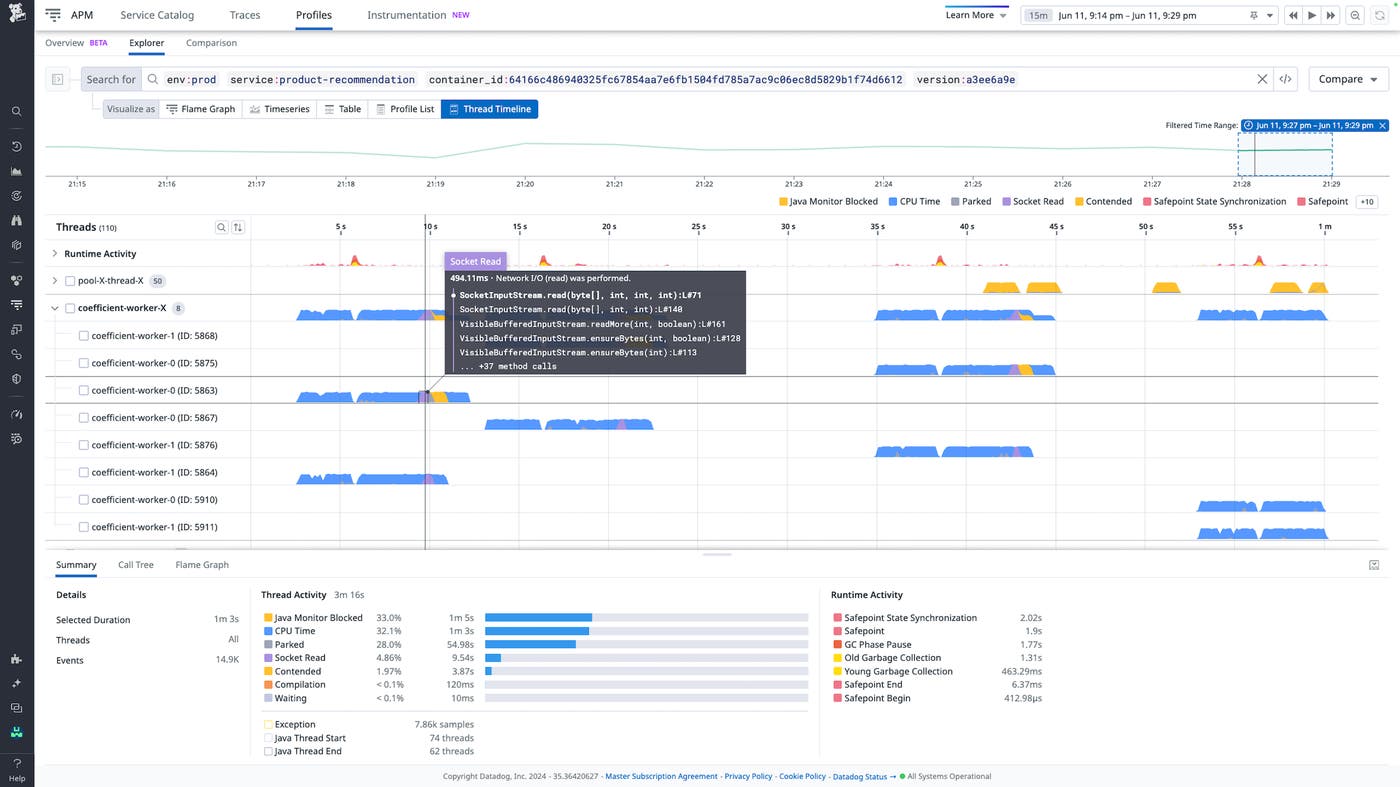
When you face issues like reduced throughput or latency spikes in your production applications, determining the cause isn’t always straightforward. To help software engineers tackle these kinds of challenges, Datadog Continuous Profiler now includes a timeline view. This feature provides a detailed chronological visualization of the code and runtime activity—grouped by thread pools, fibers, goroutines, or event loops—within a single instance of a service. Supported languages and frameworks for the timeline view feature include Java, .NET, Ruby, PHP, Go, and Node.js. Read more in our dedicated blog post.
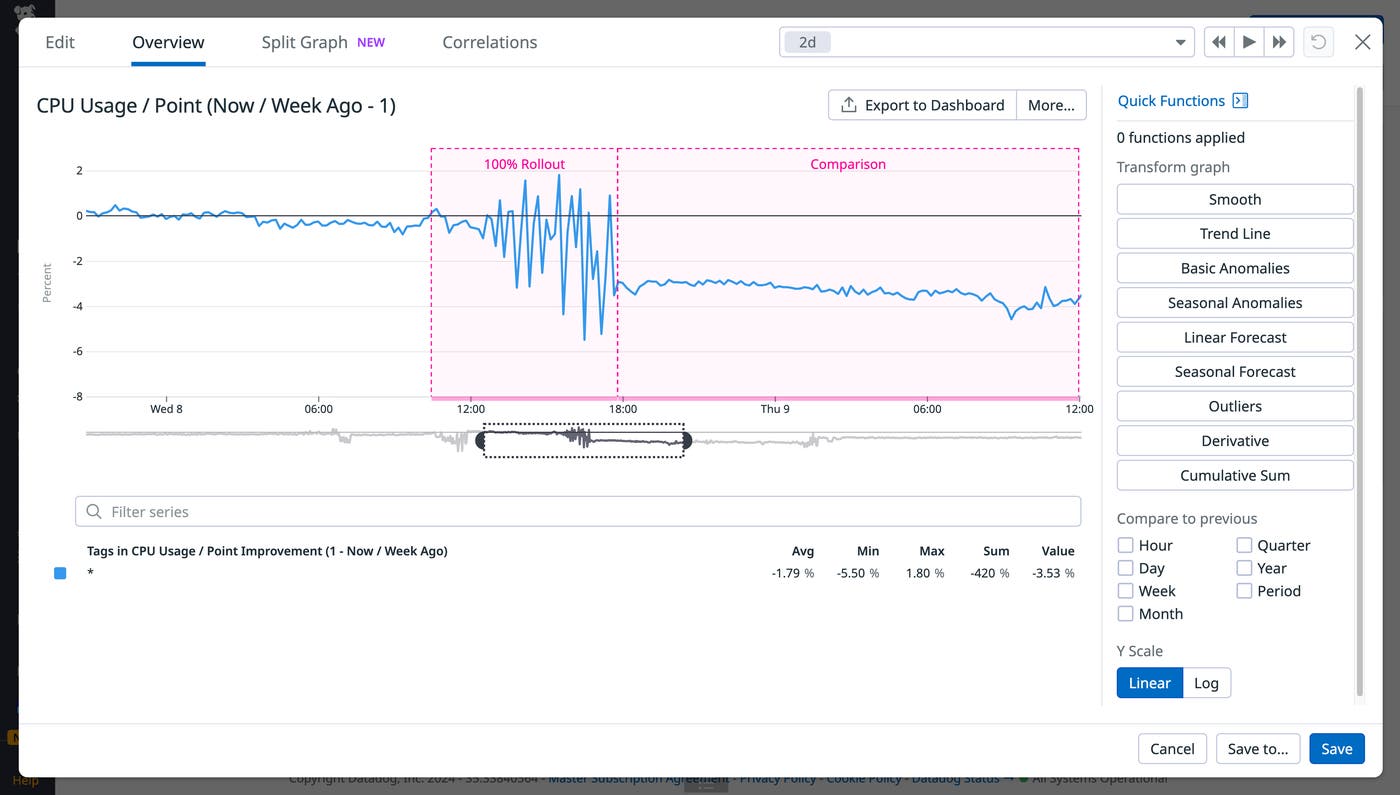
We are excited to release datadog-pgo, our tooling for continuous profile-guided optimization (PGO) for Go. datadog-pgo is a simple CLI tool that lets you take advantage of PGO by adding a single line of code to your CI scripts. It encodes our best practices for profile selection, and it keeps you protected from known regressions. You can now reduce the CPU usage of your Go services by up to 14 percent by adding one line before the go build step in your CI pipeline. See our blog post for more.
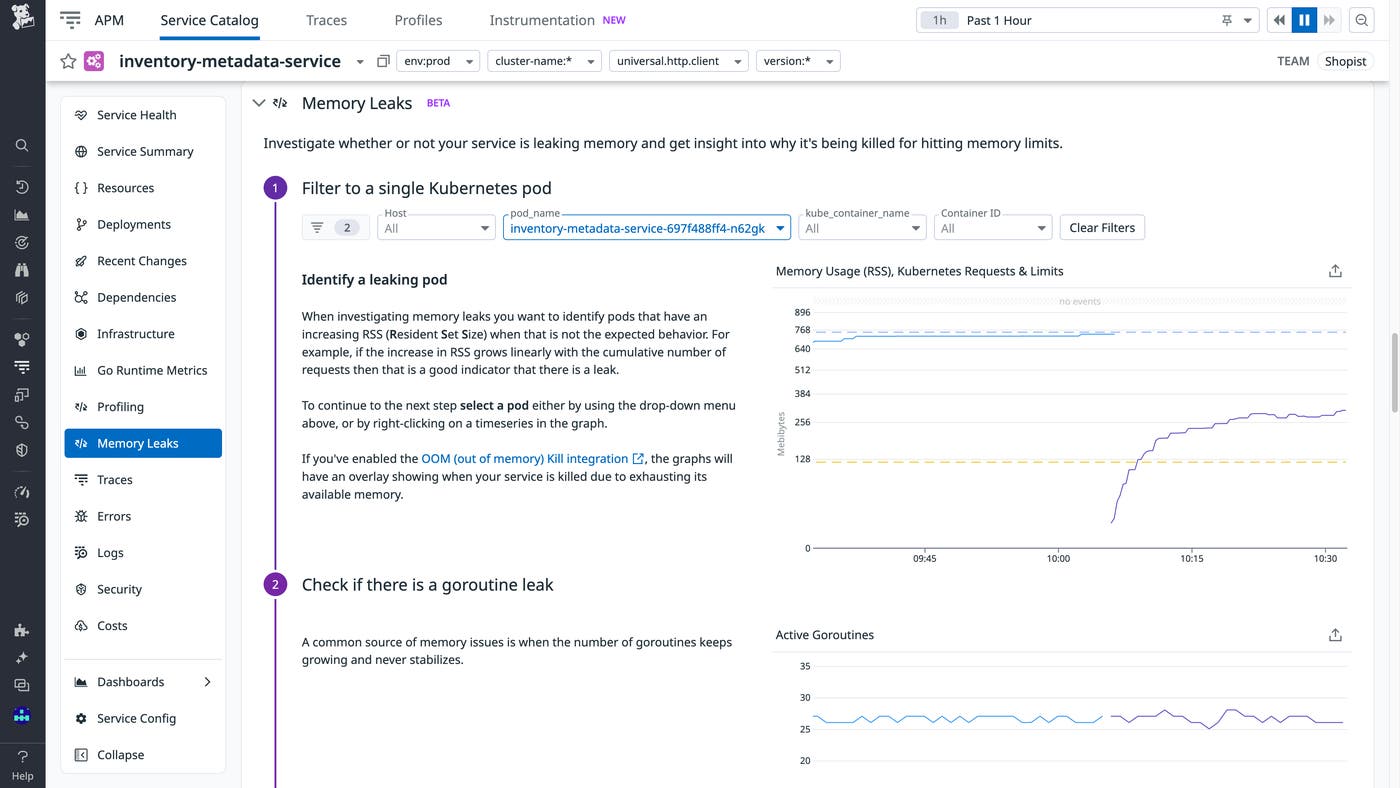
Memory leaks are a common and complex challenge that can have a big impact on service performance. Datadog Continuous Profiler collects several datasets, such as heap memory allocation, that can help developers identify and debug memory leaks. Now, we are excited to announce the launch of our new end-to-end walkthrough dedicated to addressing memory leaks. When viewing a service in Datadog APM, you can easily follow a guided investigation to determine whether or not your service is leaking memory and get insight into why it’s being killed for hitting memory limits, along with recommended next steps. This release simplifies the process of troubleshooting and fixing memory leaks. See our documentation to get started.
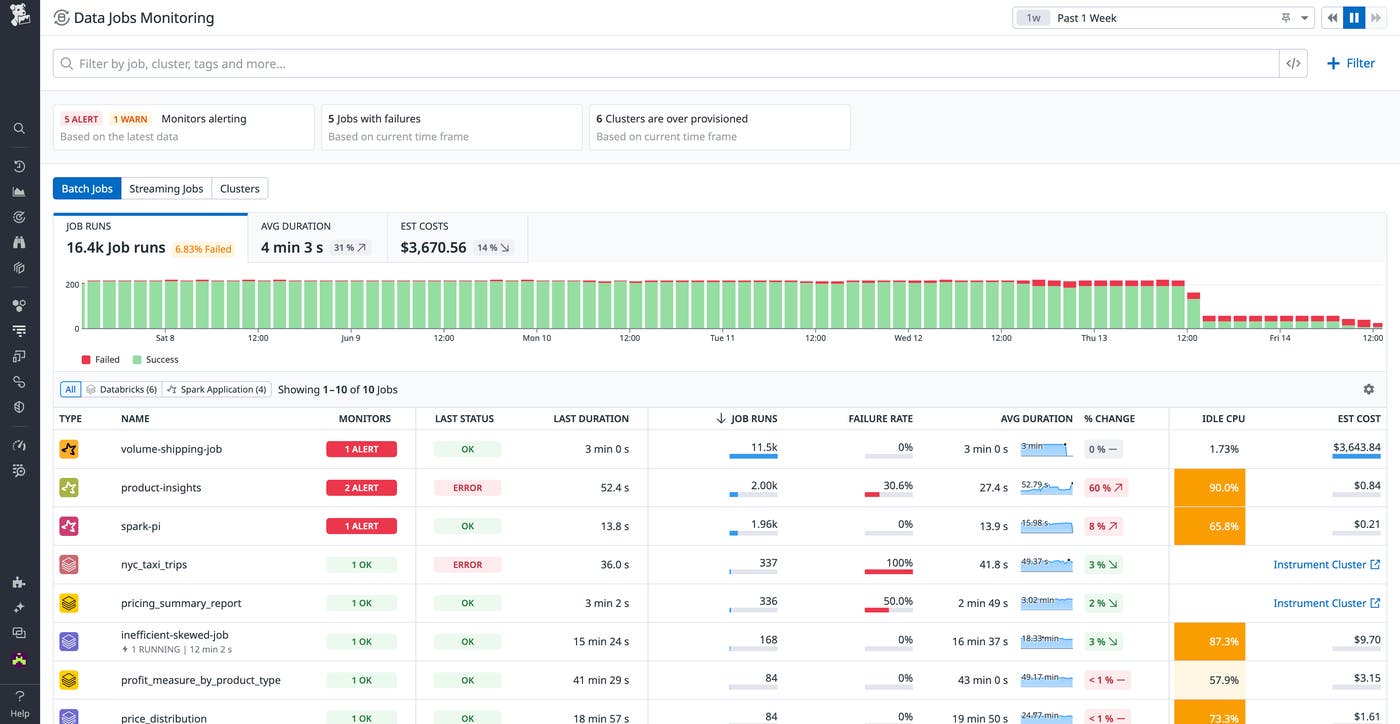
Datadog Data Jobs Monitoring (DJM) helps data platform teams and data engineers detect problematic Spark and Databricks jobs anywhere in their data pipelines, remediate failed and long-running jobs faster, and proactively optimize overprovisioned compute resources to reduce costs. DJM enables users to drill down into job execution traces at the Spark stage and task level to easily resolve issues and seamlessly correlate their job telemetry to their cloud infrastructure—all in context with the rest of their data stack. To learn more about DJM, read our dedicated blog post.
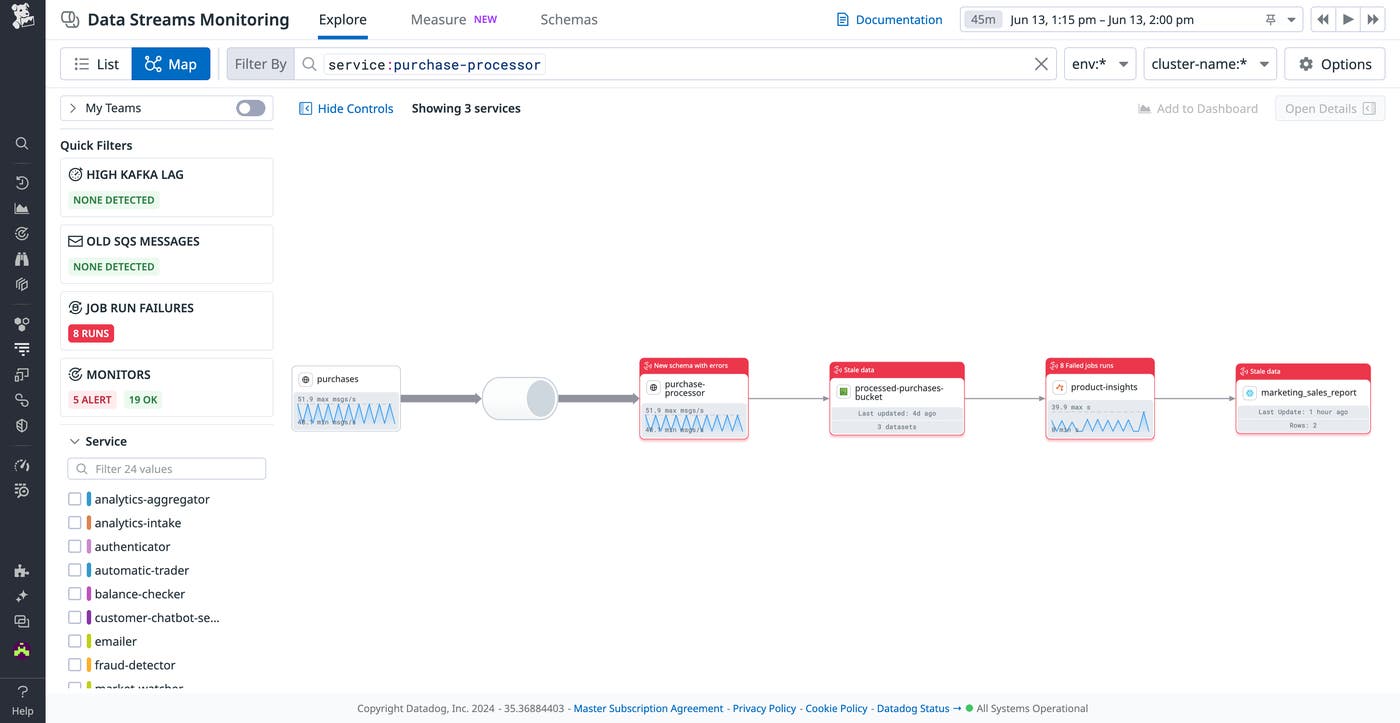
Datadog Data Streams Monitoring (DSM) makes it easy to understand, monitor, and optimize streaming data pipelines and event-driven applications that use technologies like Kafka and SQS. But for data pipelines, the path of the data often doesn’t end with Kafka producers and consumers; there are more components downstream, such as data processing jobs and datastores. Data Streams Monitoring now shows more of your data pipelines, so you can see data flow not only within services and queues, but through Spark jobs, S3 buckets, and Snowflake tables. This unified end-to-end view of ingestion, processing, and storage helps you pinpoint issues with cascading downstream impact and identify root causes. You can request access to the Preview here.
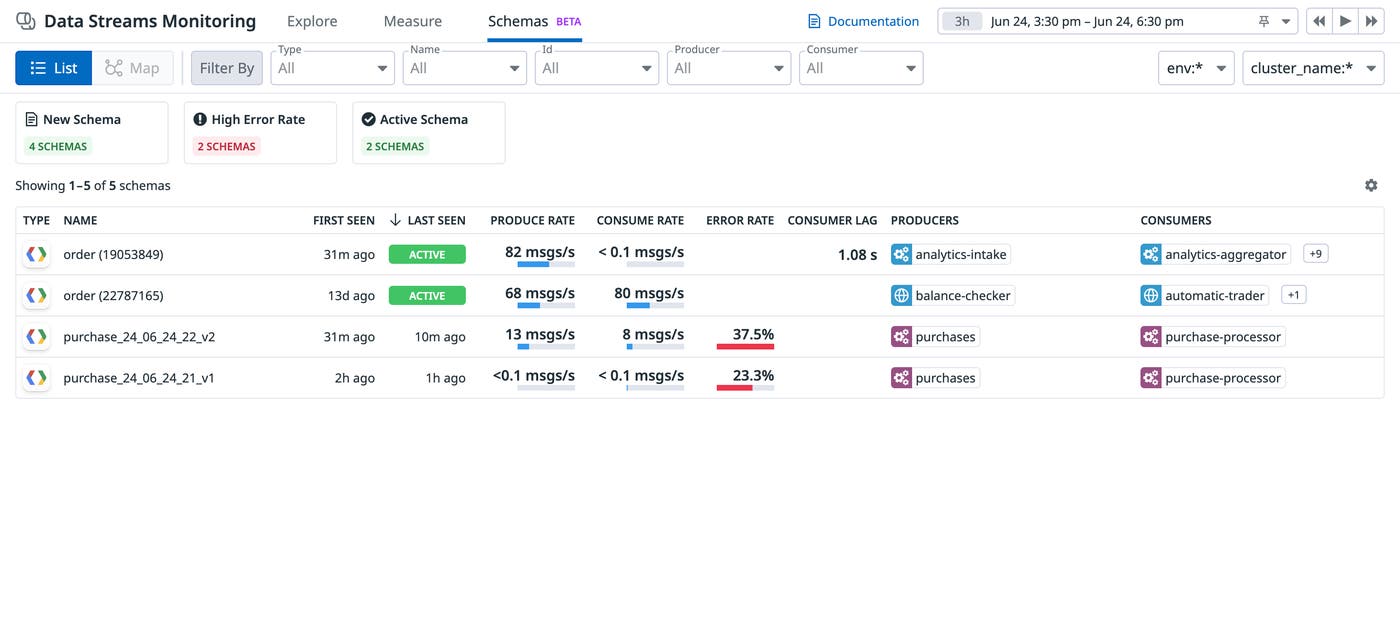
In streaming data pipelines, breaks in schema compatibility between producers and consumers can cause cascading impacts on downstream services. New schemas or unexpected modifications to existing ones can lead to consumer services struggling to process payloads, blocking further data flow. You can now use Datadog Data Streams Monitoring to get full visibility into your schemas. Datadog surfaces key health metrics, such as error rate and throughput, and identifies each schema’s producers and consumers. You can also track schema migrations and active schemas by viewing the first- and last-seen times of any schema. View the documentation for more details.
Datadog Universal Service Monitoring (USM) enables customers to automatically detect, map, and monitor their services without adding any code instrumentation or manual configuration. Now, in addition to custom services, USM can discover PostgreSQL databases and Kafka queues running in your infrastructure. For PostgreSQL, you can see which services are querying your databases, as well as the top queries being made. For Kafka, you can see which services are interacting with each queue, as well as the top produce and consume operations, all without a single line of code. To get started, request access to the Preview here.
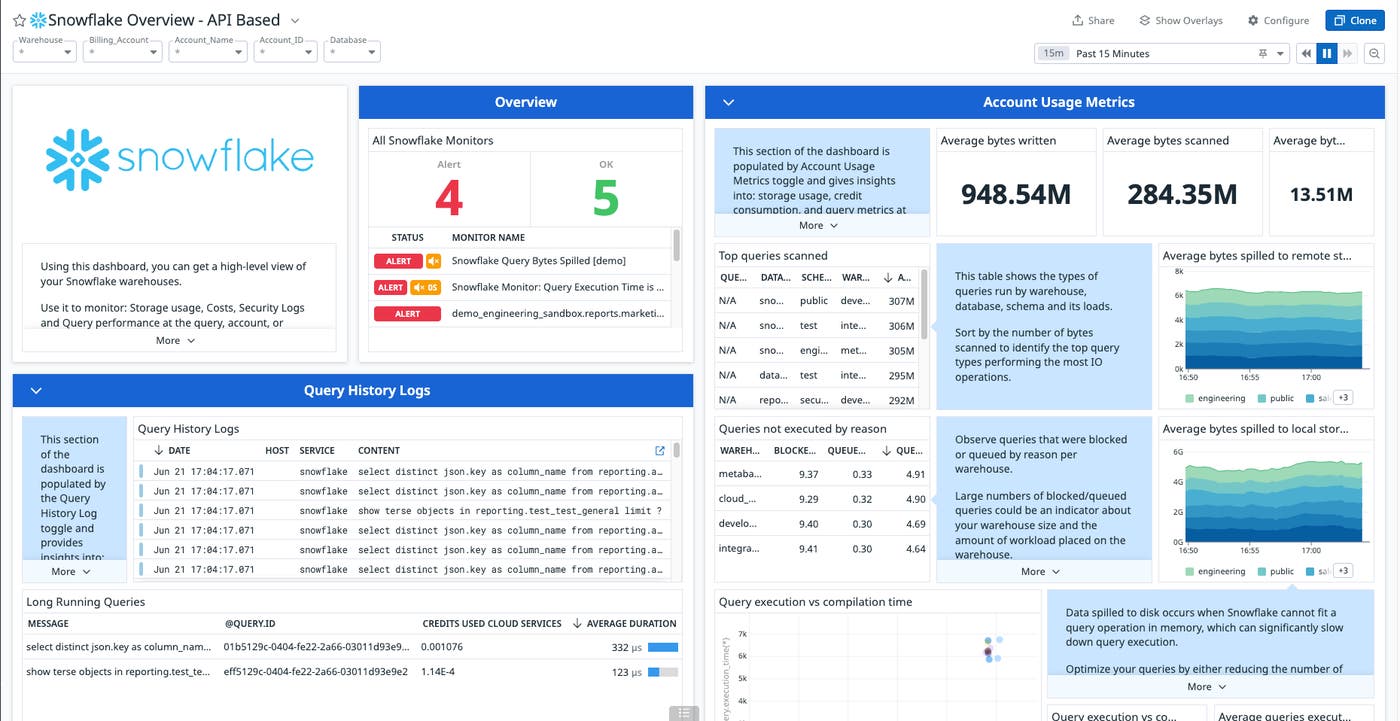
You can configure the new API-based Snowflake integration directly from the Datadog UI with no extra infrastructure management needed. In addition to collecting account and organization usage metrics to monitor storage usage, credit consumption, and query scans, you can now also use Datadog to:
View Snowpark errors and unhandled exceptions to easily identify code or data issues and reduce troubleshooting time
Identify expensive, long-running, or failing queries with Query History logs
Understand current Snowflake spend with Cloud Cost Management (Preview)
Collect custom metrics from Snowflake directly from the integration tile
Conduct robust threat hunting with security logs and Cloud SIEM
See our documentation to get started and our blog posts for more information on using Datadog to monitor Snowflake and Snowpark.
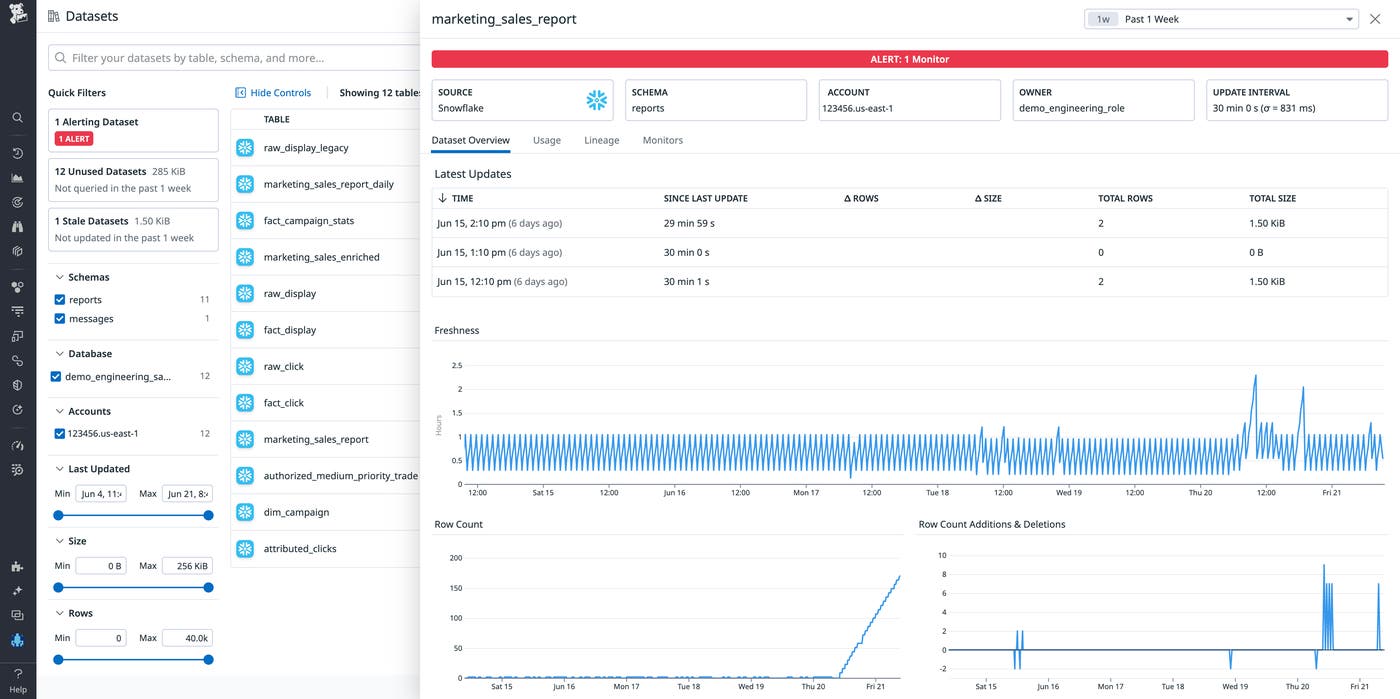
With the increasing focus on using data to create value and serve customers, it’s essential for teams to ensure that their data can be trusted and that insights extracted from it are accurate. To improve the quality of your business data in Snowflake and detect data issues before your stakeholders, Datadog now enables you to detect and alert on data freshness and volume issues, analyze table usage based on query history, and understand dependencies up- or downstream with table-level lineage. These capabilities enable you to maintain visibility into your data quality, whether you’re training LLMs or optimizing an ecommerce site based on trends in customer data. Customers who are interested in trying these capabilities can sign up for the Preview.
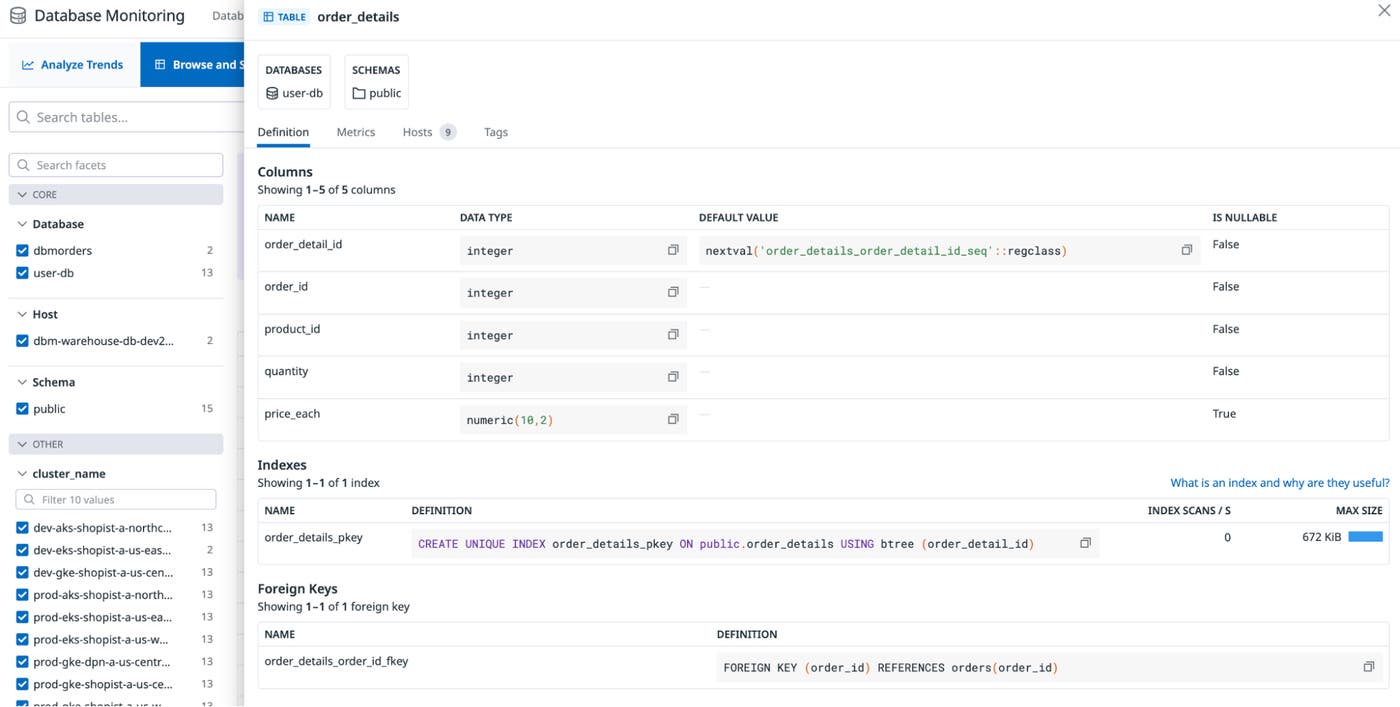
Having a data model that is understood by the developers who build the applications that query the data is key to application performance. But getting a view of schemas across a database fleet can be easier said than done, and in some cases is simply not possible if you don’t have database permissions, even though the schemas themselves are not sensitive data. Datadog Database Monitoring now collects and displays schema and table definitions, relations, and tuning recommendations across all of your PostgreSQL databases.
By providing centralized access to this information, users can independently and quickly reference available indexes and table relations in order to write efficient queries against the database. In addition to being able to explore and inspect this fleet-wide view of your database schemas, you can quickly identify which tables are growing the fastest, what data is accessed the most, where opportunities are for optimizing large indexes or instances with a high number of dead rows, and more. See our documentation to get started.
Datadog RUM Custom Vitals enables you to track frontend component performance based on real user activity. Rather than relying on complex timing calculations or custom actions, our Custom Vitals API makes it easy to collect durations based on real user interactions, component rendering events, and more. You can measure all of these with a single API and keep a close eye on the most important parts of your user journey. To learn more, please reach out to your dedicated Datadog representative.
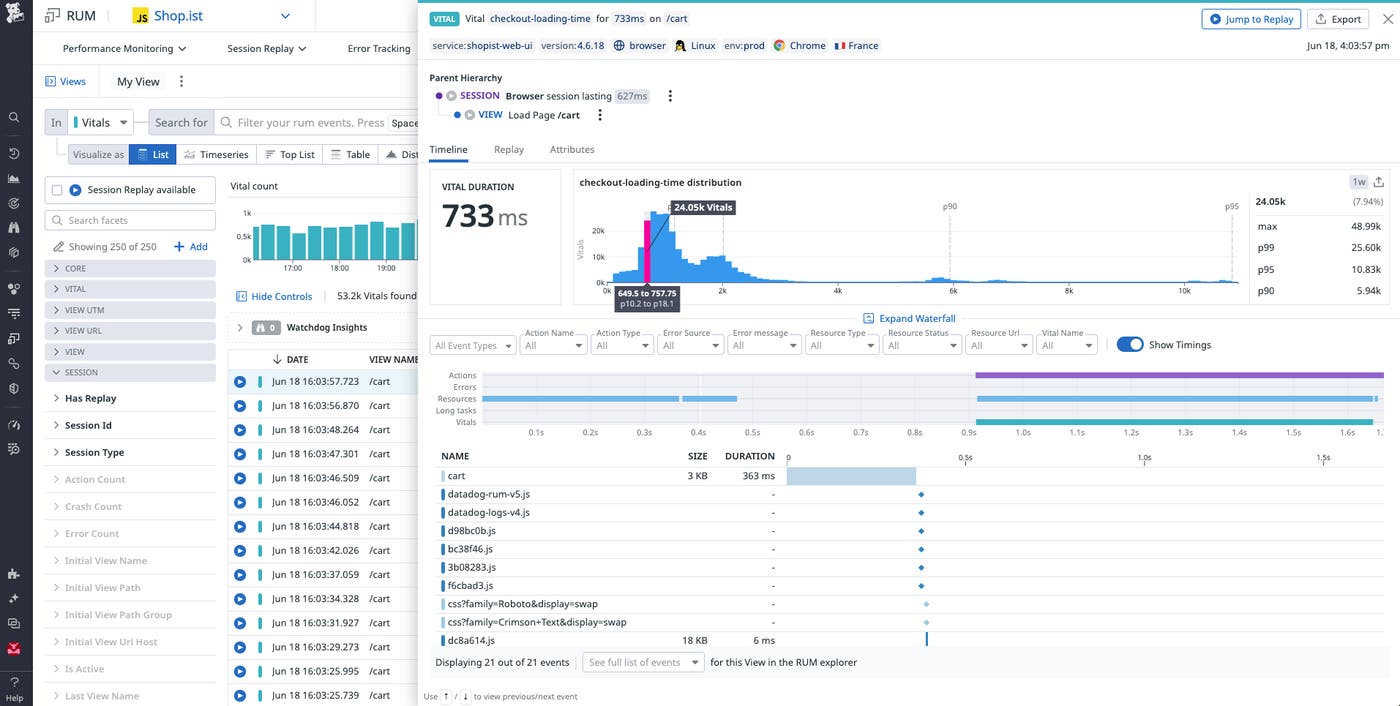
Datadog RUM gives you full visibility into problems that arise for real users and helps you resolve your browser performance issues. Without this context, it can be hard to diagnose and address the root cause of a slow page. RUM Performance Vitals uses this real traffic data to identify bottlenecks in your code, show you how users are affected across various user segments, and surface everything you need to know to troubleshoot your web performance metrics, including Core Web Vitals. Learn more in our documentation.
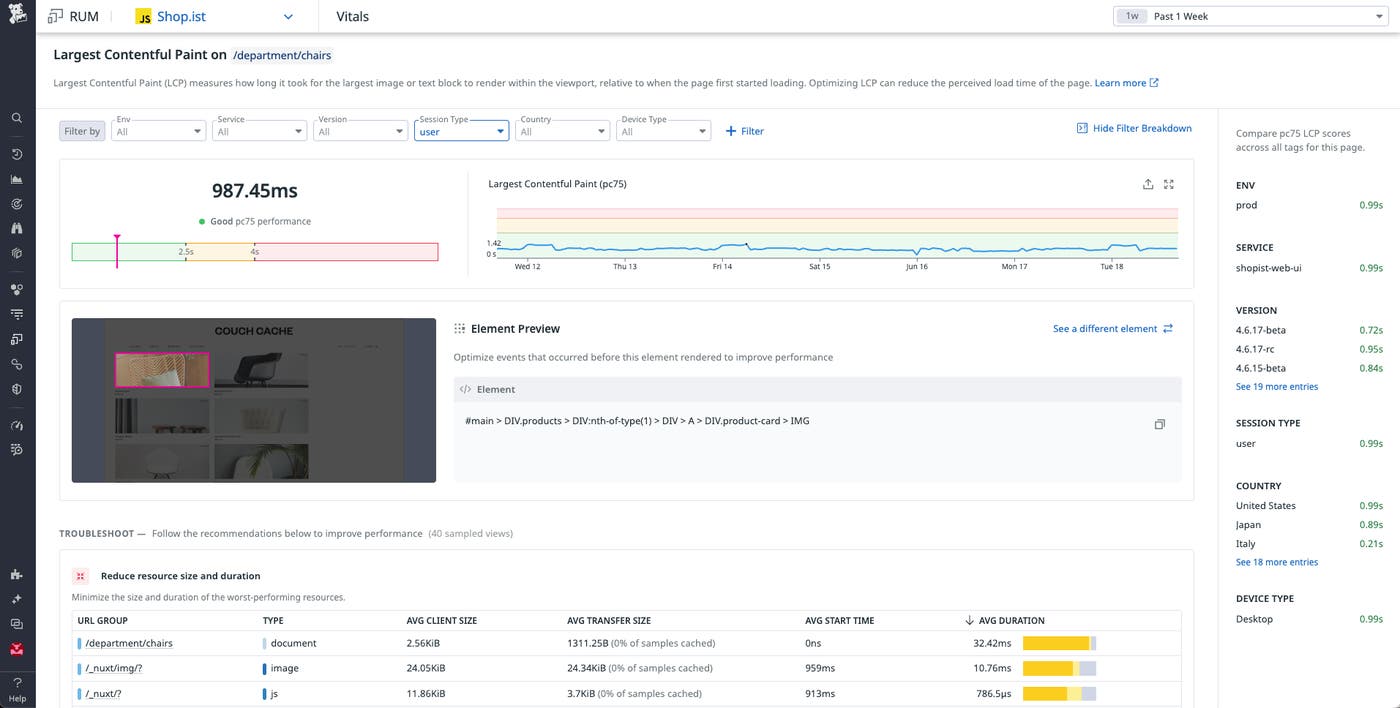
Sampling your RUM sessions enables you to more precisely collect the data you need from your frontend to maintain visibility into end-user experiences. But you don’t always know at the beginning of sessions whether they are going to offer a good user experience or not. Will the user experience errors or crashes, have network requests fail with 5xx status codes, or include pages with bad Core Web Vitals?
With the RUM tail-based sampler, frontend teams can now collect all user sessions with Datadog and dynamically decide—from Datadog’s UI and without redeploying their apps—which sessions to keep based on any events’ attributes, such as whether they experienced any errors or other performance degradations. This helps you stay within your observability budget while still having visibility into any poor end-user experiences.
To learn more and try this out, fill out this form.
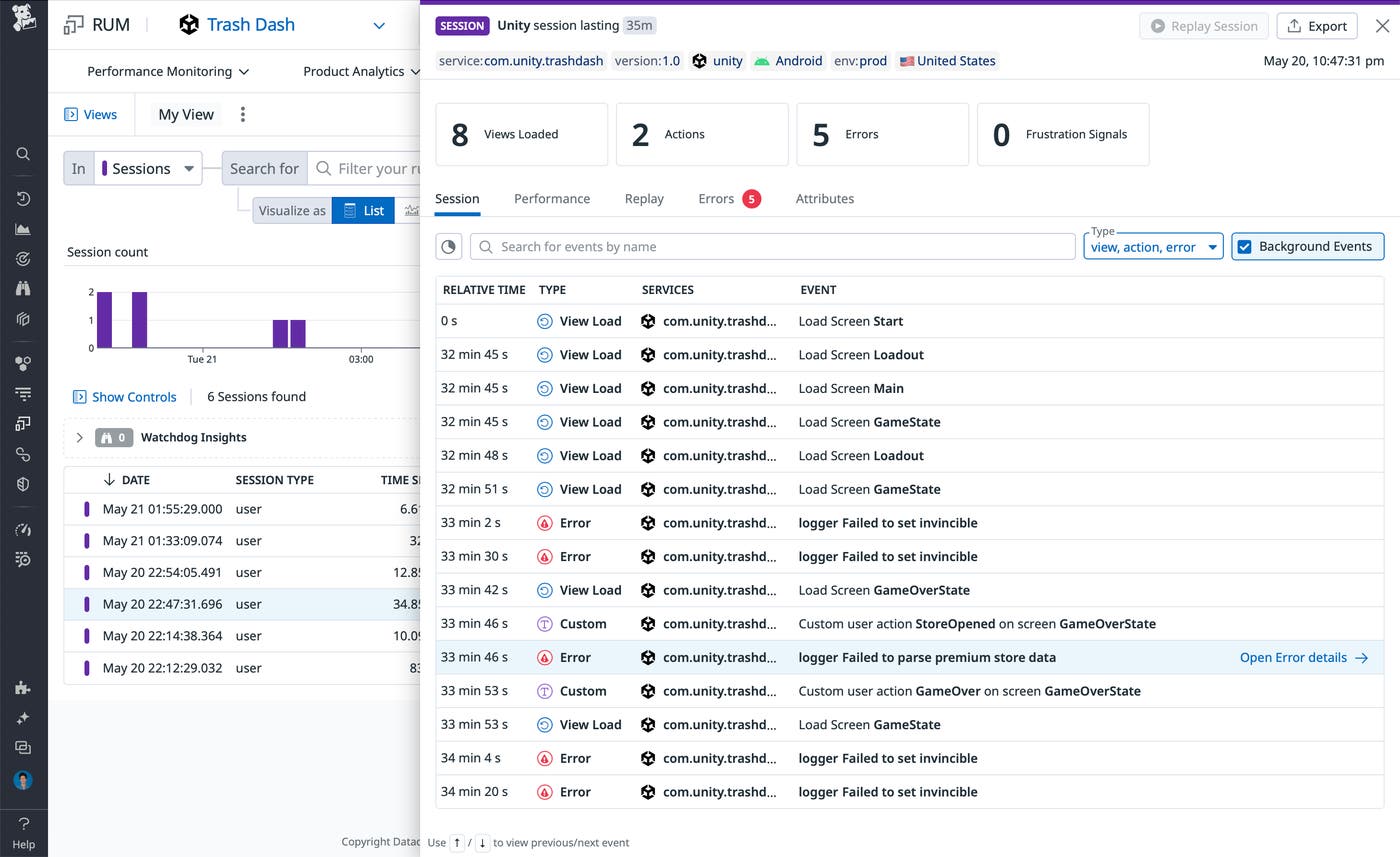
Datadog’s Unity SDK helps game developers get frontend visibility into their iOS and Android games built on Unity. Our SDK provides game and frontend developers key functionality for monitoring the performance of their games and troubleshooting problems:
Crash reporting: Datadog catches and reports crashes occurring at the native layer level (Android and iOS) and the game code level (C#).
Network data collection: Datadog supports UnityWebRequest calls and automatically reports network requests as RUM resources.
User behavior data collection: Datadog automatically tracks scenes as RUM views through SceneManager. There is also an API available to manually trigger additional RUM events including views, resources, actions, and errors.
Distributed tracing and logs: Collect and correlate distributed traces and logs alongside RUM data.
See our documentation to install our Unity SDK in your mobile game and enable its features.
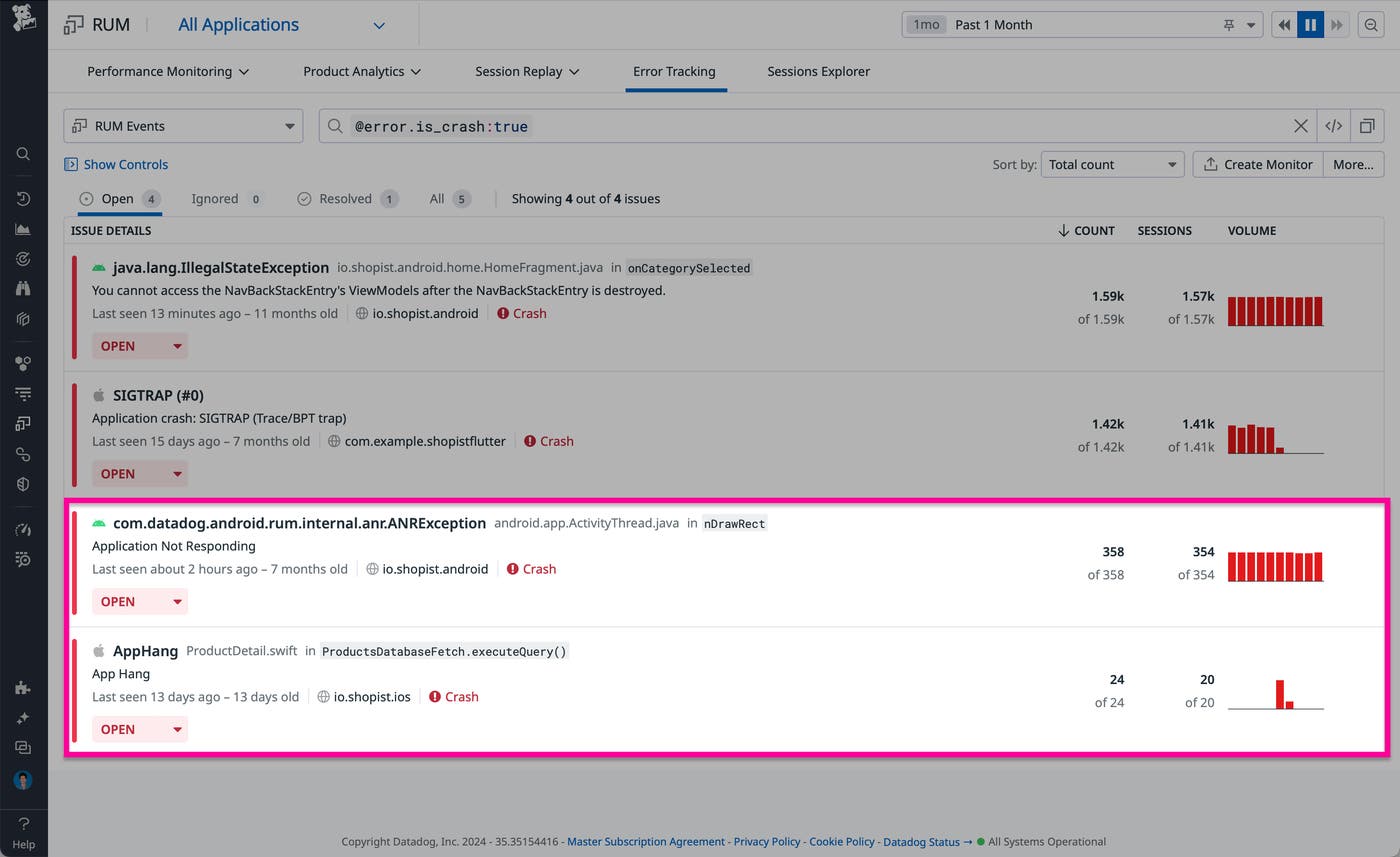
For mobile app developers, having full visibility into crashes is always top of mind. Effective crash reporting means tracking all the crashes occurring in their mobile application and grouping similar ones together to make it easier to triage and troubleshoot. Datadog now fully supports the reporting of app hangs on iOS, ANRs on Android, and crashes happening at startup on the native side for React Native applications, meaning that customers no longer need multiple solutions in parallel to report crashes happening in their mobile application. To help customers triage and troubleshoot these newly reported crashes and errors more efficiently, Datadog RUM and Error Tracking now have more comprehensive filters, readable stack traces, and actionable side panels.
To get started, set up Datadog RUM for your mobile application, enable crash reporting, and follow the docs for ANRs on Android, app hangs on iOS, and native startup crashes on React Native to report these types of errors in addition to any included by default in our crash reporting product.
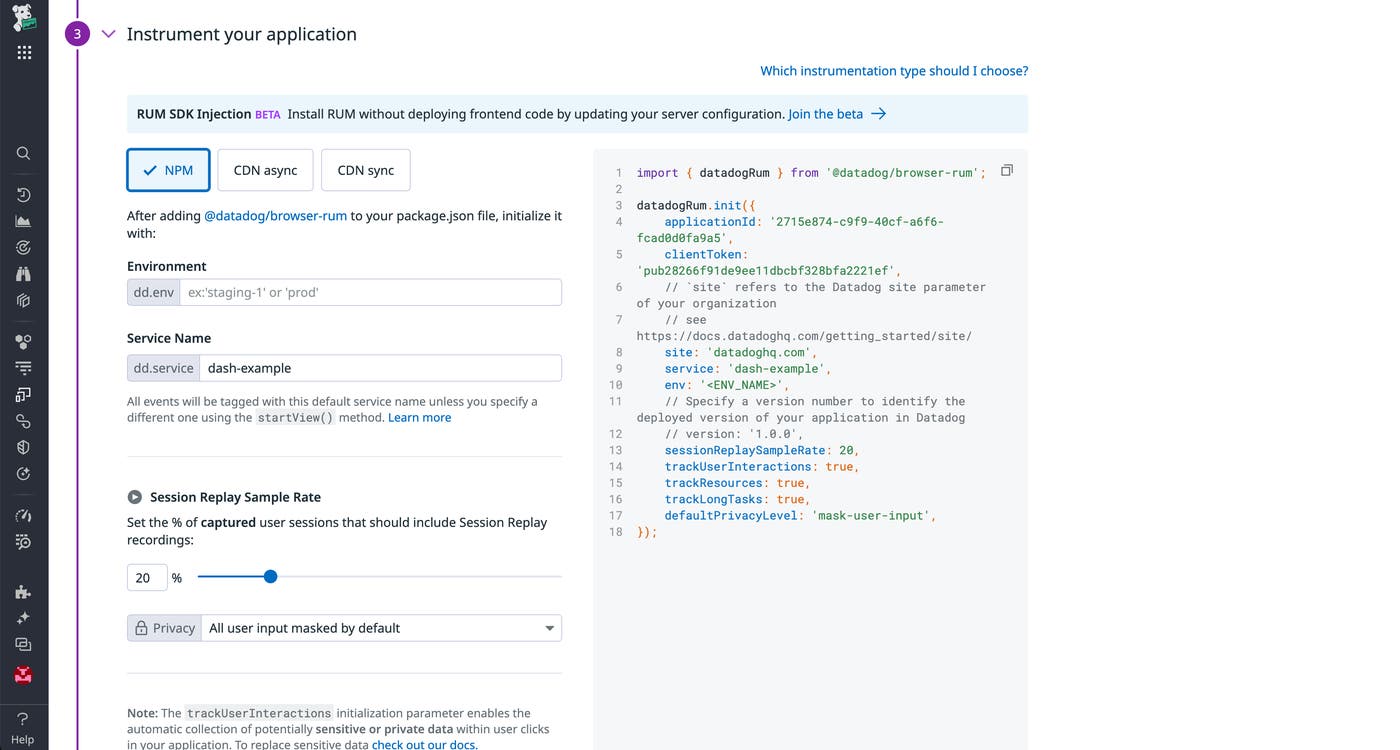
Automatically start collecting RUM data—including performance data, errors, and user activity for your application—by simply editing a configuration file on your server. RUM browser SDK injection, now in Preview, installs RUM by configuring your server to inject the SDK. To request access, please fill out this form.
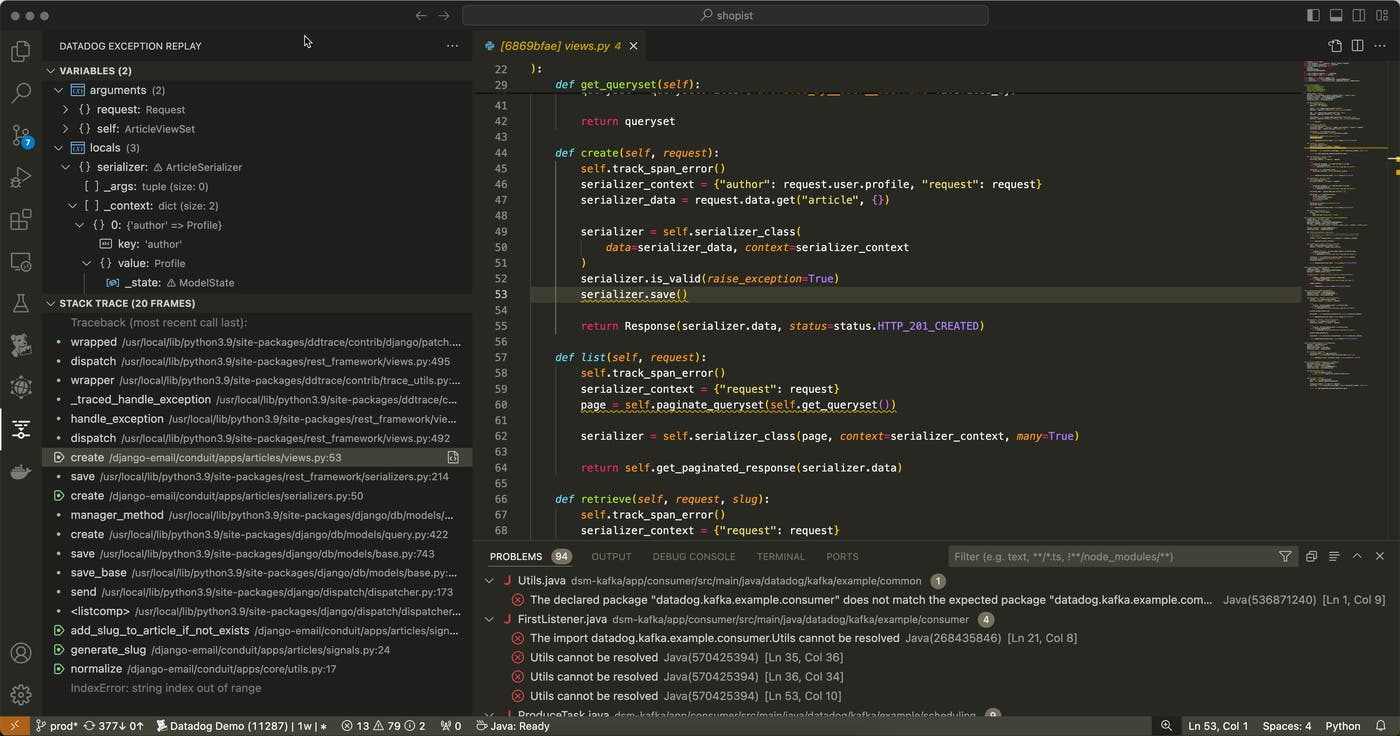
Debugging errors in production environments can often frustrate your team and disrupt your development cycle. We are excited to announce that Datadog Error Tracking’s Exception Replay is now available within Visual Studio Code, providing seamless and frictionless access to critical debugging data. With Exception Replay integrated directly into your IDE, once an error is detected, you can instantly identify the specific line of code or module responsible for the issue. This feature grants you access to the inputs and associated states that caused the errors, significantly reducing the time and effort required to reproduce them. Improve your problem-solving process with Exception Replay in Visual Studio Code.
此内容由惯性聚合(RSS阅读器)自动聚合整理,仅供阅读参考。 原文来自 — 版权归原作者所有。