


In Part 1 of this series, we looked at key metrics you should monitor to understand the performance of your CoreDNS servers. In this post, we’ll show you how to collect and visualize these metrics. We’ll also explore how CoreDNS logging works and show you how to collect CoreDNS logs to get even deeper visibility into your Deployment.
The CoreDNS prometheus plugin exposes metrics in the OpenMetrics format, a text-based standard that evolved from the Prometheus format. In a Kubernetes cluster, the plugin is enabled by default, so you can begin monitoring many key metrics as soon as you launch your cluster. In this section, we’ll look at a few different ways to collect and view CoreDNS metrics from your Kubernetes cluster.
/metrics endpointBy default, the prometheus plugin writes metrics to a /metrics endpoint on port 9153 on each CoreDNS pod. The command below shows how you can view a snapshot of your CoreDNS metrics by running a curl command from a container in your cluster. It combines a kubectl command that detects the IP address of a CoreDNS pod with a curl command that sends a request to the endpoint.
curl -X GET $(kubectl get pods -l k8s-app=kube-dns -n kube-system -o jsonpath='{.items[0].status.podIP}'):9153/metrics
The data returned by this request shows the values of metrics across several categories. Metrics whose names begin with coredns_dns_ reflect CoreDNS performance and activity, while metrics emitted by plugins start with coredns_ followed by the name of the plugin. Metrics with the go_ prefix describe the health and performance of the CoreDNS binary. The sample output below shows some metrics from these categories. It also identifies each metric’s OpenMetrics data type.
# HELP coredns_dns_request_duration_seconds Histogram of the time (in seconds) each request took per zone.
# TYPE coredns_dns_request_duration_seconds histogram
coredns_dns_request_duration_seconds_bucket{server="dns://:53",zone=".",le="0.0005"} 128
coredns_dns_request_duration_seconds_bucket{server="dns://:53",zone=".",le="0.001"} 169
coredns_dns_request_duration_seconds_bucket{server="dns://:53",zone=".",le="0.002"} 184 coredns_dns_request_duration_seconds_bucket{server="dns://:53",zone=".",le="0.004"} 233
coredns_dns_request_duration_seconds_bucket{server="dns://:53",zone=".",le="0.008"} 263
coredns_dns_request_duration_seconds_bucket{server="dns://:53",zone=".",le="0.016"} 266
coredns_dns_request_duration_seconds_bucket{server="dns://:53",zone=".",le="0.032"} 274
coredns_dns_request_duration_seconds_bucket{server="dns://:53",zone=".",le="0.064"} 278
coredns_dns_request_duration_seconds_bucket{server="dns://:53",zone=".",le="0.128"} 281
coredns_dns_request_duration_seconds_bucket{server="dns://:53",zone=".",le="0.256"} 281
coredns_dns_request_duration_seconds_bucket{server="dns://:53",zone=".",le="0.512"} 281
coredns_dns_request_duration_seconds_bucket{server="dns://:53",zone=".",le="1.024"} 281
coredns_dns_request_duration_seconds_bucket{server="dns://:53",zone=".",le="2.048"} 281
coredns_dns_request_duration_seconds_bucket{server="dns://:53",zone=".",le="4.096"} 281
coredns_dns_request_duration_seconds_bucket{server="dns://:53",zone=".",le="8.192"} 281
coredns_dns_request_duration_seconds_bucket{server="dns://:53",zone=".",le="+Inf"} 281
[...]
# HELP coredns_dns_responses_total Counter of response status codes.
# TYPE coredns_dns_responses_total counter
coredns_dns_responses_total{plugin="loadbalance",rcode="NOERROR",server="dns://:53",zone="."} 16
coredns_dns_responses_total{plugin="loadbalance",rcode="NXDOMAIN",server="dns://:53",zone="."} 33
[...]
# HELP go_gc_duration_seconds A summary of the pause duration of garbage collection cycles.
# TYPE go_gc_duration_seconds summary
go_gc_duration_seconds{quantile="0"} 2.2821e-05
go_gc_duration_seconds{quantile="0.25"} 4.7631e-05
go_gc_duration_seconds{quantile="0.5"} 9.5672e-05
go_gc_duration_seconds{quantile="0.75"} 0.00021126
go_gc_duration_seconds{quantile="1"} 0.000349871
go_gc_duration_seconds_sum 0.001290764
go_gc_duration_seconds_count 10
[...]
The first metric, coredns_dns_request_duration_seconds_bucket, takes the form of a histogram. Each line represents a bucket, or a collection of values less than or equal to the bucket’s boundary. For example, the first bucket has a boundary of 0.0005 seconds—expressed as le="0.0005"—and shows that of all the requests the server has processed since it was started, it processed 128 of them in 0.0005 seconds or less. The next line shows that it processed 169 requests in 0.001 seconds or less (including those in the first bucket).
The coredns_dns_responses_total metric is a simple counter of NOERROR and NXDOMAIN responses by the server.
The go_gc_duration_seconds metric is a summary which shows the distribution of the metric’s values across a set of quantiles. For example, 75 percent of garbage collection cycles were completed in less than 0.00021126 seconds.
The /metrics endpoint provides a quick look at the current state of your CoreDNS servers. To explore the history of your metrics, detect trends, and alert on metrics that warrant investigation, you can collect and store your metrics with a Prometheus server and visualize them using Grafana.
You can use a Prometheus server to automatically scrape your metrics endpoint and store the data in its timeseries database. Prometheus can easily consume CoreDNS metrics because they’re written in the OpenMetrics format.
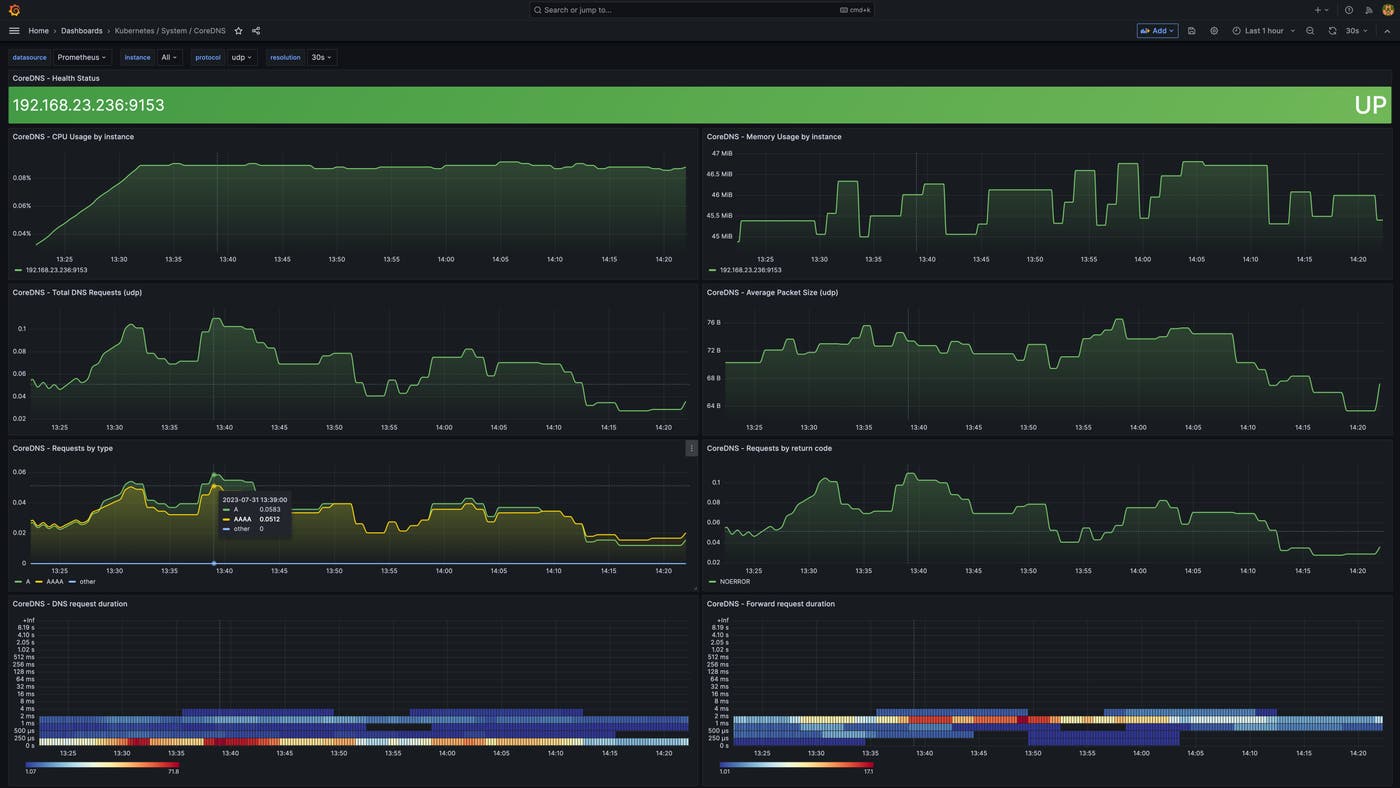
Grafana is a visualization tool that allows you to visualize and alert on data stored in your Prometheus server. Grafana provides an out-of-the-box dashboard for monitoring CoreDNS and others specifically for monitoring CoreDNS in Kubernetes. The screenshot below shows an example of a CoreDNS-specific dashboard in Grafana.
While metrics can help you evaluate the health and performance of your CoreDNS servers, logs provide additional visibility that you can leverage for troubleshooting and root cause analysis. CoreDNS sends logs to standard output so you can easily monitor several dimensions of CoreDNS activity, including query traffic, plugin activity, and CoreDNS status. In this section, we’ll show you how CoreDNS logging works and how you can collect CoreDNS logs.
Note: Query logging can have a significant impact on CoreDNS performance. We do not recommend using query logging in production.
The CoreDNS log and errors plugins allow you to log the DNS queries your applications send to CoreDNS, which can be valuable if you need to troubleshoot your CoreDNS service in a development or staging cluster. By default, the log plugin logs all queries, but that volume of logging can severely degrade the performance of your servers. You can mitigate this performance impact by using the plugin’s class directive to selectively log queries that result in a specific type of response, such success, denial, or error.
The log plugin generates INFO-level logs that share details about each DNS request and response. These logs include the record type requested (“A”, in the sample log below), the RCODE contained in the response (NOERROR), and the time CoreDNS took to process the request (just over 0.006 seconds).
[INFO] 10.244.0.6:54231 - 35114 "A IN www.datadoghq.com. udp 32 false 512" NOERROR qr,rd,ra 152 0.006133951s
The errors plugin collects additional query data, creating an ERROR-level log anytime CoreDNS responds with an error code such as SERVFAIL, NOTIMP, or REFUSED. This plugin will also log any queries that timed out before the CoreDNS server could respond (in which case the log plugin can’t provide an RCODE).
In the example below, the log plugin has logged a request for www.shopist.io. The errors plugin provides additional data that shows that the request failed when CoreDNS’s call to an upstream server timed out. The ERROR log also includes the address and port of the upstream server (192.0.2.2:53) that failed to respond.
[INFO] 10.244.0.5:54552 - 55296 "A IN www.shopist.io. udp 32 false 512" - - 0 2.001202276s
[ERROR] plugin/errors: 2 www.shopist.io. A: read udp 10.244.0.2:43794->192.0.2.2:53: i/o timeout
CoreDNS logs also contain messages emitted by plugins in the chain. Any plugin can write ERROR, WARNING, and INFO messages to standard output, and CoreDNS will automatically log those messages, prefixed with the name of the plugin that emitted them. Similarly, plugins can send DEBUG messages, but these will appear in the logs only if the debug plugin is enabled.
The sample below shows a WARNING-level log emitted by the file plugin and an error-level log emitted by the reload plugin.
[WARNING] plugin/file: Failed to open "open hosts.custom: no such file or directory": trying again in 1m0s
[ERROR] Restart failed: plugin/reload: interval value must be greater or equal to 2s
Logs can also help you understand changes in CoreDNS’s status—for example, when it applies changes to its configuration. The first and third logs below indicate that CoreDNS has reloaded its Corefile. The second message reports output from the reload plugin, which is responsible for reloading the Corefile after any revision.
[INFO] Reloading
[INFO] plugin/reload: Running configuration SHA512 = 629159aabe157402a788e709122fd3e4d7a6fdaf3ef94258e1994fe03782f252c05c7e12083665342a1672061f8ad00171ca4d1241a07bd9b3ee040502ad8087
[INFO] Reloading complete
CoreDNS sends all logs to standard output. Kubernetes native logging architecture provides limited capabilities to view logs from CoreDNS and other containers in your cluster. This means that you can use kubectl logs for ad-hoc log exploration and preliminary troubleshooting.
For more advanced log processing and analysis, you can collect logs from your Kubernetes cluster using a logging agent, a sidecar container, or logic within your application and forward them to the backend of your choice. In Part 3 of this series, we’ll show you how to explore and alert on your CoreDNS logs in Datadog.
In this post, we’ve shown you how CoreDNS metrics give you a detailed snapshot of your servers, and how you can collect CoreDNS logs to gain context for troubleshooting issues in your cluster. Datadog allows you to collect, visualize, and alert on metrics and logs from CoreDNS and more than 1,000 other technologies. In Part 3 of this series, we’ll show you how to collect, explore, and alert on your CoreDNS logs with Datadog.
此内容由惯性聚合(RSS阅读器)自动聚合整理,仅供阅读参考。 原文来自 — 版权归原作者所有。