


Candace Shamieh

Jonathan Lim

Merchrist Kiki

Zara Boddula
Alert storms occur when your monitoring platform generates excessive alerts simultaneously or in succession. Although numerous factors can cause an alert storm, microservices architectures are uniquely susceptible to them due to multiple service dependencies, potential failure points, and upstream and downstream service relationships. Not only will you receive an alert when one service experiences an issue, but you’ll also receive alerts from all other services attempting to communicate with the problem service. Alert storms cause confusion, delay incident response, and lead to alert fatigue. Successfully addressing and reducing the impact of alert storms ensures that critical issues aren’t overlooked, preventing service outages, minimizing downtime, and avoiding operational disruption.
Many organizations attempt to reduce alert storms by solely relying on threshold and anomaly alert configuration, manually muting and unmuting alerts, or adding other temporary mechanisms that are difficult to replicate at scale. A lasting solution must be scalable, easily maintained, and, when possible, automated. In this post, we’ll discuss how alert storms form and recommend the following five techniques to reduce alert storms in your microservices architecture:
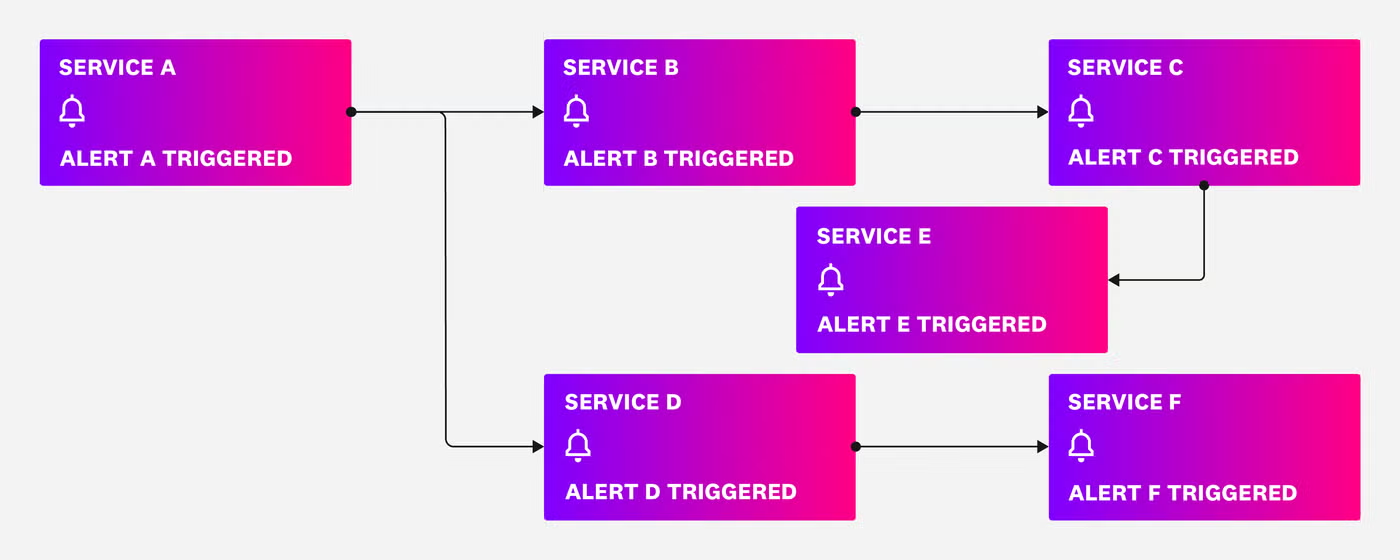
Alert storms can arise from a number of circumstances, including alert threshold misconfigurations and flappy alerts, which can be addressed by revisiting and adjusting your alert settings. However, architectures that contain many interdependent or upstream and downstream relationships require scalable techniques to reduce alert storms effectively. In these environments, every service will notify you any time one of them experiences a problem, resulting in a domino effect that creates an alert storm. For example, let’s say that your root service, Service A, is experiencing an emergent issue and you receive an alert that prompts you to investigate. If your monitoring system is not optimally configured, you’ll also receive a flood of unnecessary alerts from services B, C, D, E, and F, informing you that they cannot communicate with Service A. The services may repeatedly try to establish communication with Service A, potentially exacerbating the issue and triggering even more alerts.
If your monitoring system is configured optimally, an issue with Service A will still trigger an alert, but services B, C, D, E, and F would automatically mute all alerts that reference their lack of communication with Service A. The downstream services would also delay their attempts to reestablish communication until Service A’s issue is resolved.
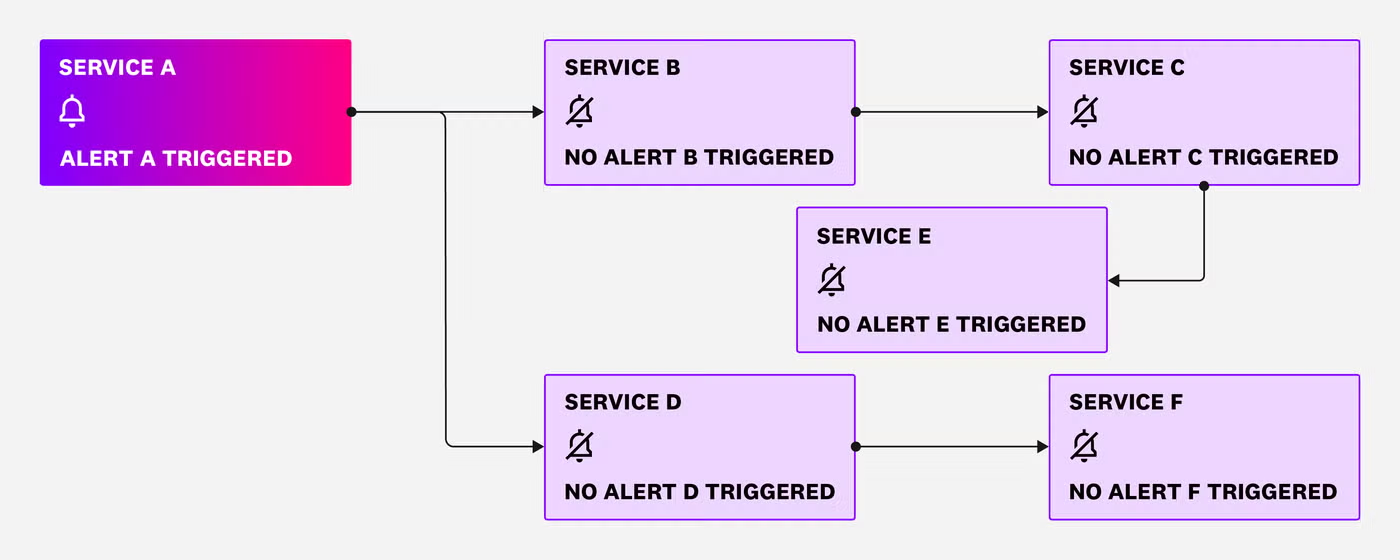
Once Service A is in recovery, services B, C, D, E, and F would automatically unmute all alerts that reference communication with Service A, so you will be promptly notified when an issue truly requires your attention. The services will also attempt to reestablish communication with Service A at staggered intervals instead of simultaneously.
Building a reliable alerting system that you trust completely requires a dedication to continuous improvement—an essential aspect of a solid software development methodology.
Whether your monitoring strategy is owned by your infrastructure, application, or operations teams, revisiting it periodically helps to strengthen effective monitoring practices and allows you to identify areas for improvement. Reviewing your monitoring strategy after a postmortem meeting, as a part of your QA process, or based on specifications enables you to implement scalable techniques that reduce alert storms.
Dependency maps are a prime starting point to help you understand all of the interactions happening in your environment. A dependency map will help you visualize the relationships between your components and services, enabling you to pinpoint where cascading failures can occur. Once aware of these interactions and failure points, you can prepare for potential incidents or, ideally, avoid them altogether.
Datadog Application Performance Monitoring (APM) includes end-to-end distributed tracing, helping you understand how data flows through different application components, track service interactions, and create a dependency map. APM customers automatically have access to Datadog’s Service Map, with no additional setup required. The Service Map provides you with a bird’s eye view of your services, the state of their health, and their dependencies in real time.
You can see precisely how requests propagate across your architecture, so you can identify potential bottlenecks and understand both upstream and downstream relationships. You can also leverage filtering capabilities to view a specific service, scope, environment, or other unique facet. Filtering is especially helpful in a microservices environment when you’re dealing with hundreds or thousands of nodes, and it also enables you to identify only the services involved in an ongoing or resolved incident.
When a service or network is unavailable, an immediate retry from another service is likely to fail and may exacerbate the issue. Instead, configure your services to use exponential backoff—pausing for a specified time period between retries and increasing the wait time when the connection attempts exceed a certain number. As a result, you’ll avoid overloading network bandwidth and triggering redundant alerts.
You can also introduce random or varied delay into each client’s retry interval to prevent multiple clients from retrying their requests simultaneously. Random or varied delay staggers retry attempts, increasing the likelihood of clients reestablishing a successful connection.
Aside from implementing exponential backoff, you can minimize alert storms through optimally configured service checks. Datadog service checks enable you to monitor service health and availability and allow you to specify how often you are notified of failed connection attempts. For example, you can configure your service check to only notify you after three consecutive failed attempts, as opposed to after a single failed attempt. You can set up monitors for your service checks that notify you immediately when critical, non-redundant services fail, and visualize your service checks in the Datadog UI via dashboards, the Check Summary page, and widgets.
You can schedule downtimes that suppress alerts during planned maintenance windows, or create them ad hoc when you experience unplanned outages to prevent alert storms. Scheduling downtimes for your Datadog monitors allows you to minimize the occurrence of unnecessary alerts and simultaneously notify partner teams that you are in the midst of maintenance, an update, a break-fix, or an unplanned outage.
With Datadog, you can create a fixed downtime schedule, choose which monitors you’d like to silence, view and manage lists of active and scheduled downtimes, and more. You can also automatically suppress the alerts of upstream or downstream services during your planned downtime with Datadog Workflow Automation. You can quickly get started using one of our 42 out-of-the-box blueprints or create your own custom workflow using logic operators, branching, conditions, iterations, and more. Workflow Automation contains over 600 distinct actions, helping you specify the steps you want a workflow to take and when to invoke it, so it will automatically trigger in response to your defined parameters.
Let’s say you’d like to use Workflow Automation to suppress alerts from downstream services whenever Service A experiences a planned downtime. Workflow Automation offers a Mute a Set of Monitors blueprint that allows you to mute alerts whenever certain conditions are met.
Using tags to filter by environment, service, or however else you’d like, you can select the downstream services and define logic to describe the conditions that need to be met in order for the workflow to execute. You can customize the workflow’s logic or build a workflow from a blueprint. Once the logic’s parameters are met, Workflow Automation will create ad-hoc downtimes, muting all alerts from downstream services that triggered as a result of Service A’s planned downtime. This directly prevents an alert storm, so your team can focus on Service A’s maintenance.
After you configure the Unmute a Set of Monitors blueprint, Datadog will recognize once Service A is in a recovery state and appropriately unmute the alerts.
Workflow Automation lists all active downtimes that were created as a result of the Mute a Set of Monitors blueprint and subsequently cancels the ad-hoc downtimes. This ensures that you’re properly notified if an unrelated or new issue arises between Service A and your downstream services.
Alert storms typically involve receiving a large number of very similar alert notifications. Aggregating alerts can reduce the flood while still providing the needed information.
Notification grouping collects similar alerts together based on certain fields and consolidates them, so you only receive one notification when an issue occurs. Whether you choose to group alerts by service, tag, environment, or another attribute, notification grouping enables you to reduce noise and focus on finding a resolution.
Event correlation allows you to handle and respond to related alerts as a single event, minimizing noise and streamlining incident response. Rather than dealing with related alerts as separate issues handled by different teams, which can result in duplicate efforts, event correlation ensures that alerts stemming from the same cause are treated as a single event. This enables response teams to address them wholly and effectively.
When configuring a monitor in Datadog, you can choose how your alerts are aggregated so that you can implement notification grouping by a specific dimension, like cluster, service, or host. By aggregating your alerts, you can configure monitors to alert you when an entire availability zone is at risk instead of every time an individual host in the availability zone is at risk. An individual host’s workload can automatically be supported by another host in the availability zone, so there is little risk because that workload is never affected. But if an availability zone is at risk of failure, you’d rightly want to receive a notification as early as possible. Datadog’s notification grouping capabilities ensure that you are only made aware of an issue when you actually need to intervene.
Datadog Event Management integrates AIOps into your monitoring strategy, automatically grouping related alerts into a single case based on pattern correlation. Event Management correlates alerts triggered as a result of the same incident, so you’re only notified once and can avoid alert storms. Each case allows you to view all correlated alerts, enabling you to understand the full impact of an incident. Event Management is also vendor-agnostic, consolidating alerts from both Datadog and your third-party tools so you can simplify your incident management process regardless of which monitoring platform you use.
To illustrate how Event Management works, let’s say an organization receives 4,000 alerts in thirty minutes due to a network configuration error. Event Management analyzes the alerts, consolidates them into a case, and sends one notification to the organization’s response team instead of 4,000 separate alerts. By correlating the alerts and rightfully treating them as a single incident, your response team can swiftly address the error and ensure your organization’s operations remain uninterrupted.
Automated remediation means having alerts trigger predefined action steps that resolve issues without the need for human intervention. For example, your monitoring system detects an unauthorized attempt to access a Remote Desktop Protocol (RDP) server and automatically instructs the firewall to block the offending IP addresses to prevent ransomware attacks. This single unauthorized attempt could have caused a flood of alerts from the interconnected services in your architecture, diverting your attention from the imminent threat of the ransomware attack. Automated remediation prevents alert storms through a proactive approach. It minimizes the risk of cascading failures through immediate response while also decreasing incident severity and mean time to resolution (MTTR).
Datadog Workflow Automation goes beyond just automated alert suppression as discussed above, providing you with the ability to automatically trigger remediation actions to resolve issues. Once an alert triggers, Datadog Workflow Automation can automatically remediate by performing actions across your tech stack, including in your AWS, Azure, or Google Cloud environment. For example, with the Restart Service via GitHub Actions blueprint, Workflow Automation will enact the process of restarting a service directly from GitHub when an alert is triggered, minimizing unplanned downtime while enhancing system reliability. Workflow Automation can also execute workflows that organize and coordinate your incident response, like creating Jira tasks or using Slack and PagerDuty to notify stakeholders on your behalf.
Alert storms can adversely impact your organization by delaying incident response, increasing the risk of service outages, diminishing performance, and causing alert fatigue. Implementing the proper techniques to prevent alert storms can enhance the reliability and resilience of your monitoring system while improving operational efficiency, reducing risk of unplanned outages, and enhancing user experience.
Datadog customers can get started today with monitors and fine-tune their alert response using the Service Map, Event Management, and Workflow Automation. If you’d like to learn more about Datadog Case Management, visit the documentation. Or, if you’re new to Datadog, sign up for a 14-day free trial.
此内容由惯性聚合(RSS阅读器)自动聚合整理,仅供阅读参考。 原文来自 — 版权归原作者所有。