








Editor’s note: php-fpm uses the term “master” to describe its primary process. Datadog does not use this term. Within this blog post, we will refer to this as “primary,” except for the sake of clarity in instances where we must reference a specific process name.
This post is part of a series on troubleshooting NGINX 502 Bad Gateway errors. If you’re not using PHP-FPM, check out our other article on troubleshooting NGINX 502s with Gunicorn as a backend.
PHP-FastCGI Process Manager (PHP-FPM) is a daemon for handling web server requests for PHP applications. In production, PHP-FPM is often deployed behind an NGINX web server. NGINX proxies web requests and passes them on to PHP-FPM worker processes that execute the PHP application.

NGINX will return a 502 Bad Gateway error if it can’t successfully proxy a request to PHP-FPM, or if PHP-FPM fails to respond. In this post, we’ll examine some common causes of 502 errors in the NGINX/PHP-FPM stack, and we’ll provide guidance on where you can find information that can help you resolve these errors.
In this section, we’ll describe how the following conditions can cause NGINX to return a 502 error:
PHP-FPM is not running
NGINX can’t communicate with PHP-FPM
PHP-FPM is timing out
If NGINX is unable to communicate with PHP-FPM for any of these reasons, it will respond with a 502 error, noting this in its access log (/var/log/nginx/access.log) as shown in this example:
127.0.0.1 - - [31/Jan/2020:18:30:55 +0000] "GET / HTTP/1.1" 502 182 "-" "curl/7.58.0"
NGINX’s access log doesn’t explain the cause of a 502 error, but you can consult its error log (/var/log/nginx/error.log) to learn more. For example, here is a corresponding entry in the NGINX error log that shows that the cause of the 502 error is that the socket doesn’t exist, possibly because PHP-FPM isn’t running. (In the next section, we’ll look at how to detect and correct this problem.)
2020/01/31 18:30:55 [crit] 13617#13617: *557 connect() to unix:/run/php/php7.2-fpm.sock failed (2: No such file or directory) while connecting to upstream, client: 127.0.0.1, server: localhost, request: "GET / HTTP/1.1", upstream: "fastcgi://unix:/run/php/php7.2-fpm.sock:", host: "localhost"
Note: This section includes a process name that uses the term “master.” Except when referring to specific processes, this article uses the term “primary” instead.
If PHP-FPM isn’t running, NGINX will return a 502 error for any request meant to reach the PHP application. If you’re seeing 502s, first check to confirm that PHP-FPM is running. For example, on a Linux host, you can use a ps command like this one to look for running PHP-FPM processes:
PHP-FPM organizes its worker processes in groups called pools. The sample output below shows that the PHP-FPM primary process is running, as are two worker processes in the default pool (named www):
root 29852 0.0 2.2 435484 22396 ? Ssl 16:27 0:00 php-fpm: master process (/etc/php/7.2/fpm/php-fpm.conf)
www-data 29873 0.0 1.5 438112 15220 ? Sl 16:27 0:00 php-fpm: pool www
www-data 29874 0.0 1.6 438112 16976 ? Sl 16:27 0:00 php-fpm: pool www
If the output of the ps command doesn’t show any PHP-FPM primary or pool processes, you’ll need to get PHP-FPM running to resolve the 502 errors.
In a production environment, you should consider using systemd to run PHP-FPM as a service. This can make your PHP application more reliable and scalable, since the PHP-FPM daemon will automatically start serving your PHP app when your server starts or when a new instance launches. PHP-FPM is included in the PHP source code, so you can add PHP-FPM as a systemd service when you configure PHP.
Once your PHP-FPM project is configured as a service, you can use the following command to ensure that it starts automatically when your server starts up:
sudo systemctl enable php7.2-fpm.service
Then you can use the list-unit-files command to see information about your service:
sudo systemctl list-unit-files | grep -E 'php[^fpm]*fpm'
On a PHP 7.2 server that has PHP-FPM installed (even if it is not running), the output of this command will be:
php7.2-fpm.service enabled
To see information about your PHP-FPM service, use this command:
sudo systemctl is-active php7.2-fpm.service
This command should return an output of active. If it doesn’t, you can start the service with:
sudo service php7.2-fpm start
When PHP-FPM starts, it creates one or more TCP or Unix sockets to communicate with the NGINX web server. PHP-FPM’s worker processes use these sockets to listen for requests from NGINX.
To determine whether a 502 error was caused by a socket misconfiguration, confirm that PHP-FPM and NGINX are configured to use the same socket. PHP-FPM uses a separate configuration file for each worker process pool; these files are located at /etc/php/7.2/fpm/pool.d/. Each pool’s socket is defined in a listen directive in the pool’s configuration file. For example, the listen directive below configures a pool named mypool to use a Unix socket located at /run/php/mypool.sock:
listen = /run/php/mypool.sock
If NGINX can’t access the socket for a particular pool, you can determine which worker pool is involved in the issue by checking which socket is named in the NGINX error log entry. For example, if PHP-FPM had failed to start the mypool worker pool, NGINX would return a 502 and its error log entry would include:
connect() to unix:/run/php/mypool.sock failed (2: No such file or directory)
Check your nginx.conf file to ensure that the relevant location block specifies the same socket. The example below contains an include directive that loads some general configuration information for PHP-FPM, and a fastcgi_pass directive that specifies the same Unix socket named in the mypool.conf file, above.
location / {
include snippets/fastcgi-php.conf;
fastcgi_pass unix:/run/php/mypool.sock;
}
Unix sockets are subject to Unix file system permissions. The PHP-FPM pool’s configuration file specifies the mode and ownership of the socket, as shown here:
listen.owner = www-data
listen.group = www-data
listen.mode = 0660
Make sure these permissions allow the user and group running NGINX to access the socket. If the permissions on the socket are incorrect, NGINX will log a 502 error in its access log, and a message like the one shown below in its error log:
2020/02/20 17:12:03 [crit] 3059#3059: *4 connect() to unix:/run/php/mypool.sock failed (13: Permission denied) while connecting to upstream, client: 127.0.0.1, server: localhost, request: "GET / HTTP/1.1", upstream: "fastcgi://unix:/run/php/mypool.sock:", host: "localhost"
Note that the default values of listen.owner and listen.group match the default owner and group running NGINX, and listen.mode defaults to 0660. Using these defaults, NGINX should be able to access the socket.
If PHP-FPM is listening on a TCP socket, the pool conifguration’s listen directive will have a value in the form of address:port, as shown below:
Just as with a Unix socket, you can prevent 502 errors by confirming that the location of this socket matches the one specified in the NGINX configuration.
If your application is taking too long to respond, your users will experience a timeout error. If PHP-FPM’s timeout—which is set in the pool configuration’s request_terminate_timeout directive (and defaults to 20 seconds)—is less than NGINX’s timeout (which defaults to 60 seconds), NGINX will respond with a 502 error. The NGINX error log shown below indicates that its upstream process—which is PHP-FPM—closed the connection before sending a valid response. In other words, this is the error log we see when PHP-FPM times out:
2020/02/20 17:17:12 [error] 3059#3059: *29 recv() failed (104: Connection reset by peer) while reading response header from upstream, client: 127.0.0.1, server: localhost, request: "GET / HTTP/1.1", upstream: "fastcgi://unix:/run/php/mypool.sock:", host: "localhost"
In this case, the PHP-FPM log (which by default is located at /var/log/php7.2-fpm.log) shows a correlated message which provides further information:
[20-Feb-2020 17:17:12] WARNING: [pool mypool] child 2120, script '/var/www/html/index.php' (request: "GET /index.php") execution timed out (25.755070 sec), terminating
You can raise PHP-FPM’s timeout setting by editing the pool’s configuration file, but this could cause another issue: NGINX may time out before receiving a response from PHP-FPM. The default NGINX timeout is 60 seconds; if you’ve raised your PHP-FPM timeout above 60 seconds, NGINX will return a 504 Gateway Timeout error if your PHP application hasn’t responded in time. You can prevent this by also raising your NGINX timeout. In the example below, we’ve raised the timeout value to 90 seconds by adding the fastcgi_read_timeout item to the http block of /etc/nginx/nginx.conf:
http {
...
fastcgi_buffers 8 16k;
fastcgi_buffer_size 32k;
fastcgi_connect_timeout 90;
fastcgi_send_timeout 90;
fastcgi_read_timeout 90;
}
Reload your NGINX configuration to apply this change:
Next, to determine why PHP-FPM timed out, you can collect logs and application performance monitoring (APM) data that can reveal causes of latency within and outside your application.
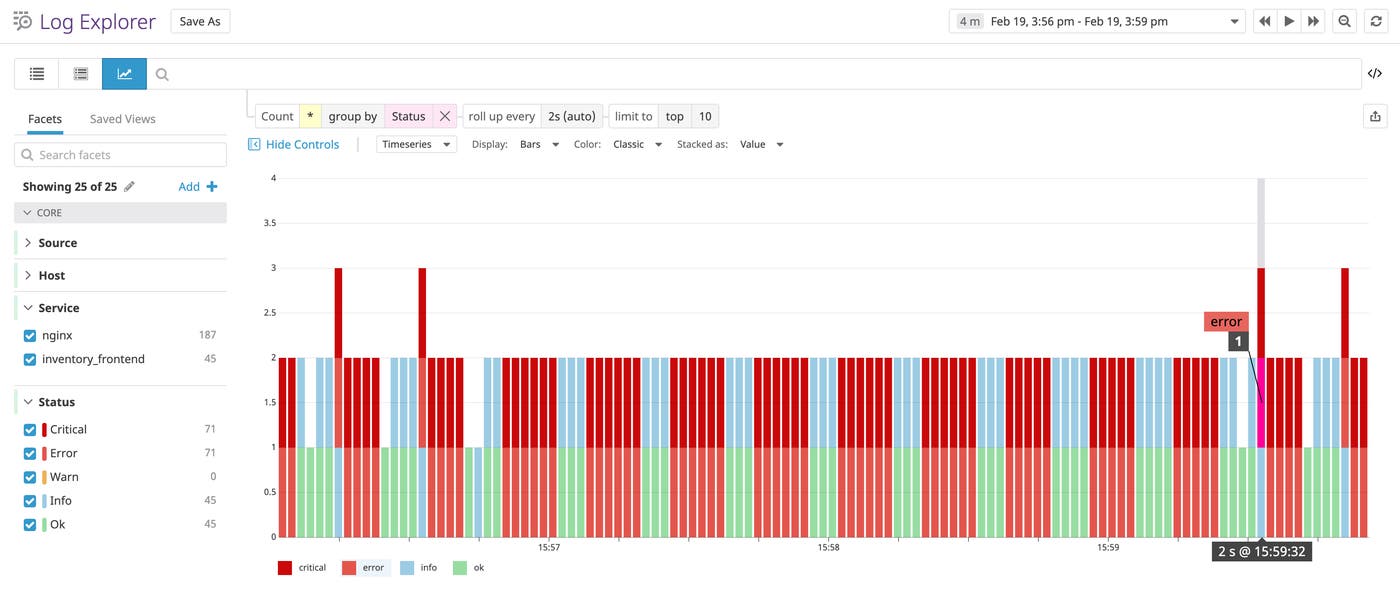
To troubleshoot application errors, you can collect your logs and send them to a log management service. In addition to the NGINX logs we examined above, PHP can log errors and other events that might be valuable to you. See our PHP logging guide for more information.
When you bring your PHP and NGINX logs into a log management service, combined with logs from relevant technologies like caching servers and databases, you can analyze logs from throughout your web stack in a single platform.
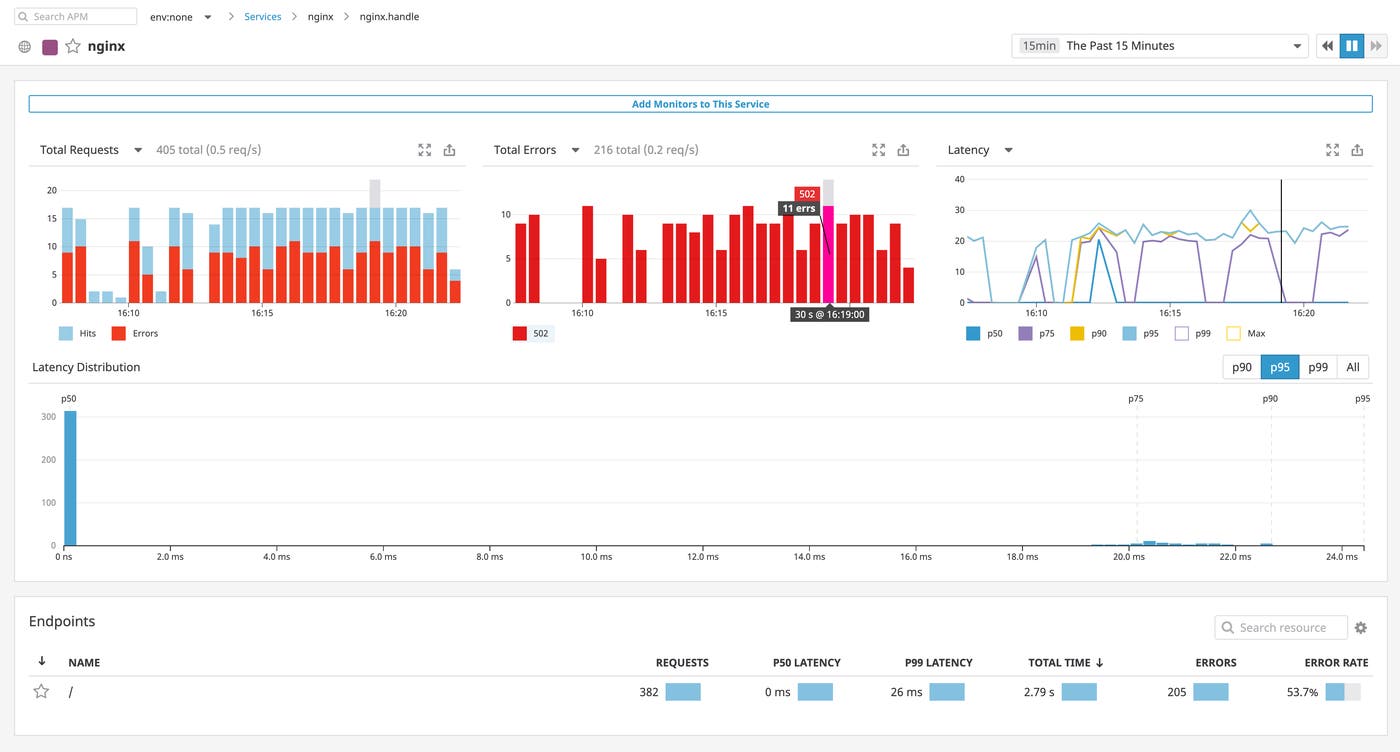
APM can help you identify bottlenecks and resolve issues, like 502 errors, which affect the performance of your app. The screenshot below shows NGINX’s APM data visualized in Datadog. This view summarizes request volume, error rates, and latency for an NGINX-based service and helps you investigate performance problems like 502 errors.
The faster you can diagnose and resolve your application’s 502 errors, the better. Datadog allows you to analyze metrics, traces, logs, and network performance data from across your infrastructure. If you’re already a Datadog customer, you can start monitoring NGINX, PHP-FPM, and more than 1,000 other technologies. If you don’t yet have a Datadog account, sign up for a 14-day free trial and get started in minutes.
此内容由惯性聚合(RSS阅读器)自动聚合整理,仅供阅读参考。 原文来自 — 版权归原作者所有。