


This post is part 1 of a 3-part series on Varnish monitoring. Part 2 is about collecting Varnish metrics, and Part 3 is for readers who use both Datadog and Varnish.
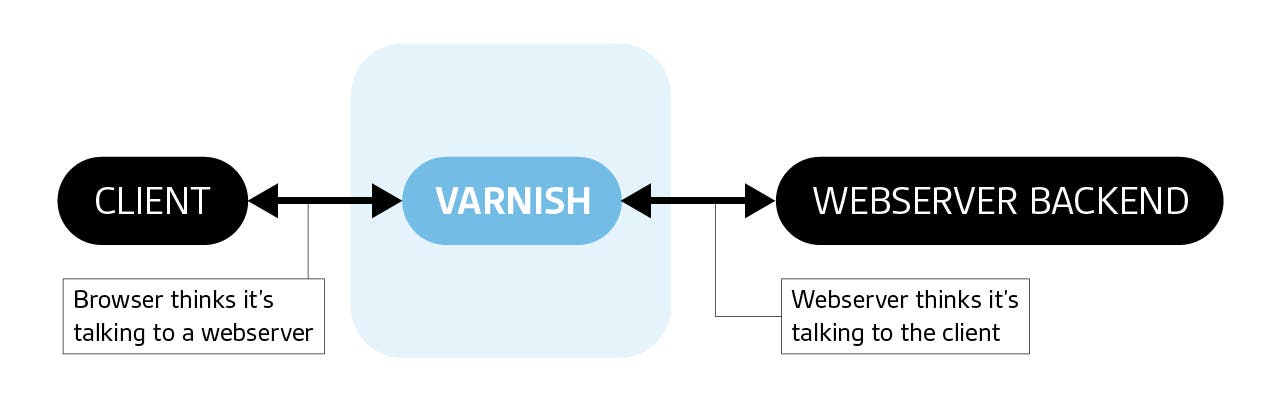
Varnish Cache is a web application accelerator designed specifically for content-rich, dynamic websites and heavily-used APIs. The strategy it uses for acceleration is known as a “caching HTTP reverse proxying”. Let’s unpack these terms.
As a reverse proxy, Varnish is server-side, as opposed as a client-side forward proxy. It acts as an invisible conduit between a client and a backend, intermediating all communications between the two. As a cache, it stores often-used assets (such as files, images, css) for faster retrieval and response without hitting the backend. Unlike other caching reverse proxies, which may support FTP, SMTP, or other network protocols, Varnish is exclusively focused on HTTP. As a caching HTTP proxy, Varnish also differs from browser-based HTTP proxies in that it can cache reusable assets between different clients, and cached objects can be invalidated everywhere simultaneously.
Varnish is a mature technology, and is in use at many high-traffic websites such as The New York Times, Wikipedia, Tumblr, Twitter, Vimeo, and Facebook.
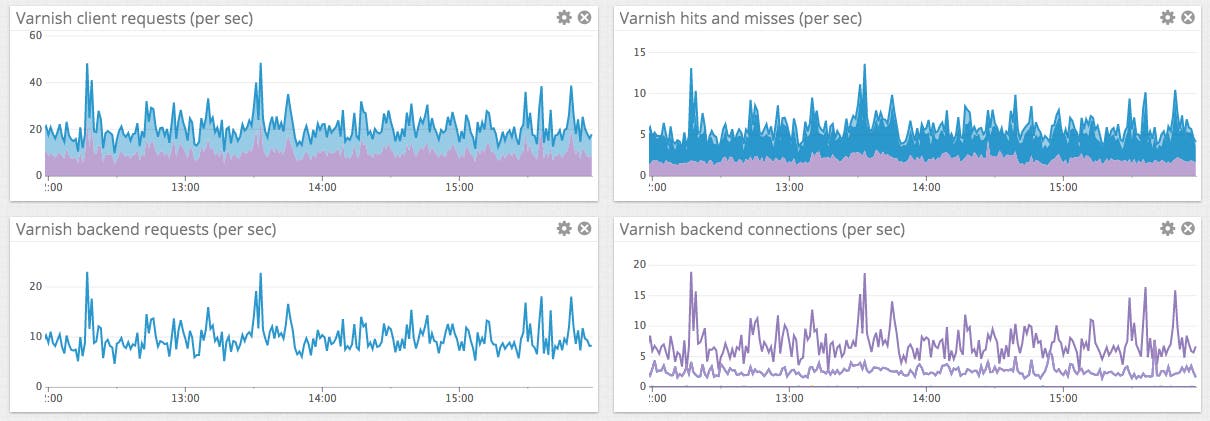
When running well, Varnish Cache can speed up information delivery by a factor of several hundred. However, if Varnish is not tuned and working properly, it can slow down or even halt responses from your website. The best way to ensure the proper operation and performance of Varnish is by monitoring its key performance metrics in the following areas:
Client metrics: client connections and requests
Cache performance: cache hits, evictions
Thread metrics: thread creation, failures, queues
Backend metrics: success, failure, and health of backend connections
This article references metric terminology introduced in our Monitoring 101 series, which provides a framework for metric collection and alerting.
NOTE: All the metrics discussed here can be collected from the varnishstat command line, and use the metric names from the latest version, Varnish 4.0.
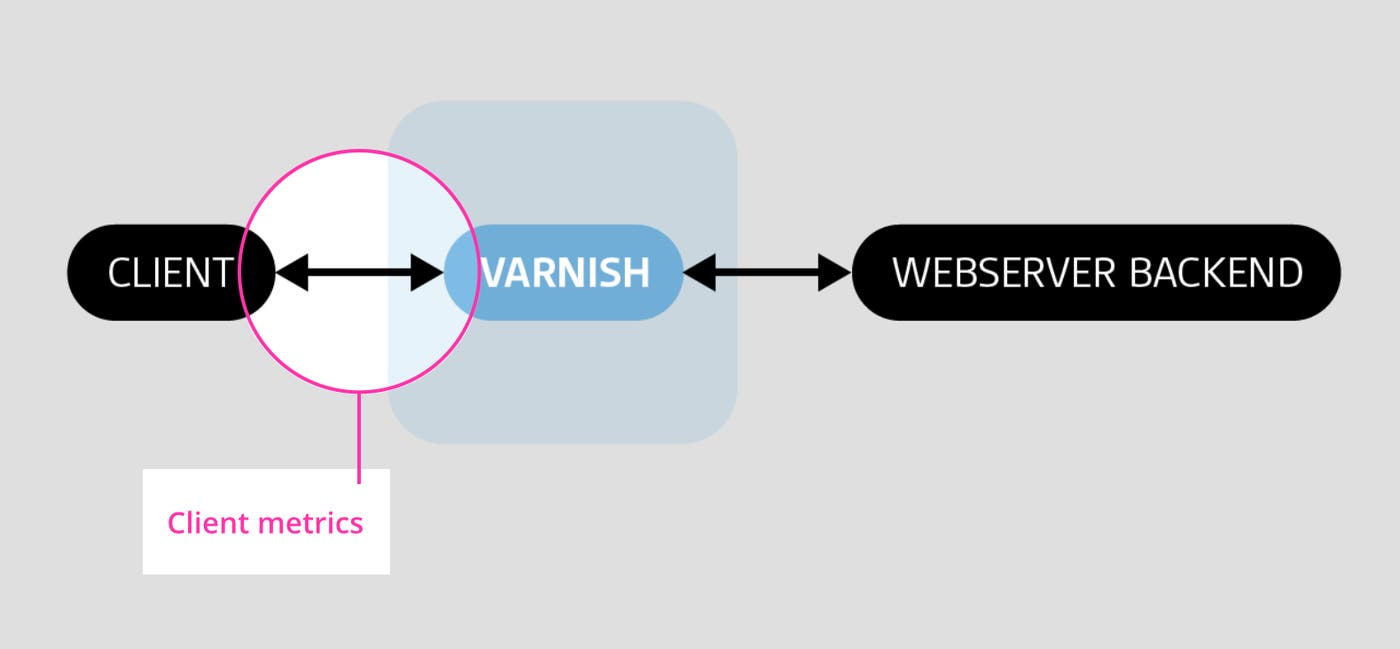
Client metrics measure volume and success of client connections and requests. Below we discuss some of the most important.
| Name | Description | Metric type |
|---|---|---|
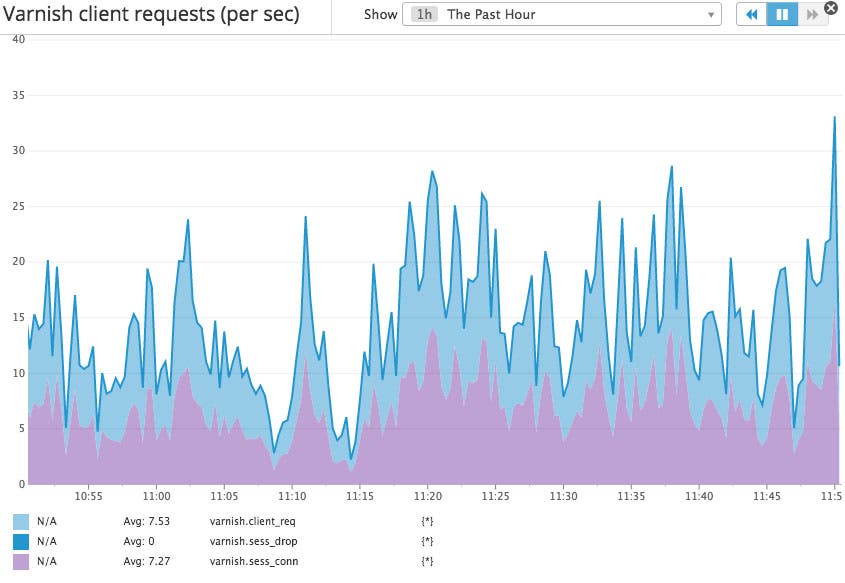
| sess_conn | Cumulative number of accepted client connections by Varnish Cache | Resource: Utilization |
| client_req | Cumulative number of received client requests. Increments after a request is received, but before Varnish responds | Work: Throughput |
| sess_dropped | Number of connections dropped due to a full queue | Work: Error (due to resource saturation) |
Once a connection is established, the client can use that connection to make several requests to access resources such as images, files, CSS, or Javascript. Varnish can service the requests itself if the requested assets are already cached, or can fetch the resources from the backend.
client_req: Regularly sampling the number of requests per second allows you to calculate the number of requests you’re receiving per unit of time—typically minutes or seconds. Monitoring this metric can alert you to spikes in incoming web traffic, whether legitimate or nefarious, or sudden drops, which are usually indicative of problems. A drastic change in requests per second can alert you to problems brewing somewhere in your environment, even if it cannot immediately identify the cause of those problems. Note that all requests are counted the same, regardless of their URLs.
sess_dropped: Once Varnish is out of worker threads, each new request is queued up and sess_queued is incremented. When this queue fills up, additional incoming requests will simply be dropped without being answered by Varnish and sess_dropped will be incremented. If this metric is not equal to zero, then either Varnish is overloaded, or the thread pool is too small in which case you should try gradually increasing thread_pool_max and see if it fixes the issue without causing higher latency or other problems.
Note that, for historical reasons, there is a sess_drop metric present in Varnish which is not the same as sess_dropped, discussed above. In new versions of Varnish, sess_drop is never incremented so it does not need to be monitored.
Varnish is a cache, so by measuring cache performance you can see instantly how well Varnish is doing its work.
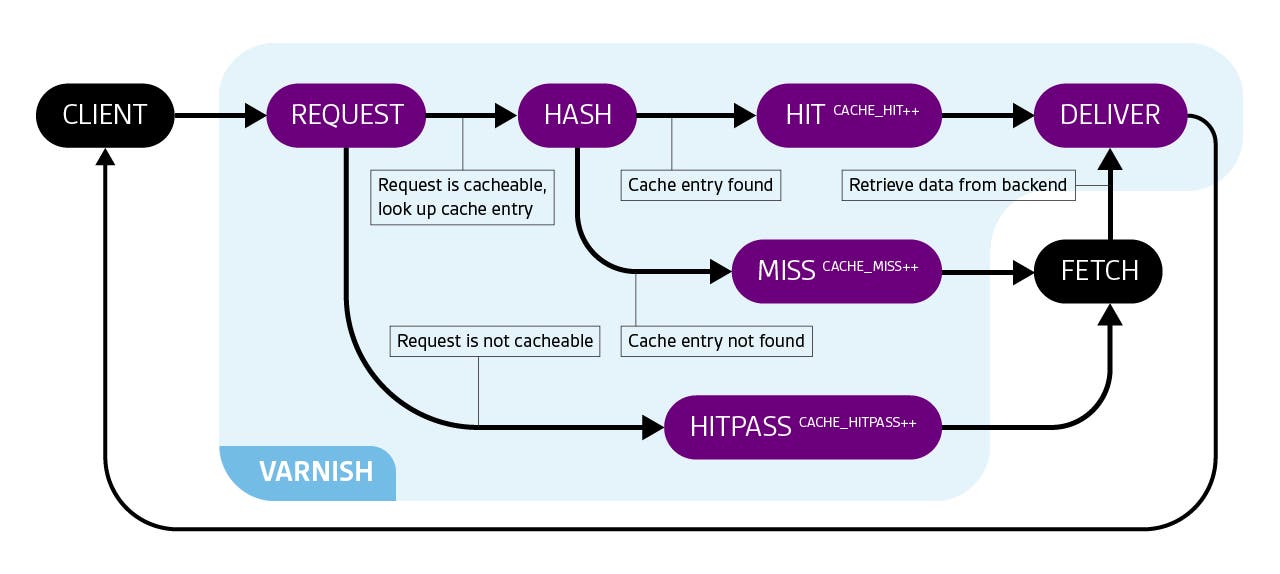
The diagram below illustrates how Varnish routes requests, and when each of its cache hit metrics is incremented.
| Name | Description | Metric type |
|---|---|---|
| cache_hit | Cumulative number of times a file was served from Varnish’s cache | Other |
| cache_miss | Cumulative number of times a file was requested but was not in the cache, and was therefore requested from the backend | Other |
| cache_hitpass | Cumulative number of hits for a “pass” file | Other |
Some objects cannot be cached. When one of them is requested for the first time, the response is served by the backend and cache_hitpass is incremented. This “uncachable” object is recorded so that subsequent requests for it go directly to “pass” without being counted as misses.
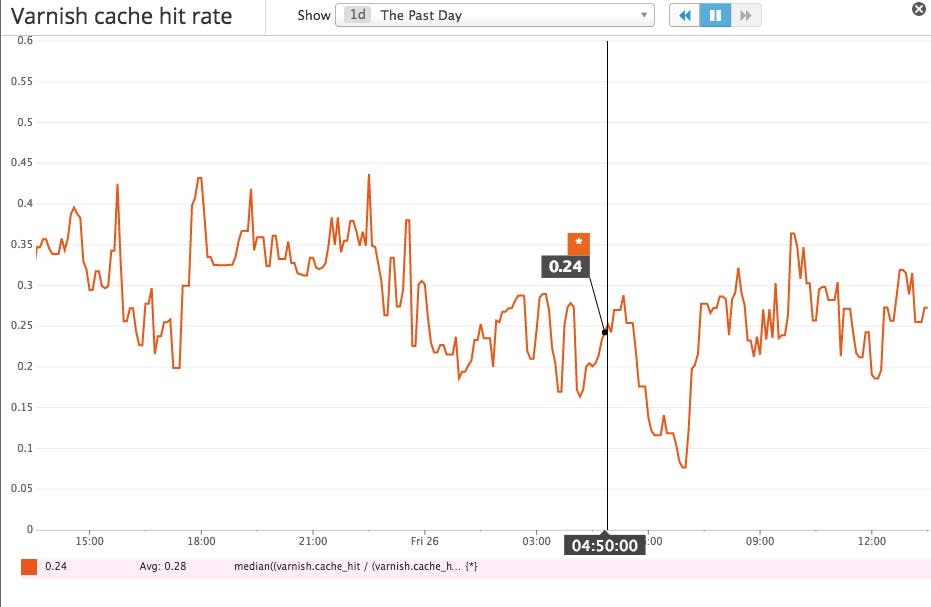
The cache hit rate is the ratio of cache hits to total cache lookups: cache_hit / (cache_hit + cache_miss). This derived metric provides visibility into the effectiveness of the cache. The higher the ratio, the better. If the hit rate is consistently high, above 0.7 (70 percent) for instance, then the majority of requests are successfully expedited through caching. If the cache is not answering a sufficient percentage of the read requests, consider increasing its memory, which can be a low-overhead tactic for improving read latency.
If after increasing the amount of memory available to your cache, your hit rate is still too low, you might also want to look at which objects are not being cached and why. For this you’ll need to use Varnishlog and then optimize your VCL (Varnish Configuration Language) tuning to improve the hit/miss ratio.
| Name | Description | Metric type |
|---|---|---|
| n_expired | Cumulative number of expired objects for example due to TTL | Other |
| nlrunuked | Least Recently Used Nuked Objects: Cumulative number of cached objects that Varnish has evicted from the cache because of a lack of space | Resource: Saturation |
The LRU (Least Recently Used) Nuked Objects counter, n_lru_nuked, should be closely watched. If the eviction rate is increasing, that means your cache is evicting objects faster and faster due to a lack of space. In this case you may want to consider increasing the cache size.
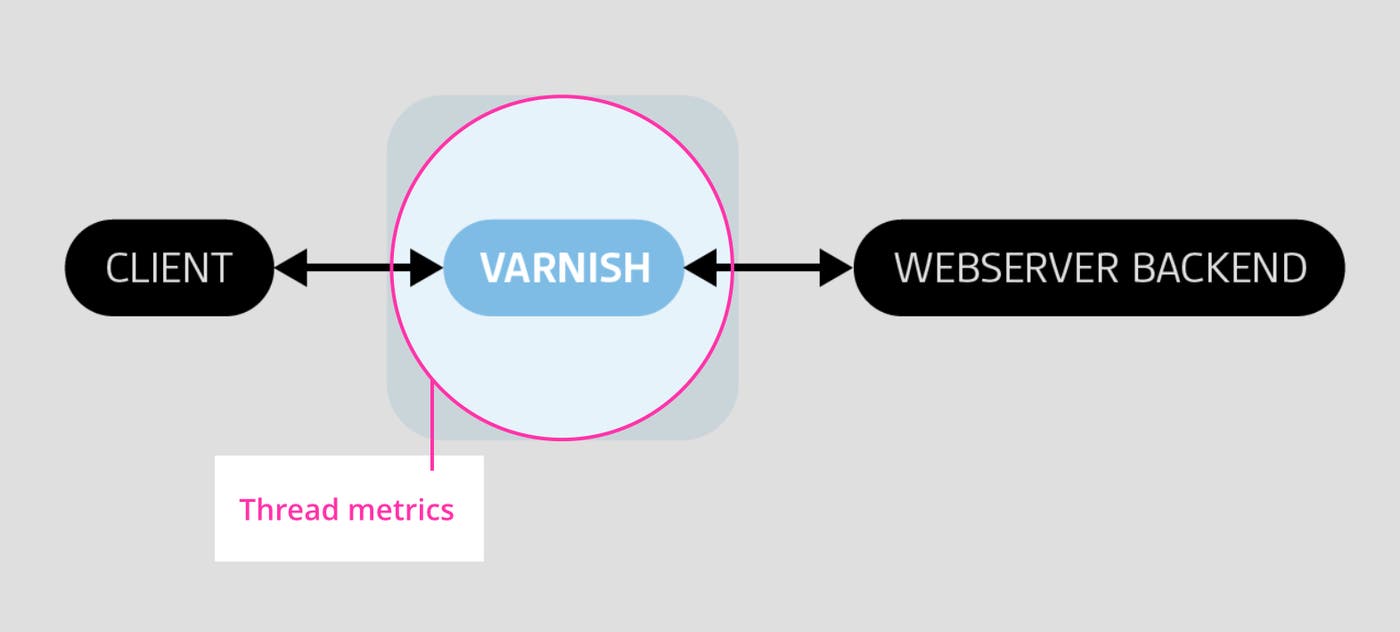
Metrics related to worker threads tell you if your thread pools are healthy and functioning well.
| Name | Description | Metric type |
|---|---|---|
| threads | Number of threads in all pools | Resource: Utilization |
| threads_created | Number of times a thread has been created | Resource: Utilization |
| threads_failed | Number of times that Varnish unsuccessfully tried to create a thread | Resource: Error |
| threads_limited | Number of times a thread needed to be created but couldn’t because varnishd maxed out its configured capacity for new threads | Resource: Error |
| threadqueuelen | Current queue length: number of requests waiting on worker thread to become available | Resource: Saturation |
| sess_queued | Number of times Varnish has been out of threads and had to queue up a request | Resource: Saturation |
Keep an eye on the metric thread_queue_len which should not be too high. If it’s not equal to zero, that means Varnish is saturated and responses are slowed.
These metrics should always be equal to 0:
threads_failed: otherwise you have likely exceeded your server limits, or attempted to create threads too rapidly. The latter case usually occurs right after Varnish is started, and can be corrected by increasing the thread_pool_add_delay value.
threads_limited: otherwise you should consider increasing the value of thread_pool_max.
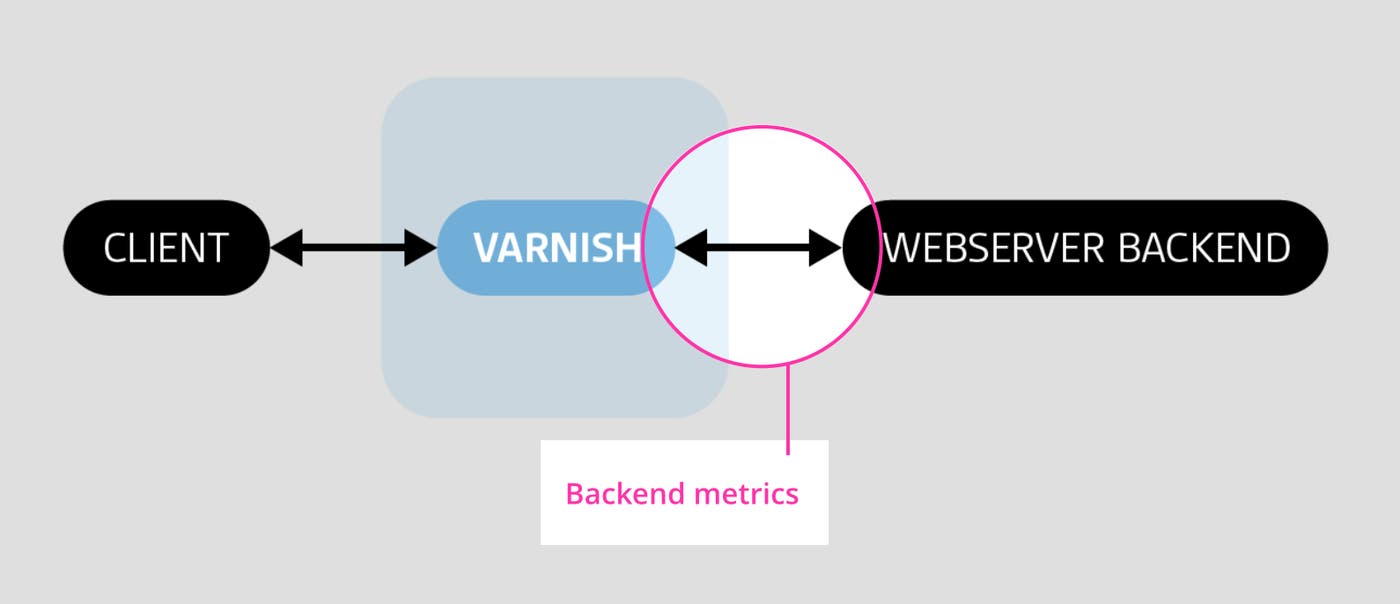
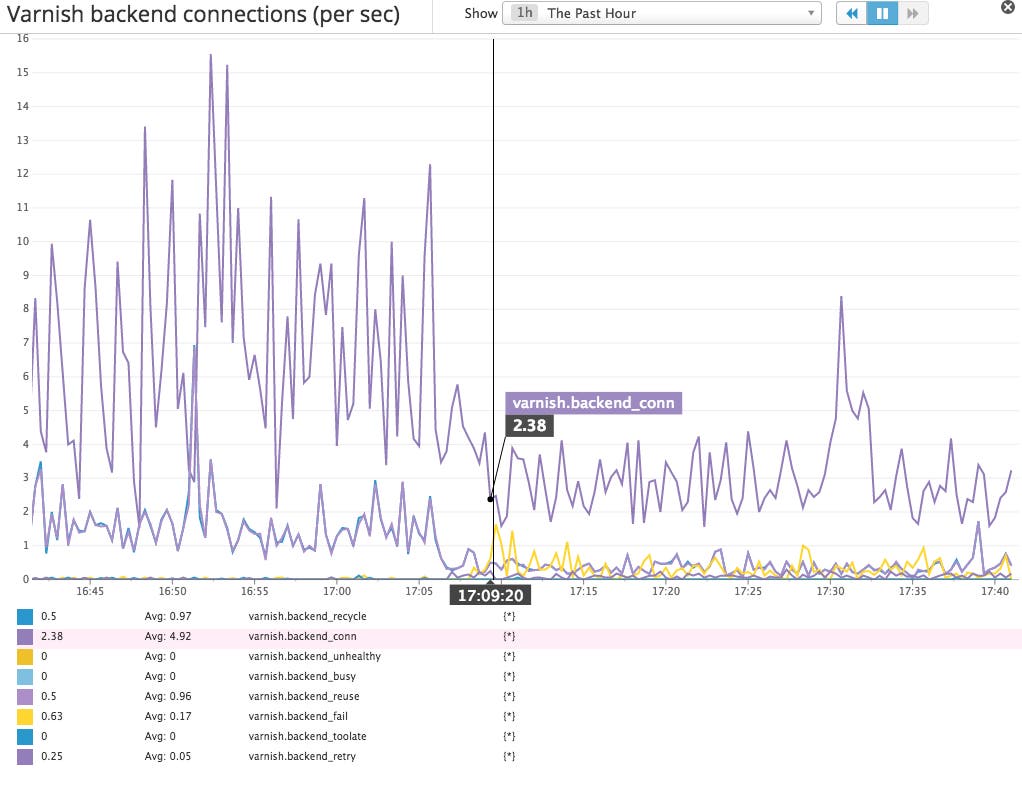
Keeping an eye on the state of your connections with backend web servers is also crucial to understand how well Varnish is able to do its work.
| Name | Description | Metric type |
|---|---|---|
| backend_conn | Cumulative number of successful TCP connections to the backend | Resource: Utilization |
| backend_recycle | Cumulative number of current backend connections which were put back to a pool of keep-alive connections and have not yet been used | Resource: Utilization |
| backend_reuse | Cumulative number of connections that were reused from the keep-alive pool | Resource: Utilization |
| backend_toolate | Cumulative number of backend connections that have been closed because they were idle for too long | Other |
| backend_fail | Cumulative number of failed connections to the backend | Work: Error (due to resource error) |
| backend_unhealthy | Cumulative number of backend connections which were not attempted because the backend has been marked as unhealthy | Resource: Error |
| backend_busy | Cumulative number of times the maximum amount of connections to the backend has been reached | Resource: Saturation |
| backend_req | Number of requests to the backend | Resource: Utilization |
If your backend has keep-alive set, Varnish will use a pool of connections. You can get some insight into the effectiveness of the connection pool by looking at backend_recycle and backend_reuse.
By default when backend_busy is incremented, that means the client receives a 5xx error response. However by using VCL, you can configure Varnish to recover from a busy backend by using a different backend, or by serving an outdated or synthetic response.
Backend requests, backend_req, should be monitored to detect network or cache performance issues.
backend_fail (backend connection failures) should be 0 or very close to 0. Backend connection failures can have several root causes:
Initial (TCP) connection timeout: usually results from network issues, but could also be due to an overloaded or unresponsive backend
Time to first byte: when a request is sent to the backend and it does not start responding within a certain amount of time
Time in between bytes: when the backend started streaming a response but stopped sending data without closing the connection
backend_unhealthy: Varnish periodically pings the backend to make sure it is still up and responsive. If it doesn’t receive a 200 response quickly enough, the backend is marked as unhealthy and every new request to it increments this counter until the backend recovers and sends a timely 200 response.
If you are using Edge Side Includes, esi_errors and esi_warnings will give you insight into the validity of your ESI syntax. If these metrics are increasing, you should inspect what is being returned by your backend and fix the errors you find.
In this post we’ve explored the most important metrics you should monitor to keep tabs on your Varnish cache. If you are just getting started with Varnish, monitoring the metrics listed below will give you great insight into your cache’s health and performance. Most importantly it will help you identify areas where tuning could provide significant benefits.
Requests per second
Dropped client connections
Cache hit rate
LRU Nuked objects
Some worker thread related metrics
Backend connection failures or unhealthy backend
Eventually you will recognize additional, more specialized metrics that are particularly relevant to your own environment and use cases.
Of course, what you monitor will depend on the tools you have and the metrics available.
Part 2 of this post provides step-by-step instructions for collecting these metrics from Varnish.
Many thanks to the Fastly and Varnish Software teams for reviewing this article prior to publication and providing important feedback and clarifications.
此内容由惯性聚合(RSS阅读器)自动聚合整理,仅供阅读参考。 原文来自 — 版权归原作者所有。