


Editor’s note: This post was updated on August 9, 2022, to include a demonstration of how to enable highly available support for HPA. It was also updated on November 12, 2020, to include a demonstration of how to autoscale Kubernetes workloads based on custom Datadog queries using the new DatadogMetric CRD.
With the release of the Datadog Cluster Agent, which was detailed in a companion post, we’re pleased to announce that you can now autoscale your applications running in Kubernetes in response to real-time fluctuations in any metric collected by Datadog. We’ve also released a new CRD that enables you to customize your metric queries with functions and arithmetic, giving you even more control over autoscaling behavior within your cluster.
The Horizontal Pod Autoscaling (HPA) feature, which was introduced in Kubernetes v1.2, allows users to autoscale their applications off of basic metrics like CPU, accessed from a resource called metrics-server. With Kubernetes v1.6, it became possible to autoscale off of user-defined custom metrics collected from within the cluster. Support for external metrics was introduced in Kubernetes v1.10, which allows users to autoscale off of any metric from outside the cluster—which now includes any metric you’re monitoring with Datadog.
This post demonstrates how to autoscale Kubernetes with Datadog metrics, by walking through an example of how you can scale a workload based on metrics reported by NGINX. We will also show you how to use the DatadogMetric CRD to autoscale workloads based on custom-built Datadog metric queries.
Before getting started, ensure that your Kubernetes cluster is running v1.10+ (in order to be able to register the External Metrics Provider resource against the Kubernetes API server). You will also need to enable the aggregation layer; refer to the Kubernetes documentation to learn how.
If you’d like to follow along, make sure that:
You have a Datadog account (if not, here’s a free trial)
You have the Datadog Cluster Agent running with both DD_EXTERNAL_METRICS_PROVIDER_ENABLED and DD_EXTERNAL_METRICS_PROVIDER_USE_DATADOGMETRIC_CRD set to true in the deployment manifest
You have node-based Datadog Agents running (ideally from a DaemonSet) with Autodiscovery enabled and running. This step enables the collection of the NGINX metrics used in the examples in this post.
Your node-based Agents are configured to securely communicate with the Cluster Agent (see the documentation for details)
The fourth point is not mandatory, but it enables Datadog to enrich Kubernetes metrics with the metadata collected by the node-based Agents. You can find the manifests used in this walkthrough, as well as more information about autoscaling Kubernetes workloads with Datadog metrics and queries, in our documentation.
Once you have met the above prerequisites, your configuration should include the datadog-cluster-agent service and the datadog-cluster-agent-metrics-api service per the manifest included in the documentation. Next, you should spin up the APIService to specify the API path and datadog-cluster-agent-metrics-api service on port 8443:
kubectl apply -f "https://raw.githubusercontent.com/DataDog/datadog-agent/master/Dockerfiles/manifests/cluster-agent-datadogmetrics/agent-apiservice.yaml"
You can now use these services to register the Cluster Agent as an External Metrics Provider in high-availability (HA) clusters by creating and applying a file that contains the following RBAC rules:
apiVersion: "rbac.authorization.k8s.io/v1"
kind: ClusterRole
metadata:
labels: {}
name: datadog-cluster-agent-external-metrics-reader
rules:
- apiGroups:
- "external.metrics.k8s.io"
resources:
- "*"
verbs:
- list
- get
- watch
---
apiVersion: "rbac.authorization.k8s.io/v1"
kind: ClusterRoleBinding
metadata:
labels: {}
name: datadog-cluster-agent-external-metrics-reader
roleRef:
apiGroup: rbac.authorization.k8s.io
kind: ClusterRole
name: datadog-cluster-agent-external-metrics-reader
subjects:
- kind: ServiceAccount
name: horizontal-pod-autoscaler
namespace: kube-system
You should see something similar to the following output:
clusterrole.rbac.authorization.k8s.io/external-metrics-reader created
clusterrolebinding.rbac.authorization.k8s.io/external-metrics-reader created
You should now see the following when you list the running pods and services:
kubectl get pods,svc
PODS
NAMESPACE NAME READY STATUS RESTARTS AGE
default datadog-agent-7txxj 4/4 Running 0 14m
default datadog-cluster-agent-7b7f6d5547-cmdtc 1/1 Running 0 16m
SVCS:
NAMESPACE NAME TYPE CLUSTER-IP EXTERNAL-IP PORT(S) AGE
default datadog-cluster-agent ClusterIP 192.168.254.197 <none> 5005/TCP 28m
default datadog-cluster-agent-metrics-api ClusterIP 10.96.248.49 <none> 8443/TCP 28m
Now it’s time to create a Horizontal Pod Autoscaler manifest that lets the Datadog Cluster Agent query metrics from Datadog. If you take a look at this hpa-manifest.yaml example file, you should see:
The HPA is configured to autoscale the nginx deployment
The maximum number of replicas created is 5 and the minimum is 1
The HPA will autoscale off of the metric nginx.net.request_per_s, over the scope kube_container_name: nginx. Note that this format corresponds to the name of the metric in Datadog
Every 30 seconds, Kubernetes queries the Datadog Cluster Agent for the value of the NGINX request-per-second metric and autoscales the nginx deployment if necessary. For advanced use cases, it is possible to autoscale Kubernetes based on several metrics—in that case, the autoscaler will choose the metric that creates the largest number of replicas. You can also configure the frequency at which Kubernetes checks the value of the external metrics.
Now, let’s create the NGINX deployment that Kubernetes will autoscale for us:
kubectl apply -f https://raw.githubusercontent.com/DataDog/datadog-agent/master/Dockerfiles/manifests/hpa-example/nginx.yaml
Then, apply the HPA manifest:
kubectl apply -f https://raw.githubusercontent.com/DataDog/datadog-agent/master/Dockerfiles/manifests/hpa-example/hpa-manifest.yaml
You should see your NGINX pod running, along with the corresponding service:
kubectl get pods,svc,hpa
POD:
default nginx-6757dd8769-5xzp2 1/1 Running 0 3m
SVC:
NAMESPACE NAME TYPE CLUSTER-IP EXTERNAL-IP PORT(S) AGE
default nginx ClusterIP 192.168.251.36 none 8090/TCP 3m
HPAS:
NAMESPACE NAME REFERENCE TARGETS MINPODS MAXPODS REPLICAS AGE
default nginxext Deployment/nginx 0/9 (avg) 1 5 1 3m
Make a note of the CLUSTER-IP of your NGINX service; you’ll need it in the next step.
At this point, we’re ready to stress the setup and see how Kubernetes autoscales the NGINX pods based on external metrics from the Datadog Cluster Agent.
Send a cURL request to the IP of the NGINX service (replacing NGINX_SVC with the CLUSTER-IP from the previous step):
curl <NGINX_SVC>:8090/nginx_status
You should receive a simple response, reporting some statistics about the NGINX server:
Active connections: 1
server accepts handled requests
1 1 1
Reading: 0 Writing: 1 Waiting: 0
Behind the scenes, the number of NGINX requests per second also increased. Thanks to Autodiscovery, the node-based Agent already detected NGINX running in a pod, and used the pod’s annotations to configure the Agent check to start collecting NGINX metrics.
Now that you’ve stressed the pod, you should see the uptick in the rate of NGINX requests per second in your Datadog account. Because you referenced this metric in your HPA manifest (hpa-manifest.yaml), and registered the Datadog Cluster Agent as an External Metrics Provider, Kubernetes will regularly query the Cluster Agent to get the value of the nginx.net.request_per_s metric. If it notices that the average value has exceeded the targetAverageValue threshold in your HPA manifest, it will autoscale your NGINX pods accordingly. Let’s see it in action!
Run the following command:
while true; do curl <NGINX_SVC>:8090/nginx_status; sleep 0.1; done
In your Datadog account, you should soon see the number of NGINX requests per second spiking, and eventually rising above 9, the threshold listed in your HPA manifest. When Kubernetes detects that this metric has exceeded the threshold, it should begin autoscaling your NGINX pods. And indeed, you should be able to see new NGINX pods being created:
kubectl get pods,hpa
PODS:
NAMESPACE NAME READY STATUS RESTARTS AGE
default datadog-cluster-agent-7b7f6d5547-cmdtc 1/1 Running 0 9m
default nginx-6757dd8769-5xzp2 1/1 Running 0 2m
default nginx-6757dd8769-k6h6x 1/1 Running 0 2m
default nginx-6757dd8769-xzhfq 1/1 Running 0 2m
default nginx-6757dd8769-j5zpx 1/1 Running 0 2m
default nginx-6757dd8769-vzd5b 1/1 Running 0 29m
HPAS:
NAMESPACE NAME REFERENCE TARGETS MINPODS MAXPODS REPLICAS AGE
default nginxext Deployment/nginx 30/9 (avg) 1 5 5 29m
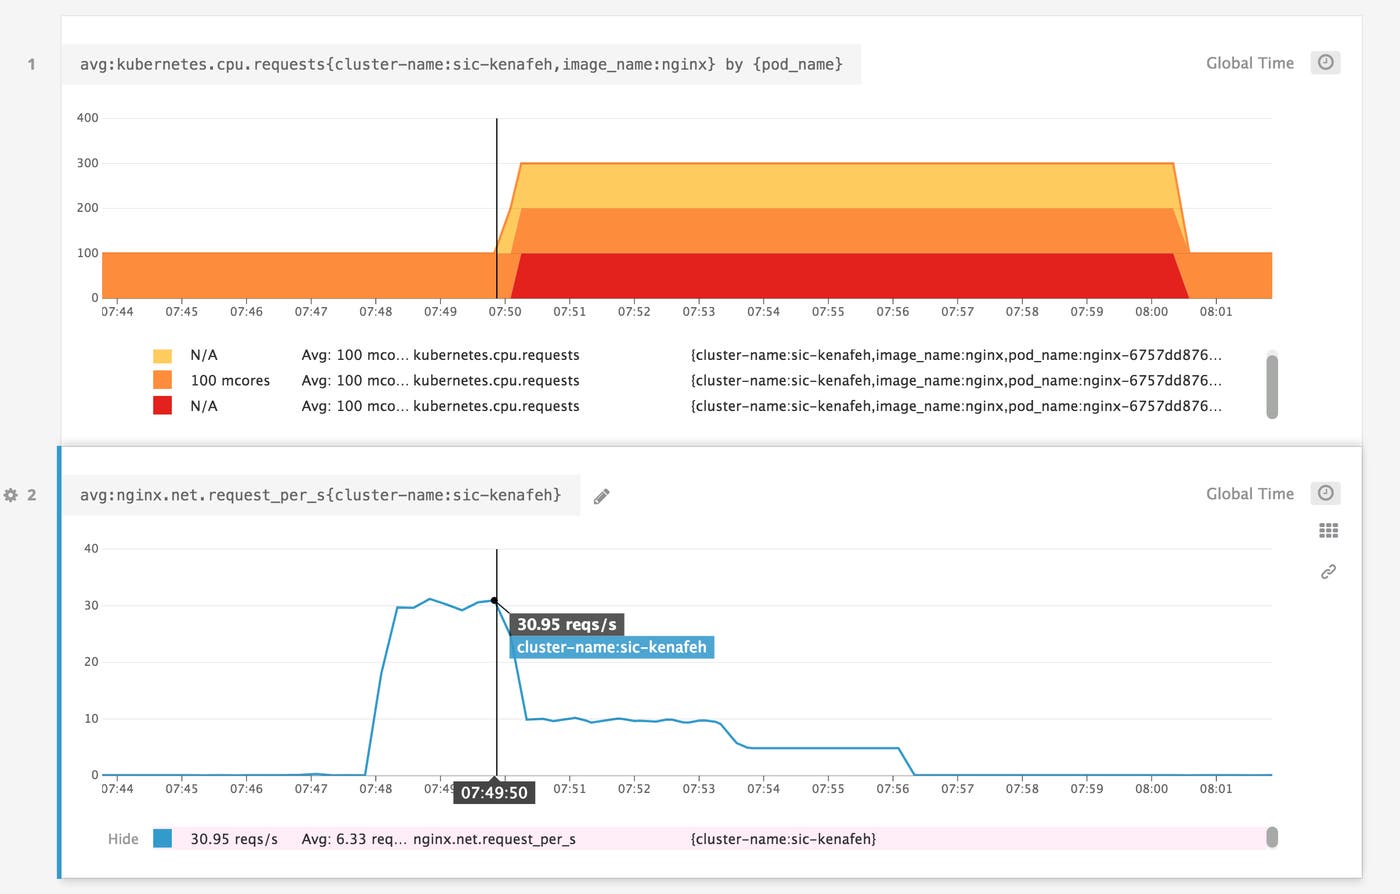
Voilà. You can use Datadog dashboards and alerts to track Kubernetes autoscaling activity in real time, and to ensure that you’ve configured thresholds that appropriately reflect your workloads. Below, you can see that after the average rate of NGINX requests per second increased above the autoscaling threshold, Kubernetes scaled the number of pods to match the desired number of replicas from our HPA manifest (maxReplicas: 5).
Organizations that rely on HPA to autoscale their Kubernetes environments require their data to be highly available. For example, a bank can’t afford to experience an outage because of one Kubernetes region going down. To ensure that autoscaling is resilient to failure, Datadog allows you to easily configure the Cluster Agent to selectively fetch any metrics you use for HPA (both Kubernetes and standard/custom application metrics) from multiple Datadog regions. The Cluster Agent will fetch Datadog metrics from the specified endpoints and automatically failover if one of the endpoints is degraded, based on availability and latency.
To enable high availability for HPA, simply configure the Datadog Cluster Agent manifest with several endpoints, as shown in the example below:
external_metrics_provider:
endpoints:
- api_key: <DATADOG_API_KEY>
app_key: <DATADOG_APP_KEY>
url: https://app.datadoghq.eu
- api_key: <DATADOG_API_KEY>
app_key: <DATADOG_APP_KEY>
url: https://app.datadoghq.com
To test your system’s high availability, you can simulate a regional failure by, for example, blocking the network with iptables rules. Then, confirm that the DCA switches to another endpoint by querying the Agent status:
$ kubectl exec <POD_NAME> -- agent status | grep -A 20 'Custom Metrics Server'
Custom Metrics Server
=====================
Data sources
------------
- URL: https://app.datadoghq.eu [OK]
Last failure: 2022-7-13T14:29:12.22311173Z
Last Success: 2022-7-13T14:20:36.66842282Z
- URL: https://app.datadoghq.com [OK]
Last failure: 2022-7-10T06:14:09.87624162Z
Last Success: 2022-7-13T14:29:36.71234371Z
The release of version 1.7.0 of the Cluster Agent has made it possible to autoscale your Kubernetes workloads based on custom-built metric queries. Autoscaling based on custom queries has the same prerequisites that we described earlier in this post. Make sure that you’ve also installed the datadog-custom-metrics-server and registered the Cluster Agent as an External Metrics Provider.
Customizing your metric queries with arithmetic operations and functions can give you increased flexibility for certain use cases. For example, you could use the following query to determine how close your pods are to exceeding their CPU limits:
avg:kubernetes.cpu.usage.total{app:foo}.rollup(avg,30)/(avg:kubernetes.cpu.limits{app:foo}.rollup(avg,30)*1000000000)
Scaling in response to this query can help prevent CPU throttling, which degrades performance. (Note that we multiply by 1,000,000,000 because kubernetes.cpu.usage.total is measured in nanocores, while kubernetes.cpu.limits is in cores.)
In this section, we’ll illustrate another use case for the DatadogMetric CRD by showing you how to autoscale the same NGINX deployment we created earlier. We will autoscale our deployment against maximum values of the NGINX requests-per-second metric, allowing us to capture unexpected spikes in traffic.
In order to configure the Cluster Agent to scale in response to Datadog queries, you need to install the DatadogMetric CRD in your cluster.
kubectl apply -f "https://raw.githubusercontent.com/DataDog/helm-charts/master/crds/datadoghq.com_datadogmetrics.yaml"
Now, update the Datadog Cluster Agent RBAC manifest to allow usage of the DatadogMetric CRD:
kubectl apply -f "https://raw.githubusercontent.com/DataDog/datadog-agent/master/Dockerfiles/manifests/cluster-agent-datadogmetrics/cluster-agent-rbac.yaml"
Before you move on, confirm that the DD_EXTERNAL_METRICS_PROVIDER_USE_DATADOGMETRIC_CRD variable in your cluster-agent-deployment.yaml file is set to true. If it is not, you’ll need to make the adjustment and re-apply the file.
DatadogMetric resource to your HPANow that you’ve laid the groundwork, it’s time to create a DatadogMetric resource and add it to your HPA. DatadogMetric is a namespaced resource, so while any HPA can reference any DatadogMetric, we recommend creating them in the same namespace as your HPA. To do so, create a manifest with the following code, and then apply it:
apiVersion: datadoghq.com/v1alpha1
kind: DatadogMetric
metadata:
name: nginx-requests
spec:
query: max:nginx.net.request_per_s{kube_container_name:nginx}.rollup(60)
The query in this manifest (max:nginx.net.request_per_s{kube_container_name:nginx}.rollup(60)) checks the maximum NGINX requests received per minute (by using the .rollup() function to aggregate the maximum value of the metric over 60-second intervals).
Now, create and apply an updated hpa-manifest.yaml file to reference your newly created DatadogMetric resource instead of the NGINX metric from our earlier example. The metricName value should be set to datadogmetric@default:nginx-requests, where default represents the namespace. You can also omit the metricSelector. Your new hpa-manifest.yaml file should look like this:
apiVersion: autoscaling/v2beta1
kind: HorizontalPodAutoscaler
metadata:
name: nginxext
spec:
minReplicas: 1
maxReplicas: 5
scaleTargetRef:
apiVersion: apps/v1
kind: Deployment
name: nginx
metrics:
- type: External
external:
metricName: datadogmetric@default:nginx-requests
targetAverageValue: 9
Now that you’ve connected the DatadogMetric resource to your HPA, the Datadog Cluster Agent will use your custom query to scale your NGINX deployment accordingly.
We’ve shown you how the Datadog Cluster Agent can help you easily autoscale Kubernetes applications in response to real-time workloads. The possibilities are endless—not only can you scale based on metrics from anywhere in your cluster, but you can also use metrics from your cloud services (such as Amazon RDS or AWS ELB) to autoscale databases, caches, or load balancers.
If you’re already monitoring Kubernetes with Datadog, you can immediately deploy the Cluster Agent (by following the instructions here) to autoscale your applications based on any metric available in your Datadog account, as well as any custom Datadog metric query. If you’re new to Datadog, get started with a 14-day free trial.
此内容由惯性聚合(RSS阅读器)自动聚合整理,仅供阅读参考。 原文来自 — 版权归原作者所有。