





Caching is critical to modern apps, helping you serve data more quickly and improve your app’s overall performance. Effective caches can result in better Core Web Vitals (CWV), improved search visibility, and a smoother user experience.
Deciding which types of caches to use in your app can be challenging, especially for apps that rely heavily on JavaScript code. These apps often involve resource-intensive calculations, repeated API calls, or complex visualizations and animations, all of which come with performance costs. JavaScript caches can help you offset the performance impact of these complicated components and improve your app’s processing speed. Yet, with so many different types of data being processed, you may have to use a combination of caching methods to achieve the best results.
In this post, we’ll discuss common types of JavaScript caches, including which ones are best suited to dynamic data or static data or work well for both data types. We’ll also touch on how you can measure the success of your caching strategy.
Caching data effectively means balancing multiple factors, including performance, freshness, and security. For example, serving the latest data means users get more accurate information. However, the frequent downloads necessary for doing so can cause significant latency, and your app may require more compute resources and higher network throughput to handle the volume of requests.
Navigating these tradeoffs means deciding how long cached data can be considered valid (its staleness tolerance) and how you’ll refresh this data once it becomes too stale. A cache that uses a set time to live (TTL) to automatically invalidate stale data is often easier to configure but may lead to a lag in data updates. Meanwhile, cache invalidation strategies ensure that your cache updates as soon as fresh data is available but can be more complicated to implement and may result in performance impacts through frequent origin calls.
You’ll also want to consider the security needs of your data. Many JavaScript caches store data on the user’s device for faster retrieval. Because client-side storage is accessible to JavaScript running on the page, it is vulnerable to XSS attacks, browser extensions, and access by other users on shared devices. To avoid exposure, you’ll want to limit the amount of sensitive data you store in these caches, such as private keys, authentication tokens, or payment information.
JavaScript apps often contain both static and dynamic resources, which may benefit from being cached separately. Let’s explore a few different methods of caching, which data types they’re best suited for, and how they handle key tradeoffs.
Caching methods summary
| Cache type | Benefits | Drawbacks | Data types |
|---|---|---|---|
| In-memory | Fast and easy to implement | Hardware limitations, short persistence, prone to staleness | Notifications, scroll positions |
| sessionStorage | More storage capacity and control than cookies | Short persistence, blocks the main thread | Page history, menu options |
| localStorage | Persistent storage for simple, small data | Capacity limitations, blocks the main thread | User preferences, accessibility settings |
| IndexedDB | Offline, persistent storage for large, structured data sets | Complicated API, limited browser support | Chat messages, time-series metrics |
| HTTP caching | Straightforward options for data access and invalidation | Potential data leakage or staleness, depending on header configuration | Images, index.html files |
| CDNs | Fast access to shared resources | Privacy concerns with misconfigured communication policies | Images, index.html files |
| Cache API | Relatively large, persistent storage with flexible caching options | Potential performance costs | CSS code, product information |
| OPFS | Very large, persistent storage | Limited browser support | Game assets, machine learning data |
JavaScript code often involves handling data that changes frequently, i.e., dynamic data. This can include the results of API requests, database queries, complex computations, and user input. Knowing which method of caching to use for dynamic data means considering its size, structure, and staleness tolerance.
In-memory caches store data temporarily within a device’s RAM. These caches provide fast performance since data is available directly within the user’s device and isn’t mediated by the network.
In-memory caches usually only persist while your JavaScript code is running, meaning that any data stored in them disappears once the user refreshes or navigates away from the page. They also lack built-in cache invalidation, which can lead to stale data. Overreliance on them can cause slowdowns and out-of-memory (OOM) errors within your app.
Given these tradeoffs, in-memory caches are best suited for data that needs to be served quickly and stored only briefly. For JavaScript data, this can include notifications, scroll positions, and precalculated historical statistics. In-memory caching can also be particularly useful for single-page apps (SPAs), as it provides a good system for storing routing information for fast navigation.
To reduce memory consumption by unnecessary values or metadata, some developers use WeakMaps to implement these caches. Here’s a simple in-memory cache created with a WeakMap that provides functionality for checking, retrieving, setting, or removing cached values:
const cache = new WeakMap();
function has(key) {
if (key !== null && typeof key === "object") {
return cache.has(key);
}
return false;
}
function remove(key) {
if (key !== null && typeof key === "object") {
return cache.delete(key);
}
return false;
}
function getOrSet(key, compute) {
if (key === null || typeof key !== "object") {
throw new TypeError("Cache key must be an object");
}
if (cache.has(key)) {
return cache.get(key);
}
const value = compute();
cache.set(key, value);
return value;
}
The Web Storage API offers longer persistence and more explicit read/write control over your data than in-memory caches. This API provides two storage mechanisms:
sessionStorage persists data while the current browser session is active
localStorage persists data even after the browser is closed
Neither are technically methods of caching, but they are often used for the similar purpose of storing small amounts of data. For sessionStorage, this may include navigational or UI context, such as currently expanded menus, previous pages, or the state of a multi-step form. localStorage’s longer persistence means it’s often more suited for user preferences, such as light or dark mode toggles, language selections, or accessibility settings. For relatively simple data types such as these, both options provide fast performance.
That being said, both sessionStorage and localStorage are synchronous, meaning that they block the main thread until their operations are complete. This can quickly lead to high latency when storing or retrieving large data sets or other long tasks. As a result, using these storage methods can cause rendering delays for important elements, such as critical user interactions. Therefore, many recommend using the Web Storage API mechanisms with caution—particularly localStorage, which can quickly accumulate data across sessions. As many browsers set a hard limit of how much you can store via this API, usually around 5-10 MiB, this data accumulation can fill up user storage, causing write operations to fail with a QuotaExceededError.
To cache large amounts of structured data, you may want to use IndexedDB. IndexedDB is an API that enables you to create and manage client-side transactional databases. It is ideal for caching bigger data sets, such as chat messages, saved articles, and time-series metrics for data visualizations.
Because it provides offline, browser-based storage that can support a variety of data types, IndexedDB can be especially useful for progressive web apps (PWAs), which must be able to support offline use. However, the IndexedDB API is often considered challenging to use, as it has an older, callback-based structure; few native querying methods; and a confusing commit mechanism for transactions.
Additionally, IndexedDB transactions often take a while to process, which can lead to slow performance. This can be offset by the fact that IndexedDB works asynchronously, meaning that other browser processing operations aren’t blocked while large data processing activities are being carried out. Note that attempting to process too many large requests at the same time can quickly impact memory and disk I/O performance. Therefore, you’ll want to limit these requests to ensure that performance isn’t impacted.
In contrast to dynamic data, static assets don’t need to be updated as frequently. These resources often make up the skeleton of your application, such as index.html files, CSS code, and web fonts, as well as any JavaScript code and libraries necessary for basic user interactions. They may also include larger files that are unlikely to change often, including images and videos.
While freshness may not be as much of a concern for static data, you still need to consider data access restrictions and potential security risks. For example, caching static data in a proxy server can significantly reduce bandwidth use by limiting the number of calls made to the origin server. However, this data can be compromised during proxy communications if not encrypted properly.
HTTP headers are fields included in HTTP requests and responses that provide specifications about how data should be handled. You can configure these headers to store responses to user requests within a cache. Some header fields important to creating and managing these caches include:
Cache-Control: the Cache-Control header enables you to specify how resources should be stored and validated. There are a few directives you can use to customize this header:
max-age: the max-age value corresponds to your staleness tolerance. This is a more modern alternative to headers like Expires, which require you to set a specific date and time for data expiration. Instead, max-age is relative to when the request was received. For static resources, max-age should be set for a long timeframe—Chrome recommends a year.
public, private, and no-store: setting Cache-Control to public stores data within a proxy cache that is shared by multiple users. Meanwhile, the private directive stores data in a single-user cache located within the web browser. The latter can be a better choice for storing user-personalized content, as proxy caches pose a greater risk of accidental data leakage. Finally, you can also use the no-store directive to prevent highly sensitive information, such as personally identifiable information (PII) or user authentication information, from being cached at all.
ETag and Last-Modified: these headers enable you to track data changes for more granular cache invalidation. Last-Modified headers use timestamps to log updates. These timestamps have limited precision and may not detect rapid successive updates. By contrast, ETag headers use opaque identifiers, usually a hash. If using content-based hashing, your ETags will only change when the content updates (instead of whenever the file is saved), which can provide more reliable versioning than timestamps.
CDNs enable you to store static assets in shared proxy servers that are geographically close to users. By minimizing the distance that data needs to travel, CDNs help users more quickly access server-side resources. Additionally, many CDN caches contain assets that are shared across multiple users, reducing the number of requests made to app storage.
Many CDN services come with default cache settings already configured. Often, you can use HTTP headers to set these values yourself. For example, Cloudflare will automatically override its own out-of-the-box TTL settings if it detects that a custom Cache-Control header has been defined. Since your CDN caches route much of your data through third-party services, you should ensure that the traffic between clients, the CDN, and your origin is encrypted using Transport Layer Security (TLS).
A few caching methods work equally well for both static and dynamic data. These caching methods provide advanced functionality for controlling how your data is stored and when it’s accessed. As a result, they can be especially useful for building PWAs, which rely heavily on caching to dynamically serve content and provide robust offline access.
The Cache API is designed to store network requests and responses within the user’s browser. Usually, tasks involving the Cache API are managed by JavaScript service workers. These service workers use event listeners to intercept HTTP requests and then determine whether the requested data already exists in Cache API storage. If it does, the service workers fetch the data and deliver it to the user.
This API provides access to a number of flexible caching methods that are useful for fine-tuning dynamic data storage. For critical, real-time data, you can configure a network-first strategy that uses the cache only as necessary—e.g., in case of network issues—to improve your app’s reliability without sacrificing accuracy. Note that this strategy can come with performance tradeoffs, as it involves updating the cache with every request.
For data that rarely changes, you can use a stale-while-revalidate strategy. Stale-while-revalidate can lower your app’s latency by defaulting to the cache for incoming requests, then updating cached content in the background.
Due to its relatively long persistence and large storage capacity, the Cache API is also often used to store static assets. For this data, you’ll usually want to configure your app to rely primarily on the cache and only send requests over the network when the asset is not found. This is referred to as a cache-first strategy.
No matter which strategy you use, the Cache API can result in some degree of performance costs. Each network request means waiting for the service worker to process it and decide where to retrieve the data from. You can mitigate this by using the InstallEvent.addRoutes method in the Service Worker API to bypass the service workers and immediately fetch static resources you know the location of.
If you need a performant caching option for large files, you may want to use the OPFS. The OPFS is a persistent virtual file system hidden from the user. It offers better performance than storing files within the user-visible file system because it isn’t subject to the same permission prompts and security checks. The browser manages the OPFS directly, making it easily accessible by web apps.
The OPFS provides greater control over your files than databases like IndexedDB, enabling you to stream files and work with them on the byte level. This makes it best for caching particularly large or otherwise complex data. When it comes to dynamic data, this might include autosaved copies of user-generated content and chunked, in-progress file downloads. For static data, you might use the OPFS to cache images, videos, and game assets. This level of storage capability and flexibility also makes the OPFS good for caching machine learning data, including model weights, vector indexes, training logs, and tokenizers.
The OPFS is asynchronous when running on the main thread, which enables it to provide relatively low-latency processing. For even better performance, you can use JavaScript Web Workers to execute complex tasks on a background thread. Web Workers have access to OPFS’s synchronous API, making them well-suited for read/write-intensive file operations that would otherwise cause blocking. Meanwhile, other processing can continue uninterrupted. As with IndexedDB, you should monitor large requests closely to ensure that they don’t consume excess network resources. For example, you may want to create a monitor that evaluates the latency of requests involving the OPFS cache.
You don’t need to cache every resource in your app. Doing so can quickly run up against storage limits with in-memory caches or the Web Storage API, or add unnecessary complexity, particularly with IndexedDB or the OPFS. While some apps have either a clear need for fresh data or a high staleness tolerance, many fall somewhere in between. This makes it difficult to weigh the potential performance impacts of frequent network requests against the reliability impacts caused by serving outdated information via a cache.
Datadog can help you identify which resources are leading to high latency in your app and, therefore, which ones might benefit the most from caching. Let’s say that you’ve recently completed a UI redesign. Soon after, you receive an alert that the Largest Contentful Paint (LCP) score for your product purchase flow has increased, indicating slower interactions. With the Optimization overview in Datadog Real User Monitoring (RUM), you can quickly identify which pages in your app are experiencing the worst performance to pinpoint the source of the problem. These pages are sorted on view count by default, helping you determine which ones have the greatest user impact. To help you troubleshoot, the Optimization overview lists the CWV, First Contentful Paint (FCP), and overall loading time for each page.
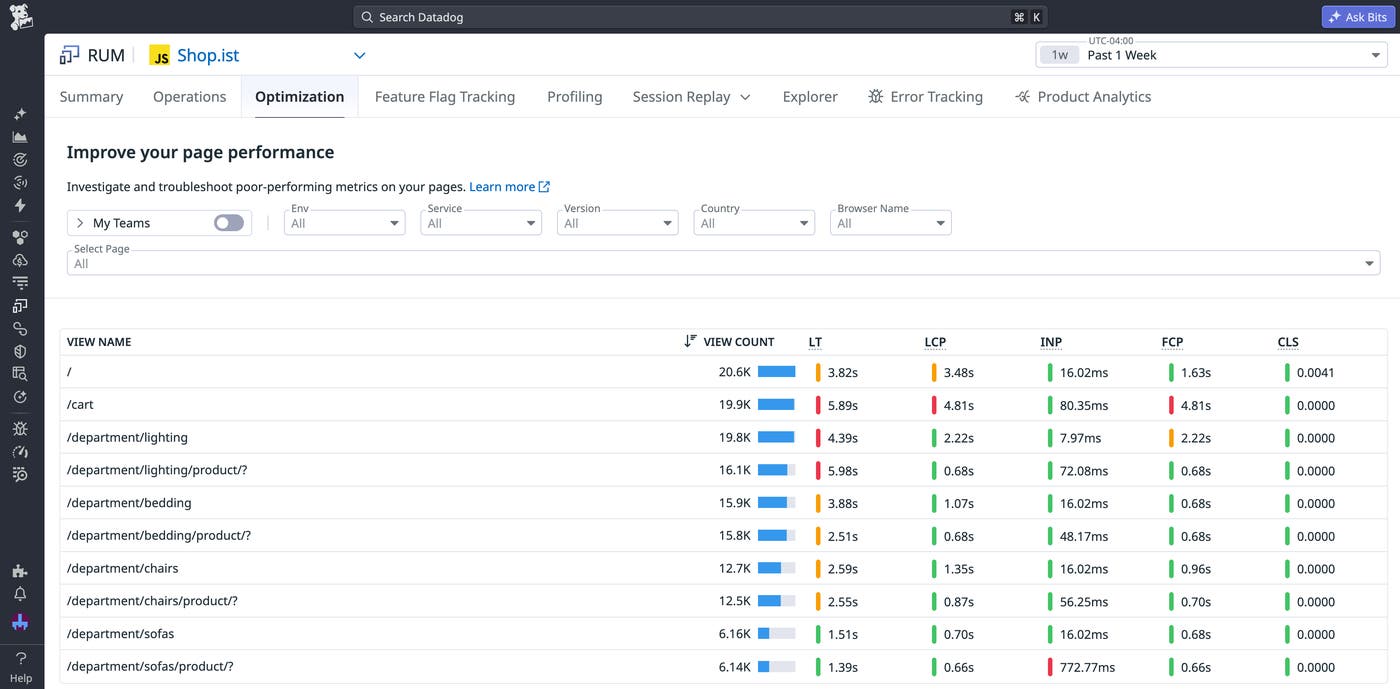
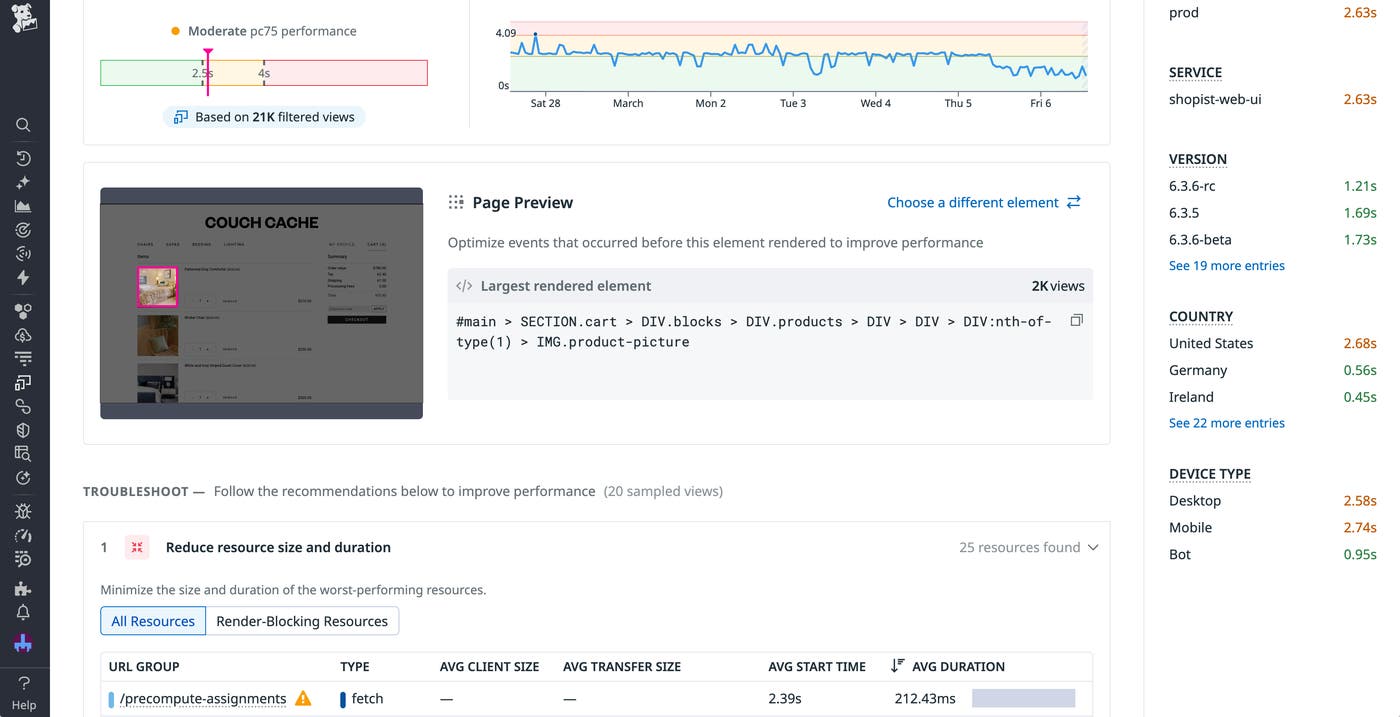
You see the cart page has a particularly bad LCP score, so you select this score to view a detailed summary of factors that contributed to its rating. This includes a list of large resources and their processing duration, along with the percentage of sampled sessions that included cached resources. This summary also highlights which elements contributed the most to the overall score so you can identify those that are impacted by large resource downloads. For LCP, this is the largest rendered element. In this case, you see that the largest elements are images for items within the user’s cart.
Finally, you can view an event waterfall that breaks down the timeline for all event executions on this page, with long tasks highlighted.
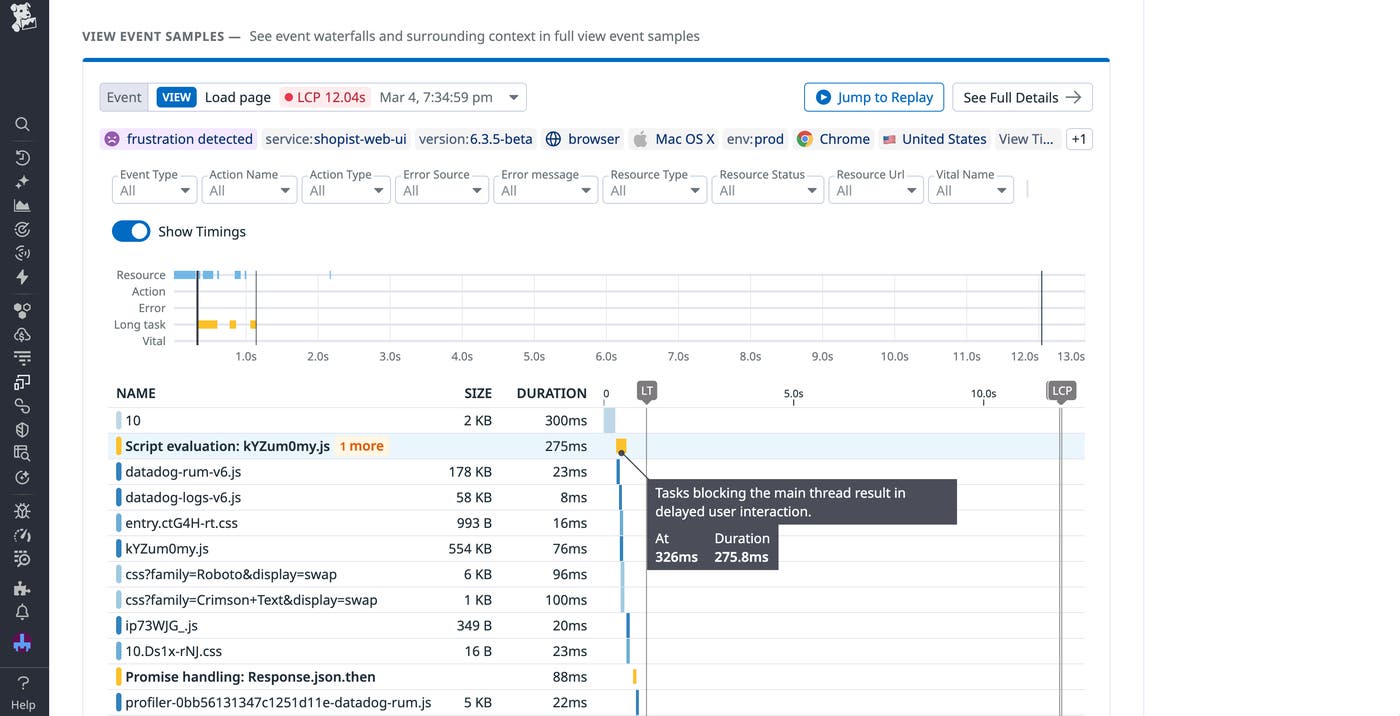
Here, you notice that one of the longest events involves an API call responsible for fetching these images. With this information, you can identify resources that could be particularly useful to cache. Because these images are unlikely to change often, you decide to store them in the Cache API using a cache-first strategy for faster rendering.
As you update your caching strategy, you should continue monitoring your app performance to ensure that the new caches are an improvement. The Optimization feature comes with a timeseries graph that helps you track trends in your frontend performance metrics over time. You can also set up monitors that will alert you if your app starts showing signs of poor performance, which can help you respond quickly if you’ve implemented a new cache incorrectly. For example, the Datadog RUM SDK will automatically collect duration information for Cache API fetch requests. By creating a monitor using the resource.duration metric, you can easily catch request latency that exceeds a predefined threshold:
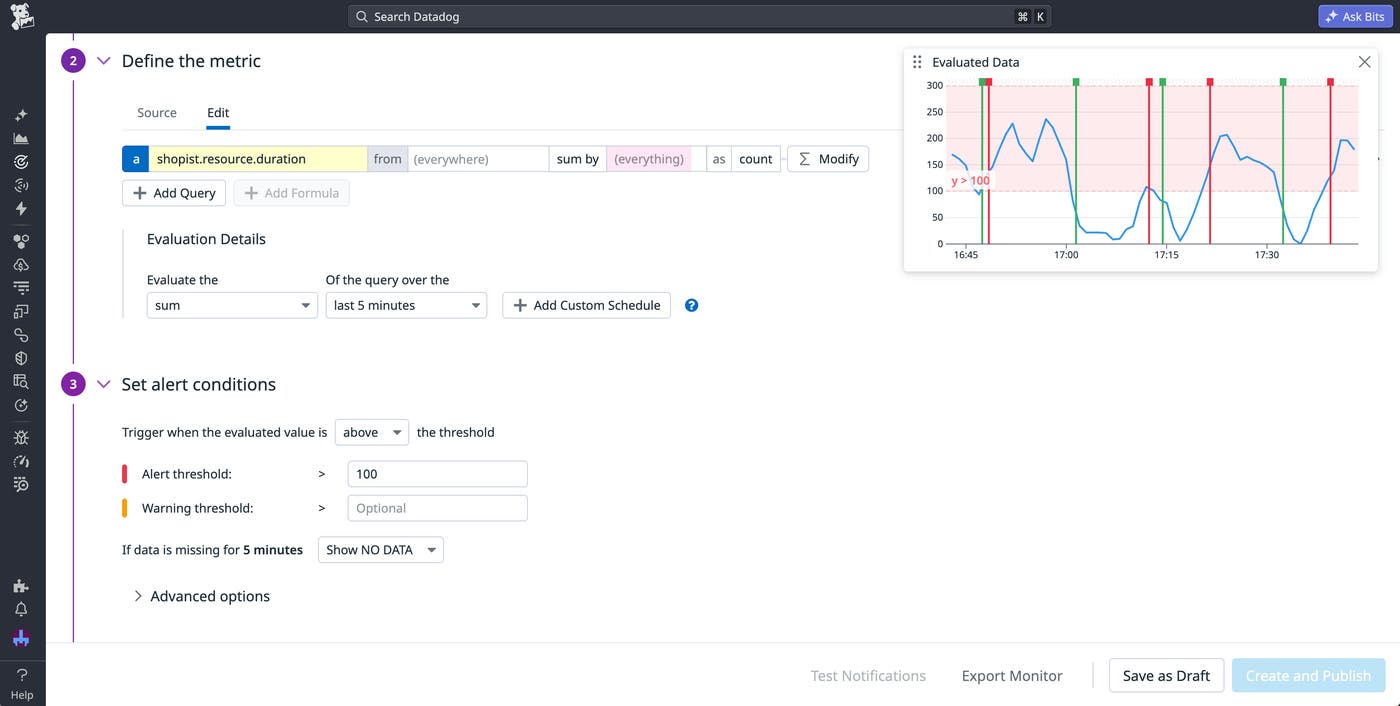
In this example, you may want to separate cache request calls from network request calls in order to more closely evaluate the success of your new caching strategy. To do so, you can easily collect data on cache request latencies by instrumenting your code with the addDurationVital method:
datadogRum.addDurationVital('cache_api_lookup', {
startTime,
duration: performance.now() - startTime,
context: {
url: typeof request === 'string' ? request : request.url,
cache_hit: response?.fromCache === true,
}
});
You can then create a distribution metric from your vital.duration data and generate a cache-specific request latency monitor.
Waiting for critical web app data to download can quickly degrade your user experience. While it can be difficult to find the right combination of caches, optimizing these combinations can lead to meaningful improvements to your JavaScript app’s speed, reliability, and user experience.
To learn more about using Datadog to improve your caching strategy, you can view our RUM documentation. Or, if you’re new to Datadog, you can sign up for a 14-day free trial.
此内容由惯性聚合(RSS阅读器)自动聚合整理,仅供阅读参考。 原文来自 — 版权归原作者所有。