









Editor’s note: Vault uses the term “master” to describe the key used to encrypt your keyring. Datadog does not use this term, and within this blog post, we will refer instead to the “main” key.
HashiCorp Vault provides centralized storage and management of passwords, API keys, tokens, and other secrets that distributed applications can use to operate securely. Vault clients—services and applications that access secrets programmatically, as well as users who interact with a Vault server—can create, update, and read secrets based on the permissions you grant them. Vault audit logs provide a record of clients’ requests and Vault’s responses, and can be a key resource for spotting potential security problems. In this post, we’ll explain some common threats to HashiCorp Vault security, describing how attackers can:
Use root or recovery tokens to access your secrets
Cover their tracks by disabling audit logging
Elevate permissions assigned to Vault clients
Finally, we’ll show you how you can automatically detect these and other threats with Datadog.
Vault audit logs provide detailed information about your Vault server’s activity. Auditing is not enabled by default, but it is recommended, because the data in your audit logs can be critical for investigating potential security issues. Audit logs can also provide data for automated security monitoring, as we’ll explain later in this post. To configure Vault auditing, you need to enable one or more audit devices. You can write audit logs to the file system using the file device, send them to a logging daemon with the syslog device, and send them to a remote location via the socket device. For example, to log Vault activity to the file /vault/vault-audit.log, you could issue the following command at the Vault command-line interface (CLI):
vault audit enable file file_path=/vault/vault-audit.log
You can enable multiple audit devices for redundancy, for example sending logs to a file on the local file system and to a remote host at the same time. For all audit devices, Vault writes each log entry as a JSON object. To manually explore your audit logs, you can use a JSON processor like jq, as described in the Vault documentation. Or if you’d like to use Datadog to view, analyze, search, and alert on Vault audit logs, we’ll cover this in a later section of this post.
Once you’ve configured Vault to generate audit logs, you can use them as a resource to help ensure the security of your Vault installation. In this section, we’ll explain some Vault security threats you should be aware of, and show you some of the log data that can indicate that an attacker has tried to implement these exploits against your Vault installation.
When a client authenticates to Vault, the server issues a token—a unique string which the client will send with each of its requests to prove its identity. A root token authorizes a user to execute unlimited operations in a Vault instance. When you’re investigating a security incident, audit logs can help you verify whether a root token was used so you can understand the potential scope of the problem.
You should typically only use a root token during setup and emergency troubleshooting, then delete it immediately to ensure that an attacker can’t use it to access your secrets. If you’ve deleted the initial root token you used to start the server—as well as any root tokens you’ve created subsequently—an attacker could still create a new one to gain access to your secrets.
The process of generating a root token requires several steps, each of which appears in the audit logs with a request.path value of sys/generate-root/attempt. The first request initializes the process. In subsequent requests, the client must provide a quorum of the shards that make up the unseal key that Vault uses to encrypt the main key. Vault will create the root token only after the quorum has been met, and will create a corresponding audit log that indicates that the root token generation process is complete.
The sample log shown below illustrates an initial request to create a root token, sent at 21:23 UTC on September 16, 2021. (Note that strings in Vault audit logs are hashed for security using an HMAC-SHA256 algorithm, which is why the values of many log fields start with hmac-sha256. Those hashed values have been omitted from the example logs in this post for readability.)
{
"time": "2021-09-16T21:23:28.962795023Z",
"type": "request",
"auth": {
"token_type": "default"
},
"request": {
"id": "e5163a5c-38ce-960b-d3a1-8030f1b04540",
"operation": "update",
"namespace": {
"id": "root"
},
"path": "sys/generate-root/attempt",
"data": {
"otp": "hmac-sha256:[...]",
"pgp_key": "hmac-sha256:[...]"
},
"remote_address": "127.0.0.1"
}
}
Audit logs will also indicate when a root token has been used. When a client sends a root token, Vault will create a log whose auth.policies object includes root. Since a root token can authorize any request to Vault, evidence of this in your audit logs indicates a possible security threat. A recovery token—a specialized token that is created when Vault is started in recovery mode—can also grant elevated privileges to a malicious actor. If a client has attempted to create a recovery token, your audit logs will include a request.path value of /sys/generate-recovery-token. An attacker with access to a root token or a recovery token can also use elevated privileges to leverage other techniques, such as disabling audit devices and manipulating Vault policies. We’ll look at each of these security threats in the following sections.
You may need to occasionally disable Vault’s audit devices—for example, to perform maintenance on your application’s storage which could disrupt Vault’s access to the file system. But attackers can also benefit from disabling audit devices. Turning off a server’s logging is a common technique that attackers use to ensure that their intrusions and compromises are not detected. A malicious actor with sufficient privileges—such as one using a root token—can run the vault audit list command to see which audit devices are enabled, then disable any of them using the vault audit disable command. Whenever an audit device has been disabled, Vault will generate an audit log that indicates when this occurred. The example log shown below is the result of the vault audit disable syslog command, which disables the syslog audit device:
{
"time": "2021-09-16T22:10:08.676022294Z",
"type": "request",
"auth": {
"client_token": "hmac-sha256:[...]",
"accessor": "hmac-sha256:[...]",
"display_name": "root",
"policies": [
"root"
],
"token_policies": [
"root"
],
"token_type": "service",
"token_issue_time": "2021-09-16T21:55:21Z"
},
"request": {
"id": "2e05d9a3-e724-51ba-e3e3-297eec7cb292",
"operation": "delete",
"mount_type": "system",
"client_token": "hmac-sha256:[...]",
"client_token_accessor": "hmac-sha256:[...]",
"namespace": {
"id": "root"
},
"path": "sys/audit/syslog",
"remote_address": "127.0.0.1"
}
}
A log like this could indicate that your visibility into Vault’s activity has become impaired. To ensure that you have no blindspots in your Vault auditing, you should investigate any logs that include a request.operation value of delete on any auditing-related endpoints (i.e., those containing sys/audit).
When a client authenticates, Vault provides a token that is associated with one or more policies that determine which actions the client can perform. For example, Vault will only allow a client to read a secret if the client has been issued a token with an attached policy that grants read access to that secret.
You can create and manage policies by uploading a JSON or HashiCorp Configuration Language (HCL) file to Vault via the CLI or the Vault API, or by using the Vault UI. Managing Vault policies requires sufficient permissions, but an attacker using elevated privileges provided by a root token or a recovery token could manipulate policies at will. This could amplify an initial attack, for example, by allowing the attacker to create or modify policies to elevate permissions assigned to compromised clients.
Any request that creates or modifies a policy will appear in your audit logs with a request.operation value of update and a request.path value of either /sys/policy or /sys/policies. The contents of the policy—contained in the request.data.policy field—are hashed, so you can’t determine whether the policy introduces a security risk just by reviewing the audit logs. However, it can be helpful to monitor any unexpected calls to these request paths, as they could indicate possible policy tampering.
For example, the following command from the Vault documentation posts a file named admin-policy.hcl to the Vault API to create a policy named admin (or update the admin policy if it already exists):
vault policy write admin admin-policy.hcl
When Vault executes this command, it adds a JSON string to the audit log similar to the one shown below.
{
"time": "2021-09-16T21:00:26.278324829Z",
"type": "request",
"auth": { [...] },
"request": {
[...]
"operation": "update",
"mount_type": "system",
[...]
"path": "sys/policies/acl/admin",
"data": {
"policy": "hmac-sha256:[...]"
},
"remote_address": "127.0.0.1"
}
}
If your audit logs indicate that your policies have been modified and you suspect malicious activity—for example, if the change was made using a root token or by a user who doesn’t typically manage your policies—you may need to verify that no inappropriate permissions have been assigned. Vault recommends managing your policies in version control, which makes it easy to spot any suspicious changes to your policies.
To detect potential malicious activity in your Vault installation, Datadog Cloud SIEM automatically analyzes Vault audit logs as they’re ingested. You can use Datadog to continuously monitor your Vault audit logs for signs of any of the security threats we looked at in the previous section. Datadog also gives you visibility into your Vault server logs, which can help you understand your server’s performance and provide context around the information in the audit logs. In this section, we’ll show you how Datadog provides automated threat detection and alerting so you can be sure your secrets are secure.
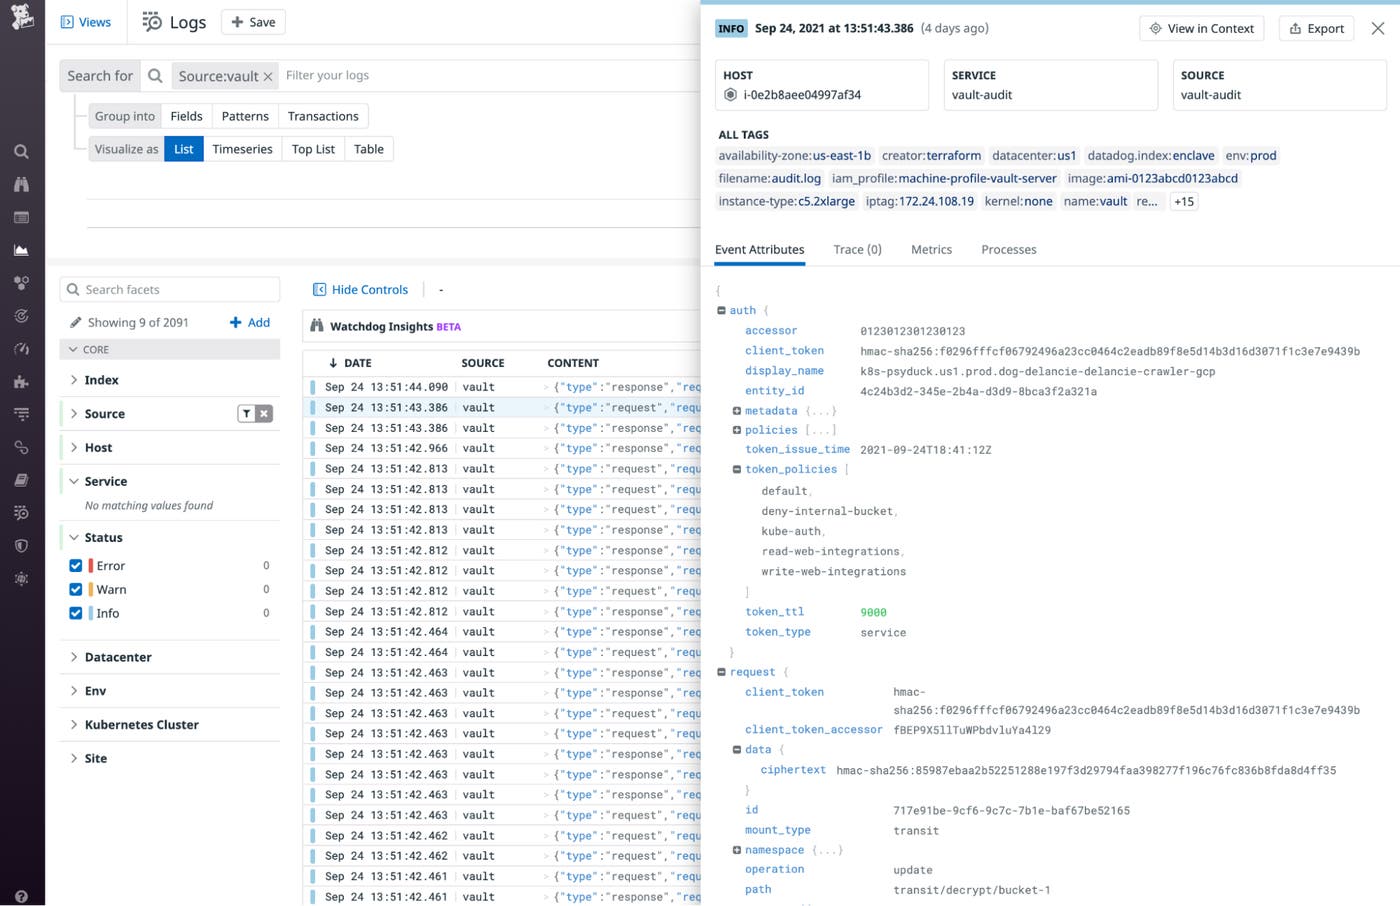
Datadog’s Vault integration lets you collect Vault metrics so you can understand its performance, as well as Vault audit logs to use as the basis for automated security monitoring. To monitor Vault security with Datadog, you’ll need to enable both Vault auditing and the Vault integration. And you’ll need to configure the integration to collect your Vault logs, as explained in Part 3 of this monitoring guide. As your Vault audit logs come into Datadog, log pipelines automatically parse and enrich them, so you can easily search for them (e.g., by source:vault) in the Log Explorer, as shown in the screenshot below. The highlighted log shows the attributes you can use to search, filter, and analyze your Vault audit logs. See the documentation to learn how to filter, aggregate, and visualize Vault log data in Datadog.
Datadog Cloud SIEM’s out-of-the-box security rules help detect potentially malicious activity in your Vault audit logs. If a log violates a security rule, Datadog automatically generates a security signal that provides information to help you triage the issue. You can use these out-of-the-box security rules to automatically jump-start your Vault monitoring. The screenshot below shows an example of the security signal generated by the root token usage rule, and could indicate that a malicious actor is trying to escalate their privileges.
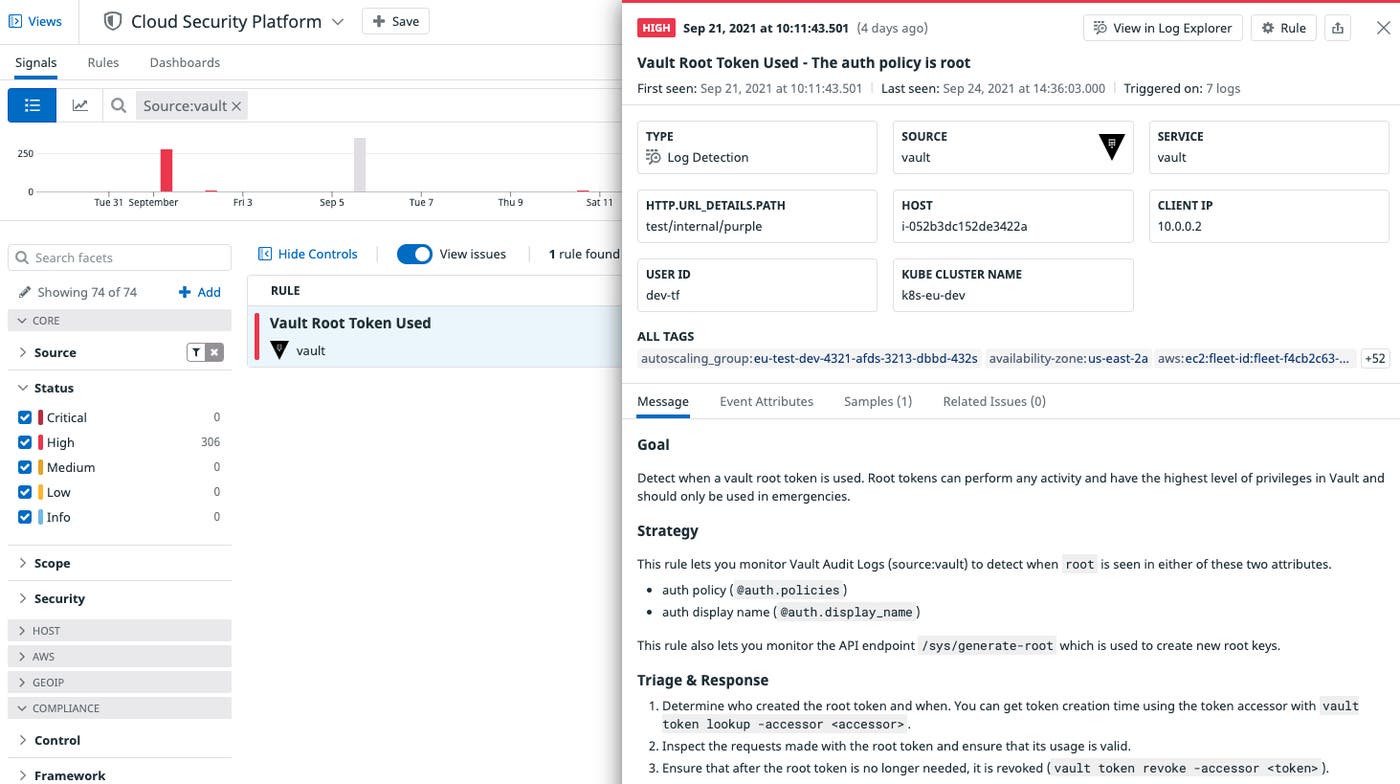
A root token allows an attacker to access Vault secrets and modify Vault policies, so it’s important to detect and investigate anytime one is created or used. There are valid reasons for using a root token, but Vault recommends limiting their use, so this rule can also help you ensure that you’re following best practices. You can also leverage custom security rules targeted to your specific Vault use case, either by creating a new rule or cloning and modifying a built-in rule. For example, Datadog provides a rule that detects high TTL values on Vault tokens. Excessive TTL values can weaken your security by increasing an attacker’s window of elevated privileges. The safest value for a TTL depends on how you use Vault—for instance, you may use a six-hour TTL for user tokens but a one-hour TTL for tokens issued to your cloud provider. You can clone the built-in rule to create one or more custom rules, revising auth.token_ttl to an acceptable value for each use case. Security rules like this use your Vault audit logs as the basis to detect possible attacks, but you can also create rules based on other logs to gain a broader security perspective. For example, if any of your Vault hosts are accessible from the internet, you can create a rule to detect failed login attempts in your Vault host’s authentication log (e.g., /var/log/auth.log).
Datadog dashboards give you customizable visualizations of more than 1,000 technologies. Our out-of-the-box Vault dashboard visualizes activity and performance metrics from your Vault cluster and shows you Vault logs so you can analyze trends in Vault activity and spot changes that could indicate a security concern.
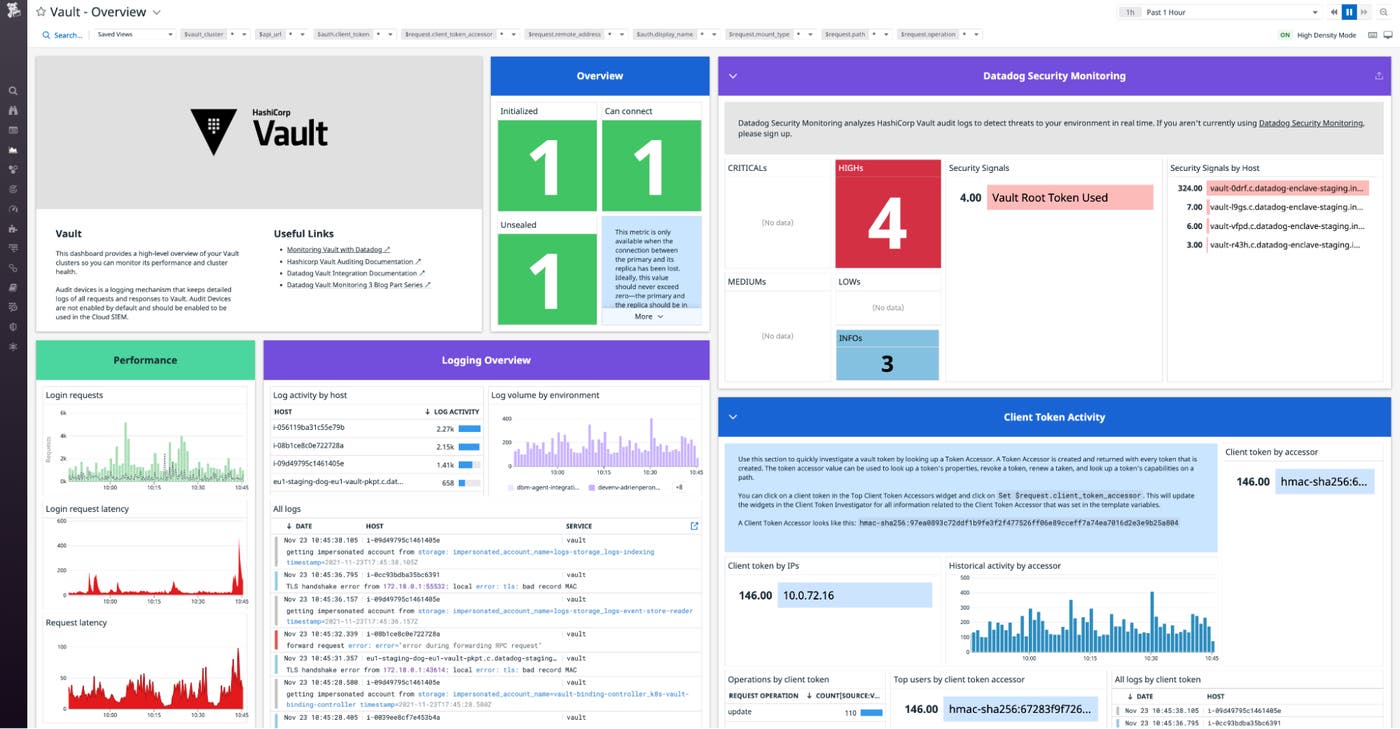
Your Vault Security dashboard will often show typical patterns—such as a high ratio of update and read operations compared to delete and list operations, as seen in the Vault Operations widget. But your use case may generate some unique patterns, too, and the dashboard can help you quickly identify any variations from expected behavior.
See Part 3 of this series for more information about visualizing, analyzing, and alerting on Vault logs with Datadog.
If you rely on Vault to securely manage your secrets, now you can use Datadog to ensure Vault itself is secure. Datadog provides Cloud SIEM alongside infrastructure and application monitoring for more than 1,000 technologies in a single platform. See our complete monitoring guide for a deep dive into monitoring Vault. And if you haven’t already started using Datadog, sign up for a free trial today.
此内容由惯性聚合(RSS阅读器)自动聚合整理,仅供阅读参考。 原文来自 — 版权归原作者所有。