






In Part 1 of this series, we talked about some challenges with building sufficient coverage for detecting security threats. We also discussed how telemetry sources like logs are invaluable for detecting potential threats to your environment because they provide crucial details about who is accessing service resources, why they are accessing them, and whether any changes have been made. But in large-scale environments that generate a considerable number of logs, you can easily overlook signs that your application is compromised without adequate security coverage. Datadog Cloud SIEM already provides an extensive set of out-of-the-box (OOTB) detection rules to help you efficiently cover the majority of threat scenarios. But we also enable you to build log-based detection rules that are based on your unique business cases and automatically identify malicious activity, so you can cut through the noise and mitigate threats before they become more serious.
In this post, we’ll walk through some best practices for creating powerful detection rules for your applications. We’ll discuss how to:
Build efficient queries that extract the most critical security-related events from application logs
Use templates and template variables to create informative signals
Create suppression lists to reduce the number of false positives
But first, we’ll briefly look at how log-based detection rules work in Datadog Security.
Datadog Cloud SIEM’s detection rules query ingested logs for key activity or changes in your environment in order to detect potential threats to your applications in real time. There are five detection methods available:
Threshold: detects when an event’s rate of occurrence exceeds a user-defined threshold
Anomaly: identifies behavior that deviates from its historical baseline
New Value: detects when a log attribute changes to a new value
Impossible Travel: detects implausible, back-to-back user activity between two geographic locations
Third Party: forwards alerts from a third-party vendor or application
Rules use Datadog’s flexible search syntax, enabling you to build highly customizable queries to fit your needs. For any incoming log that matches a detection rule, Datadog will apply conditional logic (i.e., rule cases) in order to set severity levels and prioritize security signals, which provide more context for mitigating the issue. For example, a detection rule that monitors for anomalous account activity, such as a user suddenly making a substantial number of API calls, will generate a security signal that includes details about the user’s account, the nature of their requests, and which IP addresses are making the calls.
Datadog’s OOTB detection rules are designed to help you focus on legitimate security threats that are specific to your environment, which helps you reduce alert fatigue. Next, we’ll look at best practices for building efficient detection rules that ensure you are only generating signals for real threats to your applications and not for legitimate activity within your organization.
As mentioned in Part 1, you can build a lean, efficient set of detection rules that flag threats across a wider range of environments and resources by first preprocessing your log and audit data. Then you can further customize and filter rule queries by key log attributes, including standard attributes that Datadog uses to unify and enrich logs across all data sources. This capability enables you to enhance queries with details such as the geolocation of an IP address (e.g., continent, country, city) or the status code of an HTTP request, so you can easily target the individual services, accounts, or events you want to monitor. And since queries leverage the same search syntax as the rest of the Datadog platform, you can use Datadog’s Log Explorer to confirm that they pull in the appropriate results for your detection rule in order to prevent false positive signals.
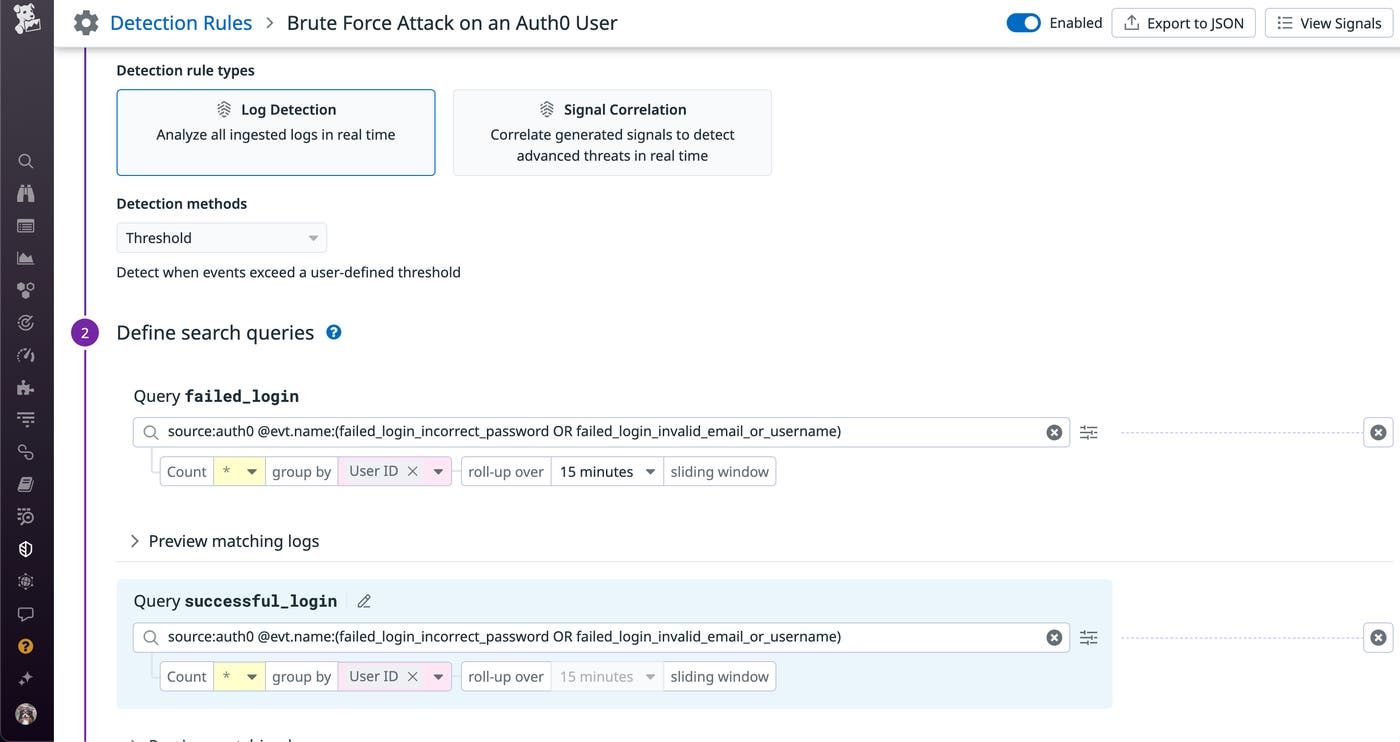
The example rule above uses Datadog’s threshold detection type to monitor logs for several successful and unsuccessful login attempts within a five-minute window. This type of activity is indicative of a brute force attack, which occurs when an attacker methodically guesses an account password in order to gain access. The rule’s query leverages log attributes to filter down to a specific type of log (evt.name:authentication) and login event (evt.outcome:success or evt.outcome:failed), which provides the most accurate information about who is attempting to access an account and whether they were successful. The rule then applies conditional logic to determine the severity of the attack—several failed login attempts followed by a successful one indicates a breach.
In addition to the threshold-based example above, you can also use log attributes in anomaly- and new value-based rules to monitor for specific changes in your environment, such as a GCP service account generating an unusual amount of API calls or a user logging in to your application from a new geographic location.
Security signals provide important details about activity flagged by a detection rule, including a customizable message that you can use to share security policies, remediation steps, and more. Datadog’s detection rules use a standard template that includes the following information:
The detection rule’s goal
The strategy for detecting the attack or malicious behavior
Steps for removing the threat and securing the affected application’s resources
Tags that are mapped to security and compliance frameworks (e.g., MITRE ATT&CK, CIS)
This signal message template creates consistency for your organization and ensures that security teams always have the information they need to troubleshoot application threats. You can also generate custom signals for your environment by using template variables, which inject key attributes and dynamic links into a message.
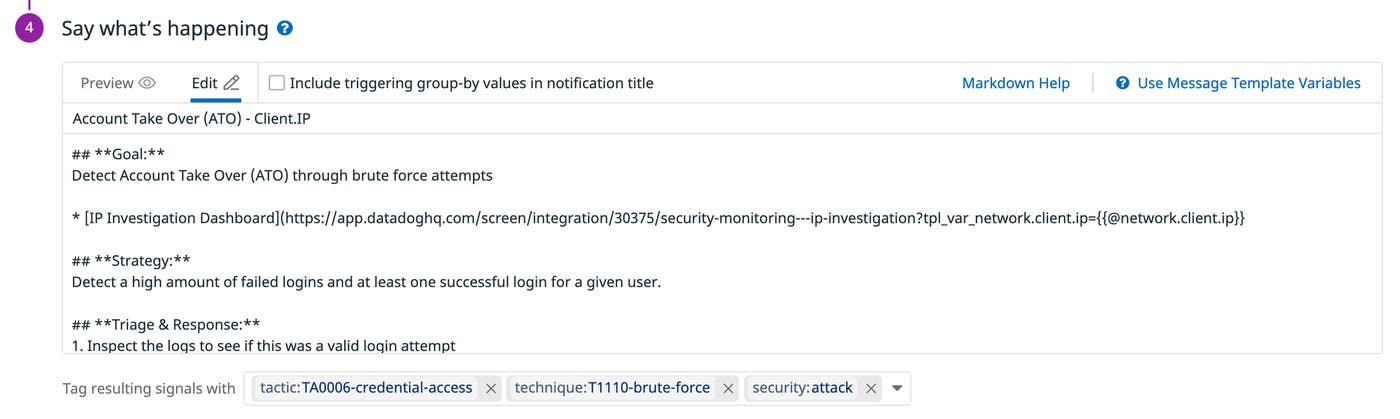
The example message template above provides critical details for triaging attempts to take over an account, including relevant tags that are mapped to specific MITRE tactics and techniques for more context. We also added the {{@network.client.ip}} template variable in order to dynamically link to one of Datadog’s security dashboards. When a signal is generated, it will include a direct link to the dashboard that is automatically filtered for the flagged IP address, which helps accelerate investigation efforts.
Security signals alert you to application threats but can also generate false positives from innocuous activity. For example, load testing an application generates a sudden influx of requests, which may trigger a large number of security signals. These false positives make it more difficult to identify real threats to your application.
You can reduce the number of false positive signals by using suppression lists, which include users, services, processes, and other activities that are known to be safe in your environment. To create a suppression list, click on the “Advanced” option for a detection rule and add the values that you want to exclude.
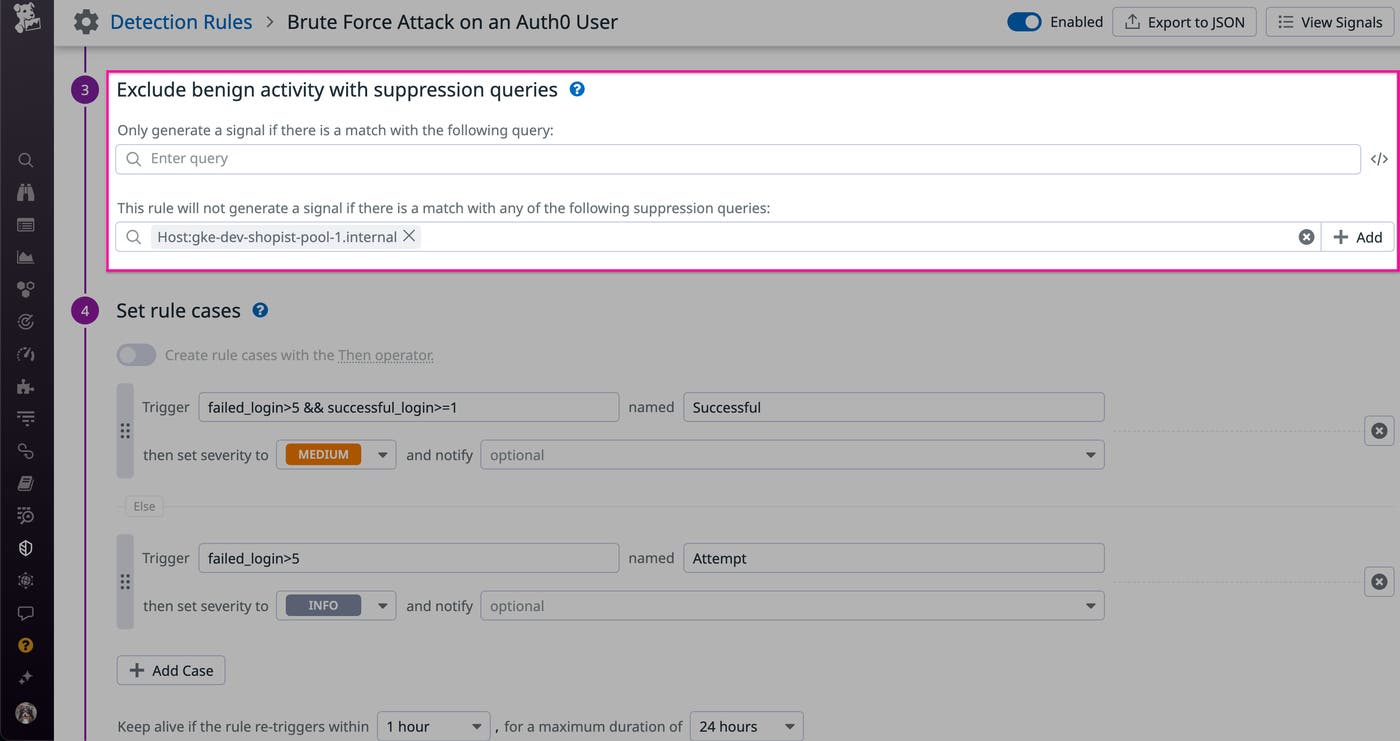
The example rule above monitors AWS CloudTrail API calls to detect when a user makes an Amazon EC2 AMI public. If Datadog creates a signal, you can work with the user to determine whether the action was legitimate and if you need to add the flagged image to a suppression list, as seen above. This configuration prevents the detection rule from generating another signal if a user makes the AMI (e.g., image:ami-06gh1fd1234c1f123) public again.
You can also create a suppression list by clicking on an attribute or tag in a security signal and selecting the “Never trigger signals for’’ option. This can be useful for suppressing alerts from other types of identifiers, such as a list of IP addresses or user IDs, directly from generated signals.
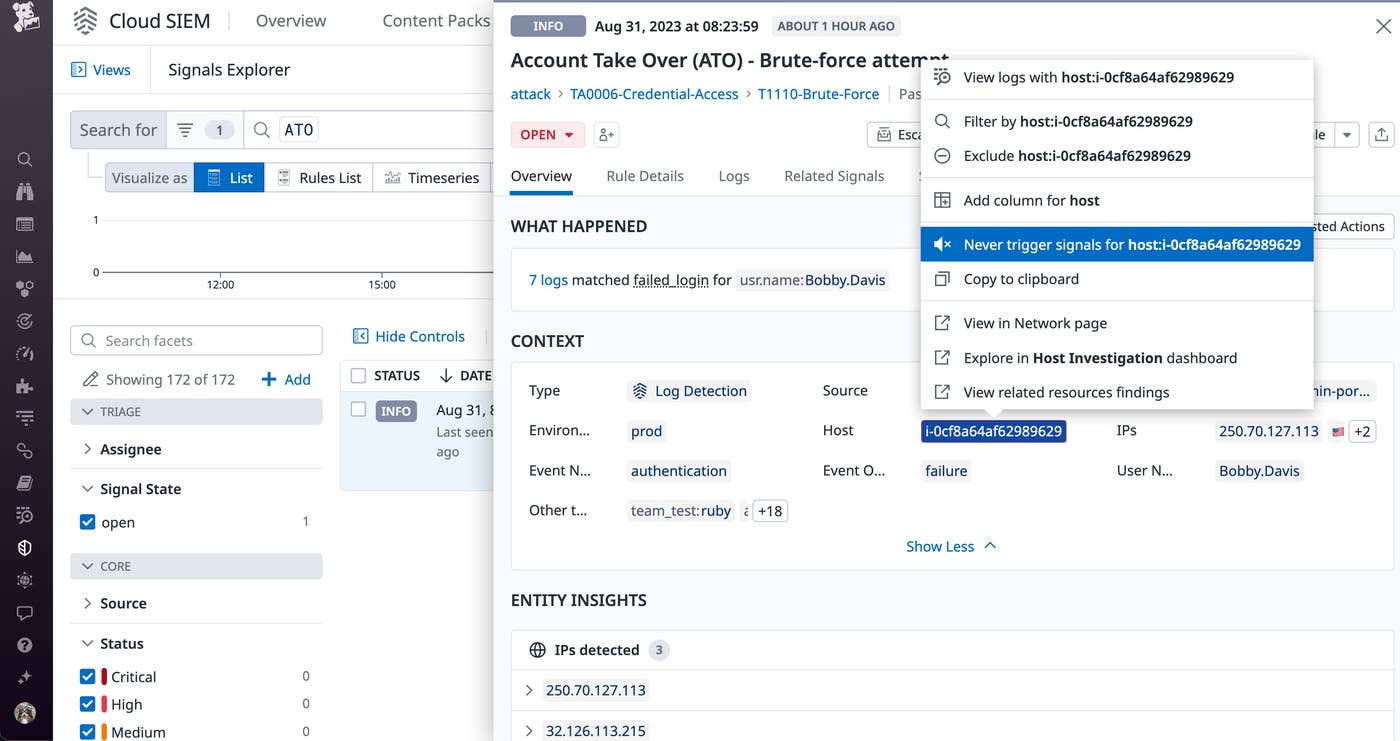
In the example screenshot above, we are filtering out activity from a known host so we can ignore it in order to focus on legitimate threats.
In this post, we discussed how efficient queries, actionable signal messages, and suppression lists can help you create custom detection rules that enable you to quickly identify—and mitigate—application threats. Datadog also provides out-of-the-box rules that detect critical security and operational issues across your AWS, Azure, or GCP environment with minimal setup. Check out our documentation to learn more about the Datadog Cloud SIEM and its features. If you don’t already have a Datadog account, you can sign up for a free 14-day trial today.
此内容由惯性聚合(RSS阅读器)自动聚合整理,仅供阅读参考。 原文来自 — 版权归原作者所有。