










Candace Shamieh

Yoann Moinet

Derek Howles

Rachel White
Blind spots in frontend monitoring can occur when you’re managing complex modern applications. Browser and device variability, user journeys with intricate workflows and multiple touchpoints, and ephemeral frontend components can all create visibility gaps that make it difficult to identify, understand, and resolve the issues impacting user experience.
Here at Datadog, we’ve faced our own challenges with frontend monitoring. Before we started using our digital experience monitoring (DEM) products, we experienced flaky acceptance tests, tool sprawl, and limited visibility into user behavior. While brainstorming about how to address these challenges, we realized that enhancing our own DEM products could potentially remove these pain points. Before fully committing to a migration or introducing new products into our existing workflows, we explored ways to reinforce the DEM offerings to better meet our needs, and in turn, the needs of our customers.
In this post, we’ll discuss how using Synthetic Monitoring, RUM’s Session Replay, and Error Tracking enables us to catch problems before they affect users and accelerate debugging.
Before migrating to Synthetic Monitoring, we used acceptance tests during the QA process. These tests were often flaky, difficult to maintain, and had to be written manually. Each acceptance test took about 35 minutes of machine time per commit, a metric which directly correlates to cost. At the time of our migration, we had to maintain over 565 tests.
Synthetic Monitoring enables us to create browser tests instead, which take about eight minutes of machine time per commit, resulting in cost savings, and—because they are fully managed—no platform maintenance is required. Powered by AI, Synthetic browser tests are self-maintaining, automatically responding to application changes so that we don’t receive false positive alerts due to flaky tests. They also run much faster than acceptance tests because we are able to manage key configurations—such as timeout and rerun settings—at a granular level. These configuration options enable us to minimize runtime duration, avoid excessive retries, and ensure that retry intervals are adequately long before the next attempt.
Here’s a code snippet that illustrates our configuration settings for the browser tests:
// To write in the file "datadog-ci.json" at the root of your repository
// or to pass to "datadog-ci synthetics run-tests --config datadog-ci.json"
{
// Ensure the full batch remains bellow 20min.
"batchTimeout": 120000,
// Automatically retry the batch, but only the failed tests.
"selectiveRerun": true,
// Reject the run if it takes longer than configured
"failOnTimeout": true,
"defaultTestOverrides": {
// Ensure a test doesn't take more than 5min.
"testTimeout": 300,
// Ensure a step doesn't take more than 1min.
"defaultStepTimeout": 60,
// Retry a failure twice, waiting 5s in between.
"retry": { "count": 2, "interval": 5000 }
}
}
Whenever we consider using a new tool to alleviate pain points, we know that it must be able to account for the high velocity at which we work. The sheer number of contributors to our codebase every day means that engineers can potentially write conflicting code and features. From previous change management efforts, we’ve learned that implementing any new tool into our workflows requires careful planning, buy-in from our engineers, and an incremental approach.
For context, we have more than 525 authors contributing to our codebase, and over the course of a week, they’ve pushed about 6,300 commits.
Because we used acceptance tests so extensively, we decided to gradually transition to Datadog Synthetic browser tests over the course of one year. Migrating to browser tests incrementally enabled us to establish trust in the new workflow, minimize the risk of testing gaps, and gave us the time necessary to build new tools along the way that would further enhance Synthetic Monitoring. We accomplished these goals by implementing a non-blocking job in our CI/CD pipeline that enabled engineers to add new browser tests without the fear of adversely impacting other teams or end users. The non-blocking job was completely new tooling, helping us continuously test our application in the midst of the migration and meet our needs at scale. It was out of this effort that Datadog Continuous Testing came to be, a product widely used by our customers. An incremental approach also gave our engineers the time and opportunity to become familiar with the new technology and workflow, leading them to fully support the migration.
Datadog Continuous Testing enables us to run and monitor Synthetic test executions in our CI/CD pipeline, including our browser tests. Continuous testing ensures that each release is tested and validated, verifying that new changes won’t break the application before deploying to production. It triggers a batch of Synthetic tests that run in parallel and uses the results to evaluate whether the release meets a specific set of criteria. If the batch succeeds, the deployment process continues to the next step, but if one of the tests fails, the deployment is aborted.
Continuous testing also enables us to test in multiple environments, including private environments. We reuse scheduled Synthetic tests from our production environment to test our application in pre-production, specifying overrides as needed. Because we have one test suite that can be tailored to fit every use case, we’ve successfully broken down silos between our development, QA, product, and operations teams. If a reused scheduled test fails in pre-production, it remains completely unaffected in our production environment, meaning that the test will still run as expected and no production monitors will trigger. Having this flexibility to reuse managed Synthetic tests at any point in our CI/CD pipeline eliminated the need to maintain separate testing scenarios for each stage in the development process.
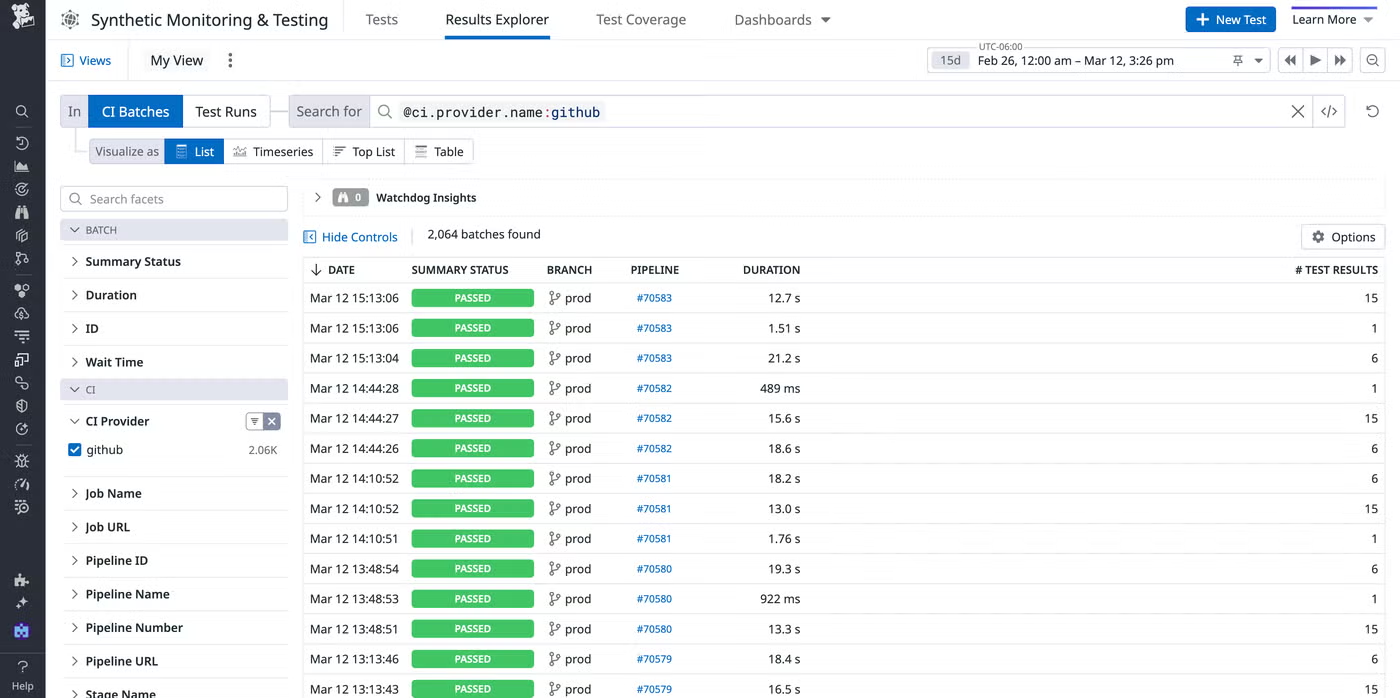
Because of the size of our organization, we run the risk of triggering a self-inflicted DDOS attack when running a large number of tests simultaneously. In our environment, a batch contains 760 tests. Every 24 hours, we trigger 3,500 batches. To avoid a self-inflicted DDOS attack, we adhere to the following practices:
Here’s a code snippet that shows how we randomize regions:
// A helper function to hash a string.
const hashString = (stringToHash: string) => {
let hash = 0;
for (let i = 0; i < stringToHash.length; i++) {
hash = (Math.imul(31, hash) + stringToHash.charCodeAt(i)) | 0;
}
return hash;
};
// A helper function to generate a random number deterministically between 0 and 1.
const deterministicRandom = (seed: number) => {
const x = Math.sin(seed) * 10000;
return x - Math.floor(x);
};
// A helper function to deterministically shuffle an array.
const deterministicShuffleLocations = (array: any[]) => {
// We use the commit SHA as seed to deterministically shuffle the locations
// and ensure we always have the same sort for the same given commit.
const commitSha = process.env.CI_COMMIT_SHA ?? "";
// Hash it into a number.
const seed = hashString(commitSha);
// Copy the array to avoid mutating the original.
const shuffledCopy = [...array];
// The remaining number of elements to shuffle.
let remaining = array.length;
// The index of the element to swap.
let indexToSwap;
// The seed we'll use to generate a random index.
let randomSeed = seed;
// While there remain elements to shuffle…
while (remaining) {
// Compute the index of a remaining element to swap.
indexToSwap = Math.floor(deterministicRandom(randomSeed) * remaining--);
// Swap both elements.
[shuffledCopy[remaining], shuffledCopy[indexToSwap]] = [
shuffledCopy[indexToSwap],
shuffledCopy[remaining],
];
// Increment our random seed to get a different result for the next iteration.
++randomSeed;
}
// Done!
return shuffledCopy;
};
const locations: string[] = deterministicShuffleLocations([
// The list of locations we want to use in our batches.
]);
Since we’re such heavy users of Continuous Testing, we have to strategically manage the load on our infrastructure. With these precautions in place, we can run over 760 tests a time without adversely impacting our CI/CD pipelines or overwhelming our resources.
Prior to using RUM, we relied on Datadog Log Management for frontend monitoring and troubleshooting. Logging enabled us to analyze application workflows and provided us with helpful information about errors, but couldn’t help us whenever an issue arose that was directly related to the user’s perspective. While we still use Log Management to monitor specific frontend use cases and perform in-depth and historical analysis of our environment, adding RUM has provided us with granular insight into user actions, like clicking and hovering, while Session Replay offers maximum visibility into user journeys. Equipped with this newfound insight and visibility, we’ve made intentional, data-informed decisions to redesign our UI and can quickly resolve issues impacting our users.
Before Session Replay, we had a much harder time finding useful information that could help us investigate UI-related issues. For example, let’s say our Technical Solutions team reached out to us to escalate an issue from a customer who was unable to save a graph to a dashboard. Since logs don’t provide any specific insight into the root cause, we would need to sift through error logs or create queries and filters to troubleshoot the issue. Session Replay has significantly aided these types of investigations, not only by enabling us to view the app from the user’s perspective but also by providing us with precise reproducibility. By using Session Replay, we can reproduce bugs and the steps that a user took to trigger an issue. This reduces the time it takes to identify what went wrong and enables us to gain an in-depth understanding of the exact conditions that caused an issue.
Error Tracking groups similar unhandled errors and exceptions together, giving us a full picture of an issue. It provides insight into the size and impact of an incident, and helps us understand the context in which an issue occurred. Directly within an Error Tracking issue, we can view related logs, traces, and RUM telemetry, like the click action event that generated the error, and quickly pivot to Session Replay to see the full user session.
Before transitioning to Error Tracking, we lacked this full picture and were using only one, isolated product at a time in order to debug frontend issues. We would investigate issues one by one, and engineers would use a different tool depending on the error type. Over time, tools accumulated, and because those tools were siloed, our engineers would have to switch back and forth between them to obtain all the context necessary to resolve an issue. By choosing Error Tracking as our primary debugging tool, we eliminated tool sprawl, streamlined our investigative workflows, and gained centralized access to critical information that helps us pinpoint root causes faster.
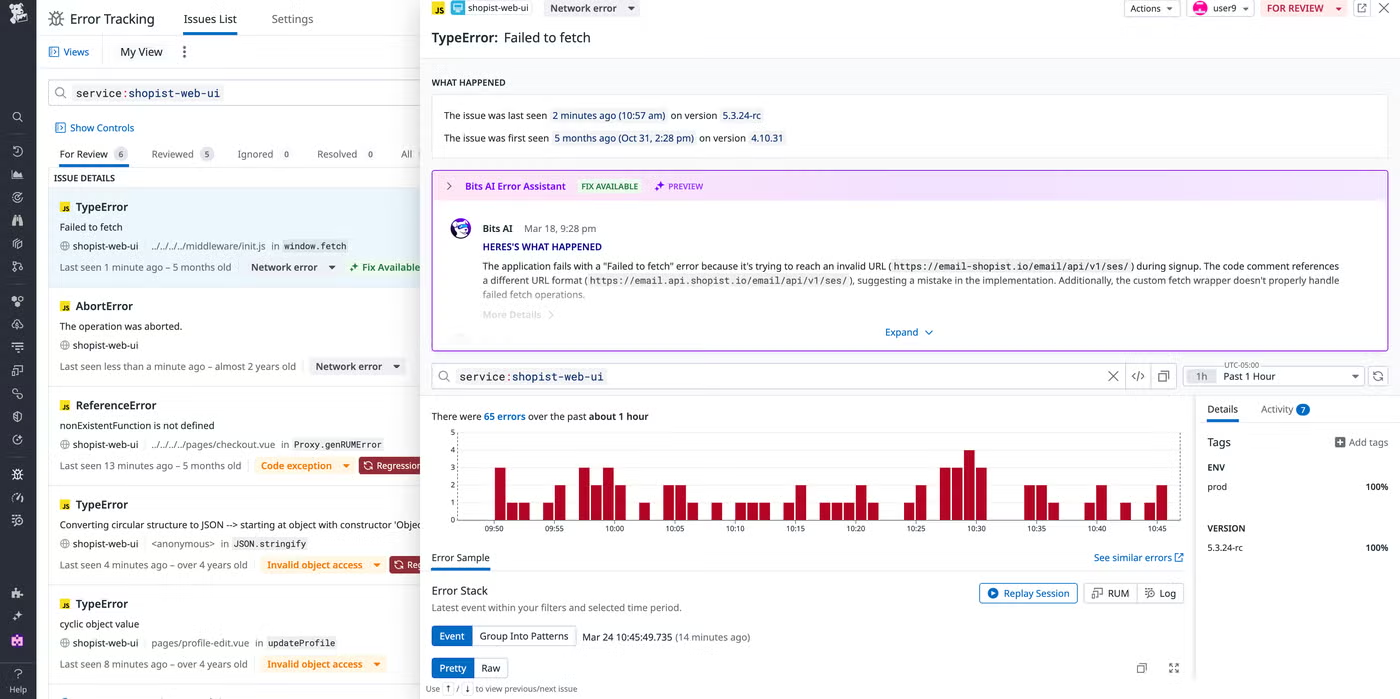
We also use custom Error Tracking monitors that alert us if a new Error Tracking issue is generated or if the error count exceeds the configured threshold.
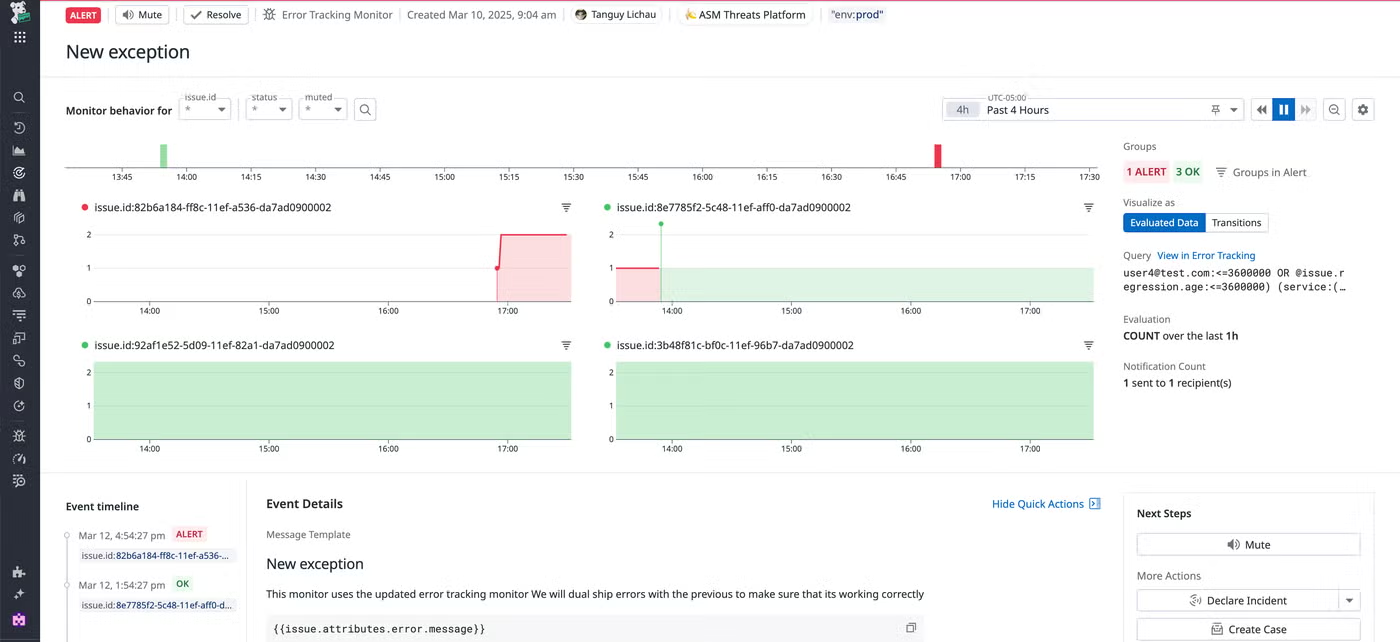
By using Session Replay and Error Tracking along with Log Management, we have end-to-end visibility of frontend issues that arise, accelerating mean time to resolution (MTTR).
Using our own DEM products reduced friction in our frontend testing and debugging, enabling us to ship high-quality features faster and quickly address any issues impacting our users. Transitioning to Datadog Synthetic browser tests resulted in less flakiness, minimal maintenance, reduced costs, and eliminated the need to script anything manually. Datadog Continuous Testing enabled us to run tests in parallel, at scale, and in multiple environments. Incorporating Session Replay into our debugging process increased our visibility into the user experience and gave us the ability to reproduce bugs so we can swiftly find root causes. Error Tracking streamlined our investigative workflows and simplified the troubleshooting process by embedding critical contextual information within each issue.
See our documentation to read more about implementing Synthetic Monitoring, Continuous Testing, Session Replay, and Error Tracking into your own environment. You can learn more about Datadog’s engineering culture and take an in-depth look at different engineering solutions on our engineering blog.
If you don’t already have a Datadog account, sign up for a free 14-day trial today.
此内容由惯性聚合(RSS阅读器)自动聚合整理,仅供阅读参考。 原文来自 — 版权归原作者所有。