


As your organization adopts modern technologies and scales its workloads, it’s critical that your CI/CD environment follows suit to maintain smooth development and testing workflows. Adopting modern CI/CD tools (e.g., pipeline runners and testing frameworks) and best practices can increase the agility and resilience of your CI/CD environment as well as enable your teams to configure new jobs, stages, and tests to meet changing business requirements. However, this modernization process can be lengthy and complex, especially if it requires migrating your pipelines to a new CI/CD provider.
Datadog enables you to gain visibility into your entire CI/CD environment even as you progressively modernize its different components. Whether you choose to operate self-hosted runners or use a cloud-hosted provider for flexible, on-demand compute, you’ll be able to gain insights into your pipelines’ performance and reliability and quickly troubleshoot failures and other issues. In this post, we’ll cover:
Reasons to modernize your CI/CD
How to monitor your pipelines and deployments across different providers
How to gain full visibility into your CI/CD stack
For many years, Jenkins was the go-to solution for organizations looking for build automation and CI/CD. However, as the CI/CD landscape has matured, other solutions such as GitLab, GitHub Actions, CircleCI, and Azure DevOps have emerged, along with continuous delivery tools such as ArgoCD and Octopus Deploy. While Jenkins offers highly customized instances and configurations through its vast library of open source plugins, this can create challenges when your organization is attempting to scale up your CI/CD infrastructure.
Maintaining servers, navigating frequent plugin updates, conducting performance audits, and debugging pipeline failures all require developers who are highly knowledgeable in Jenkins. For most engineering teams, this depth of knowledge only applies to a few developers. Without proper visibility into their pipelines and runners, DevOps engineers can struggle to debug and maintain their Jenkins pipeline after its initial configuration, which can lead to plugins falling out of date and performance or reliability issues as new jobs and tests are added.
Many organizations running Jenkins also have a reactive stance when dealing with CI/CD outages and performance issues. The following example outlines a typical response workflow from a DevOps engineer when a pipeline fails:
Receive a large volume of pipeline failure alerts from Jenkins via Slack.
Pivot to Jenkins to inspect logs and JSON files from recent pipeline executions to identify particular jobs or stages that are failing.
Open GitHub and attempt to manually correlate attributes such as pipeline ID, runner ID, and Git SHAs with the previous Jenkins logs.
SSH into the pipeline runner environment, re-run the pipeline with tracing enabled, and monitor local issues or misconfigured infrastructure.
Once the issue is resolved, comb through the failed pipelines, broken merge trains, and prioritize any urgent security or usability fixes that were blocked due to the broken pipeline.
Although this workflow may be sustainable for smaller-scale organizations with infrequent updates to their production code, enterprise organizations and high-growth startups cannot afford to lose substantial amounts of developer productivity when features break in pre-production. Pipeline failures can cause multi-day stops to development, block urgent security or usability patches, and ultimately lead to hundreds of thousands of dollars in lost productivity.
Newer CI/CD runners have been built specifically to address these issues, especially when used with observability tools that enhance pipeline visibility and enable contextual debugging. Adopting the following technologies and best practices can help you streamline your troubleshooting workflows and proactively monitor and remediate degrading pipelines and performance regressions before they impact your broader organization:
Infrastructure-as-Code (IaC) tools such as Terraform enable developers to deploy additional infrastructure and services using automated workflows and change pipeline configurations with simple config files.
Autoscaling runners will automatically spin up or scale down the number of active virtual machines in response to changes in load and optimize for cost-efficiency. This feature can be manually configured via Kubernetes and self-hosted runners or enabled with managed solutions such as GitLab and GitHub Actions.
Running jobs, stages, and tests in parallel can decrease your average pipeline runtimes and drive shorter delivery cycles.
SaaS-hosted and managed CI/CD infrastructure offer simple-to-use CI/CD solutions while handling the challenges of resource provisioning. Pay-as-you-go models provide stable pipeline execution times regardless of internal demand.
Tracing CI/CD runs throughout your environment can help you quickly gather critical context when troubleshooting issues. Using flame graphs, you can visualize pipeline executions and test runs as well as access logs, infrastructure and performance metrics, network info, and more for each stage and job to help you identify the root source of performance regressions or failures.
Centralize management and monitoring for the software delivery process by adopting platform engineering best practices, and consider building an internal developer platform.
When modernizing your CI/CD infrastructure, the biggest change you’ll likely undertake is migrating to a new CI/CD provider. This process can take months—even years for organizations that have thousands of applications—and needs to be approached with careful thought and consideration. The following example outlines possible steps an organization would take when migrating their pipelines:
Internal CI/CD audit: Assess the current size, scope, and costs associated with your existing CI/CD environment. Establish a baseline for performance that you want to meet or exceed as part of the migration.
Evaluate available pipeline providers: Consider pricing, scalability, long-term vision, and vendor lock-in when evaluating the benefits of a new provider. There are many potential offerings to consider, and even more potential configurations.
Test-run a selection of non-critical pipelines: After you’ve selected a potential candidate, configure a small selection of pipelines to use the new CI/CD pipeline runner and compare its performance, reliability, and ability to scale against your benchmark.
Temporarily replicate your CI/CD environment: Before beginning the migration, duplicate your PR process on the new provider and set up blocking deployment gates. Conduct internal tests to ensure consistency and compatibility across builds, tests, and deployments. This can help identify any major issues before rollout.
Rollout: Document changes, train internal teams, and schedule a progressive migration. Continuously monitor the performance and reliability of the new pipeline runner as you migrate your pipelines.
Post-migration validation: Continue to trace and monitor all new pipeline executions to verify that the migrated workflows are working as expected. Begin leveraging your new tools and best practices to rapidly identify and debug any issues that arise.
Optimization and continuous improvement: Continue to leverage your new sets of tools to improve the efficiency, reliability, and performance of your CI/CD.
It’s important to note that migrating providers is only the first step to improving your development workflows. You’ll also need to implement tools such as monitors that alert on key performance metrics for your CI/CD infrastructure, as well as dashboards that help you establish accurate baselines for performance and evaluate long-term trends following the migration. To establish a baseline, you can connect your Jenkins instances to Datadog by enabling the native Jenkins Plugin and start tracing, ingesting, and monitoring your current CI/CD environment in just a matter of minutes. To start evaluating newer providers like GitHub Actions or GitLab, you can connect your Datadog account with our out-of-the-box (OOTB) integrations directly from the Datadog UI. You can learn more about effectively troubleshooting CI/CD issues with Datadog, establishing baselines for pipeline performance, and tips for configuring monitors in our CI/CD best practices post.
Once you’ve selected a new provider, you can use Datadog’s dashboards for insights into your new runner’s performance, post-migration validation, or long-term trends to identify areas in need of improvement. For example, the OOTB pipelines dashboard helps you track the overall success rates of your pipelines, as well as pipelines and jobs experiencing recent slowdowns and frequent failures. By filtering the dashboard to your new provider, you can monitor whether newly migrated pipelines are performing as intended and quickly highlight the pipelines that require attention.
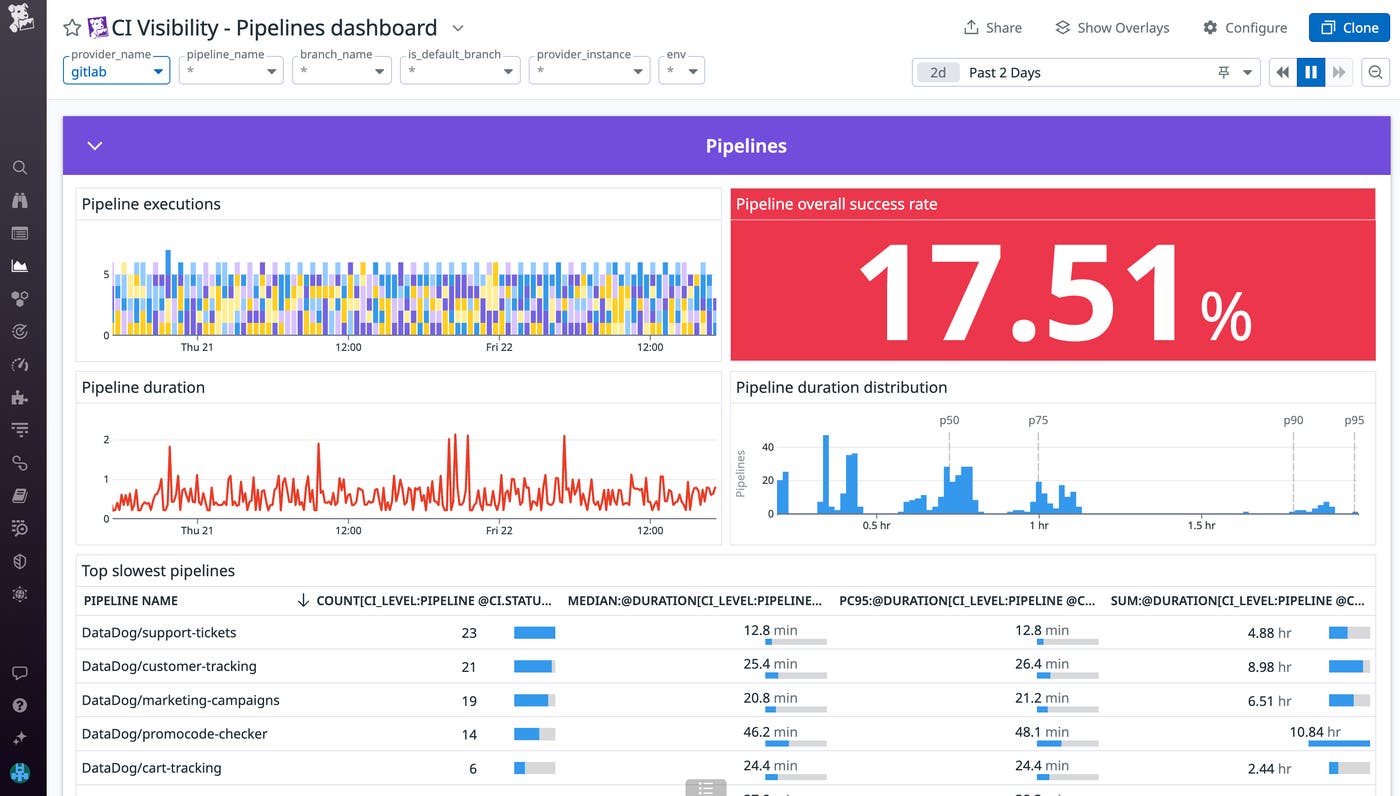
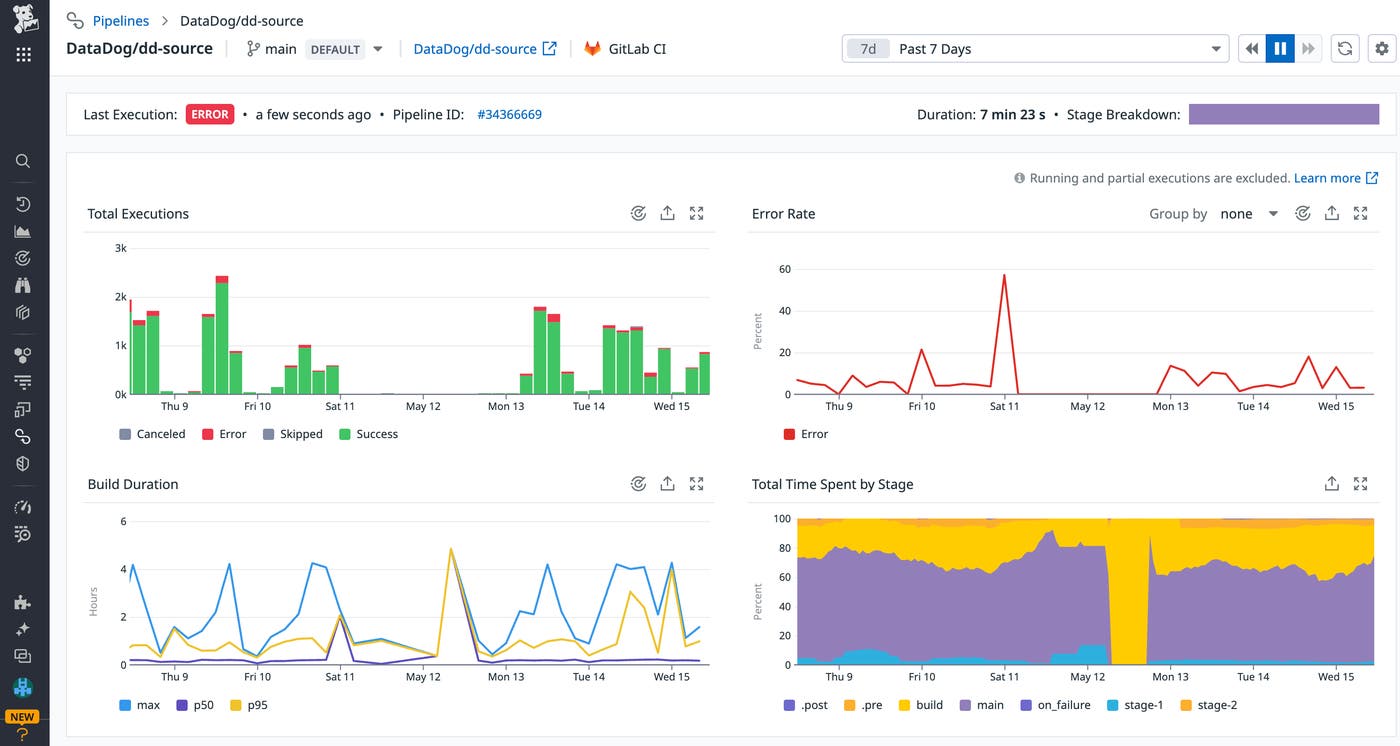
Issues related to incorrect syntax and configuration can often manifest in the source and pre-build stages, when your pipeline is validating code changes and setting up your build environment. You can tie recent and frequent failures to a specific stage or job by viewing the top failed stages and jobs in the Pipelines dashboard. If you notice that your pre-build stages are frequently failing, you can view related pipeline executions to troubleshoot further. You can also track the performance of specific pipelines post-migration by inspecting the pipeline in CI Visibility as shown below. This enables you to compare job durations before and after your migration. It also helps you verify that new optimizations, such as increased job concurrency, are resulting in faster end-to-end execution times.
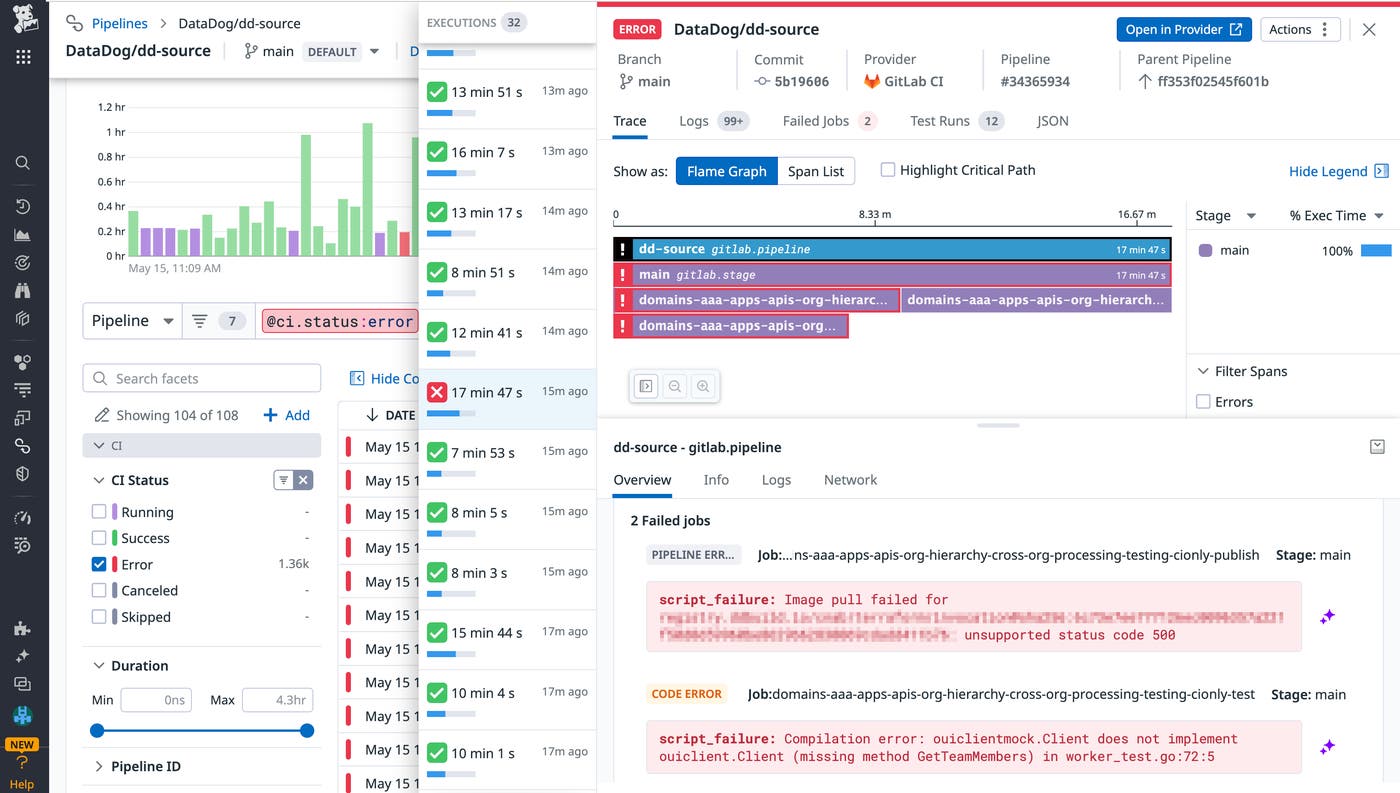
Once you’ve identified any issues with your pipeline being run on the new provider, you can drill into its executions for a full end-to-end trace that includes relevant logs, pipeline attributes (runner ID, Git commit info, etc.), and relevant CI infrastructure information. This context can help you point to the root cause of any regressions or failures, without needing to manually correlate clues across different tools and views.
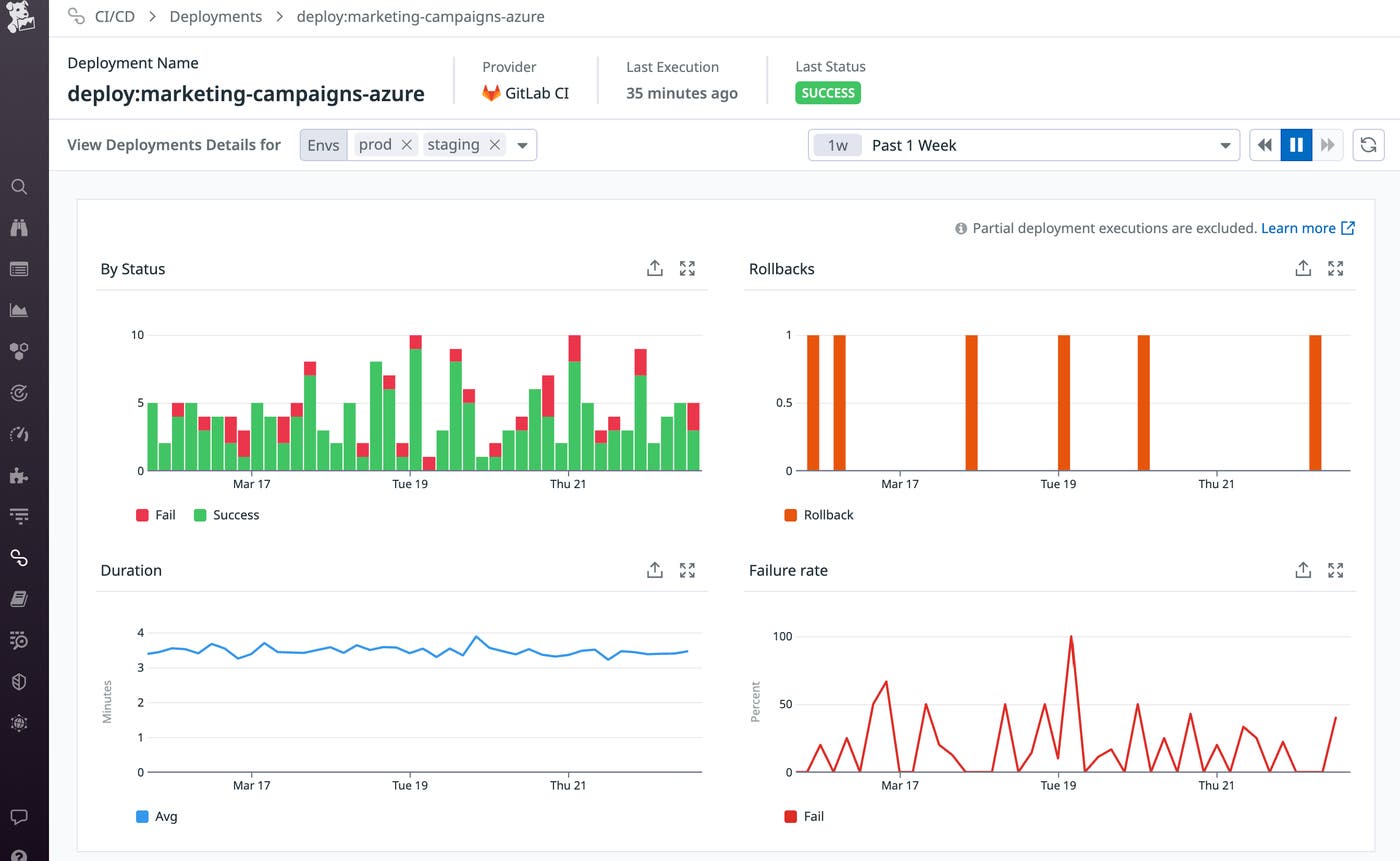
Using Datadog Continuous Delivery Visibility, you can see how all of your services are being deployed across your different environments. Inspecting a deployment reveals key metrics such as duration, failure rate, and when rollbacks occur. By monitoring the failure rate of your deployments, you can ensure that your application changes are being smoothly deployed even as you adopt new CD tools into your workflow. By switching between deployment details for different environments, you can also ensure your deployment performance is consistent across both your staging and production environments.
As your organization looks to modernize your CI/CD infrastructure, you’ll likely adopt new tools and services that enable a smoother and more efficient deployment process. However, while new technologies can improve your existing workflows, they also present additional components that can cause pipeline failures.
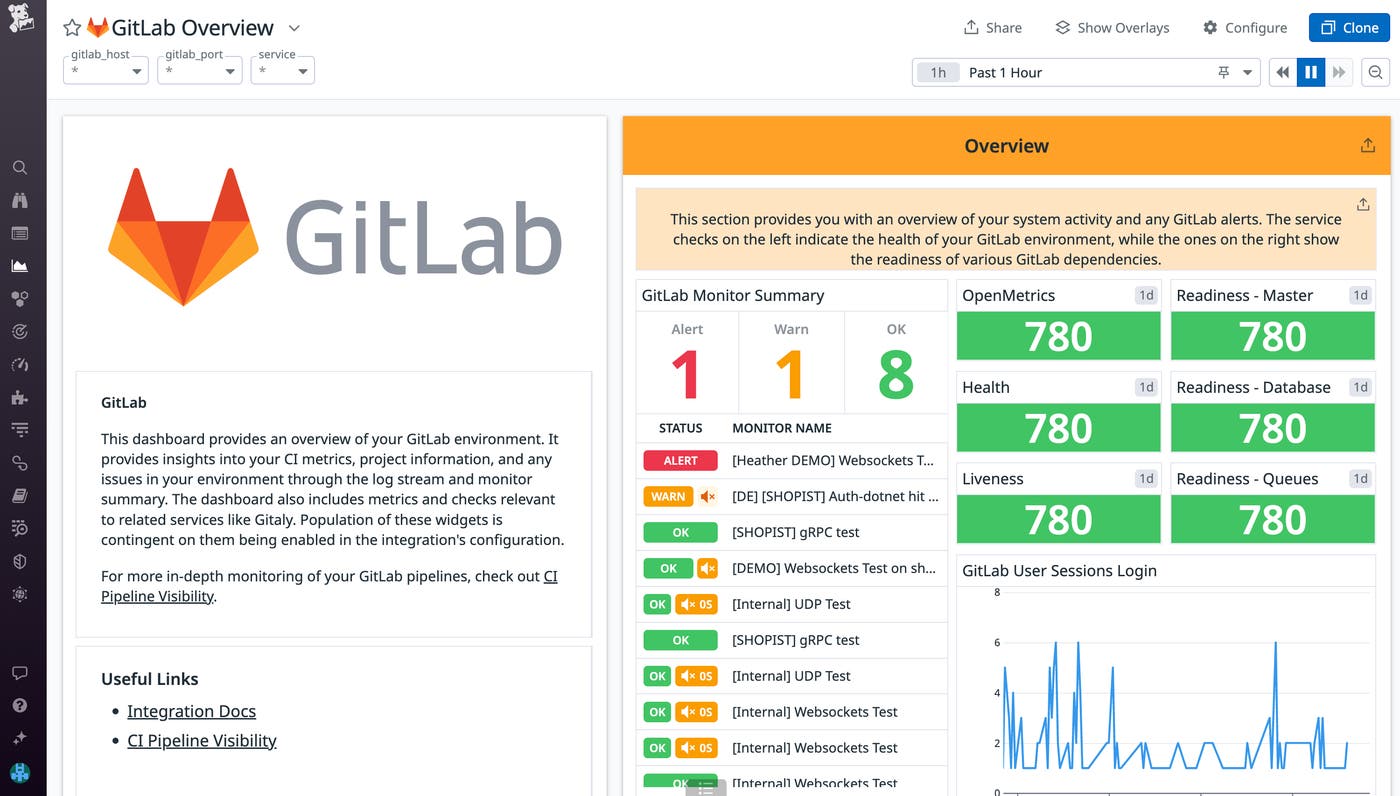
Datadog integrates with most major CI providers to give you visibility into incoming load, active database connections, and other metrics that can indicate pipeline failures resulting from your provider. Some integrations (such as our GitLab integration) come with an OOTB dashboard that helps you quickly monitor your CI provider’s status. Health and liveliness service checks can indicate whether your provider’s servers are online and ready to receive traffic. Verifying these service checks and monitoring provider metrics in response to CI issues can help you determine whether the problem is related to your provider’s status and underlying infrastructure or changes in application code.
When your pipeline executions experience slowdowns or errors, problems related to your CI provider—such as API failures, exceeded activity limits, and provider outages—may be the cause. By inspecting errors in your pipeline execution trace, you can view their error type and error message, which can help you determine whether the issue was caused by the user or the provider.
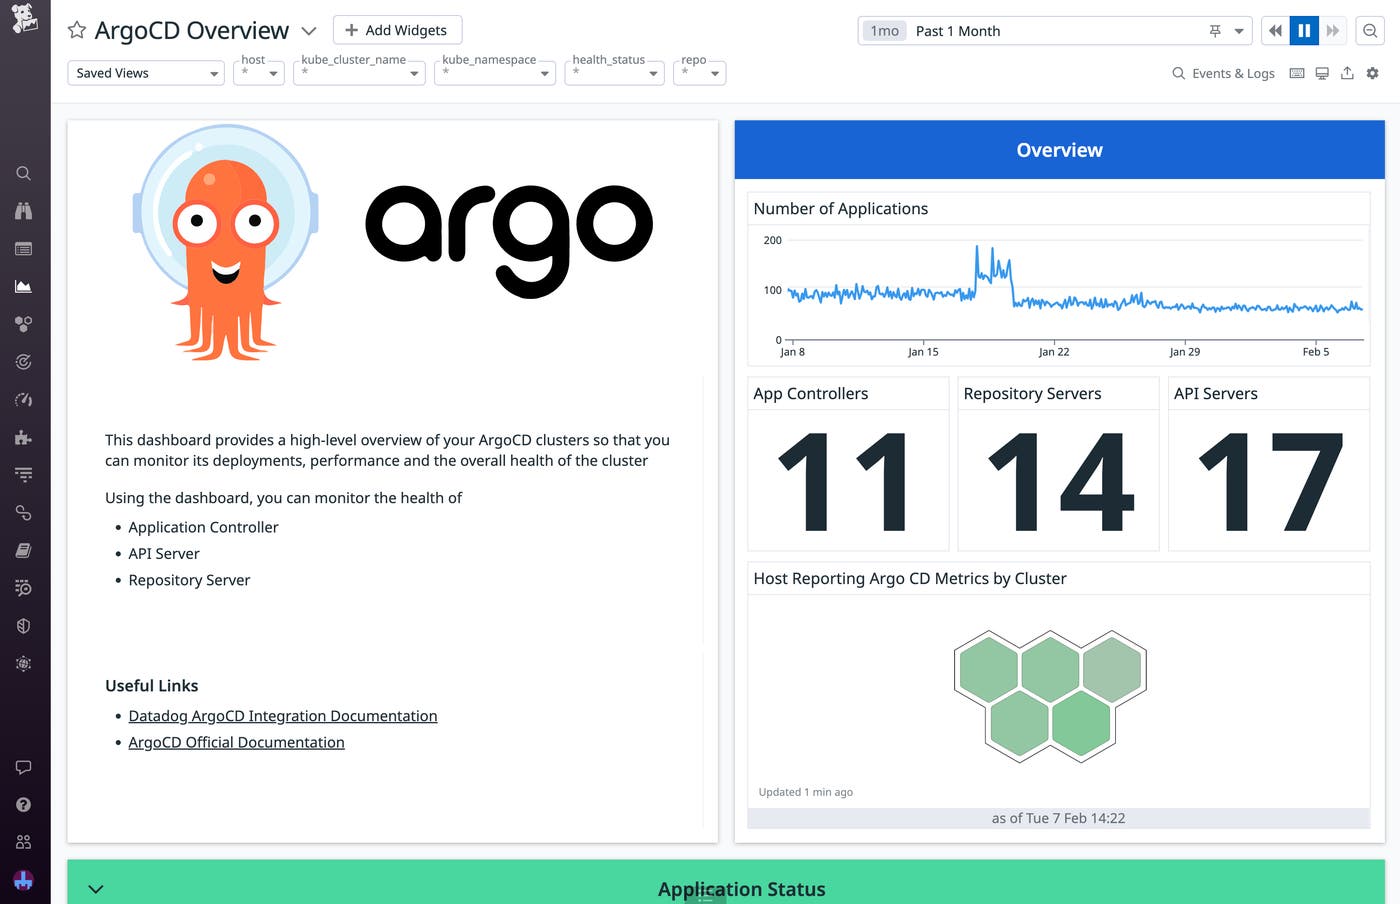
Continuous delivery tools such as Argo CD can automate your application deployments by continuously monitoring and updating the live state of your CI/CD runners via Kubernetes. This can greatly simplify cluster management and ensure that each runner is equipped with the necessary tools and configuration directly from your Git repository. Datadog’s integration enables you to monitor all of Argo CD’s main components using an OOTB dashboard to ensure that your applications are in sync and that your API server has sufficient resources to handle incoming requests.
Datadog enables you to maintain visibility into your CI/CD environment even as you adopt new technologies and switch providers. You can learn more about monitoring your pipelines and your software tests in our best practices posts, and view our documentation for a full list of Datadog’s configuration and deployment integrations. To gain additional observability into your deployments with Datadog Continuous Deployment Visibility, request access to our Preview.
If you don’t already have a Datadog account, sign up for a free 14-day trial today.
此内容由惯性聚合(RSS阅读器)自动聚合整理,仅供阅读参考。 原文来自 — 版权归原作者所有。