





A key challenge of monitoring your CI/CD system is understanding how to optimize your workflows and create best practices that help you minimize pipeline slowdowns and better respond to CI issues. In addition to monitoring CI pipelines and their underlying infrastructure, your organization also needs to cultivate effective relationships between platform and development teams. Fostering collaboration between these two teams is a critical and equally valuable aspect of improving the reliability and performance of your CI.
In this post, we’ll explore how platform teams can help developers visualize trends in CI test performance and notify them of new flaky tests, test failures, and performance regressions with dashboards and monitors. We’ll also detail best practices that can help developers identify, investigate, and remediate flaky tests.
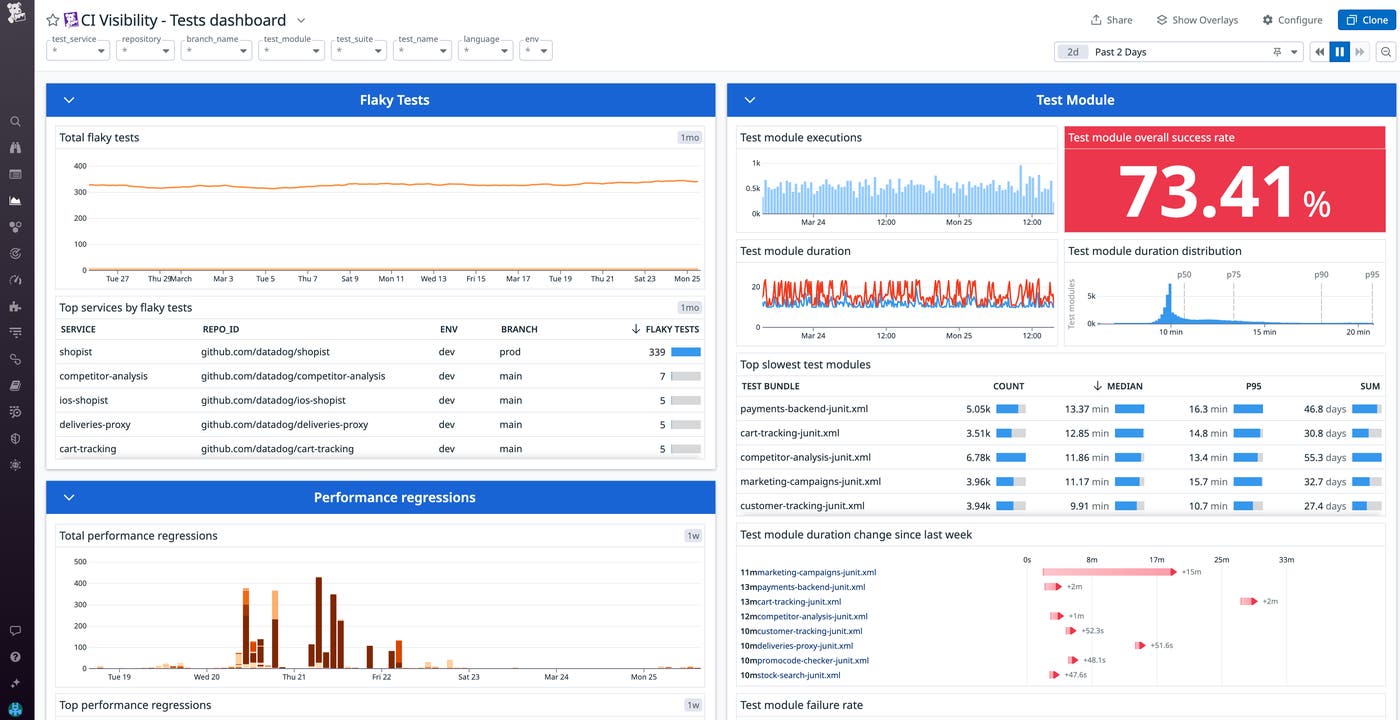
Developers write tests to verify that their code meets functional, integration, and security requirements—but as organizations and their repositories grow, testing suites can easily become bloated and prone to performance and reliability regressions. The introduction and proliferation of slow, failing, and flaky tests present a major roadblock to maintaining pipeline health and developer productivity.
To sustainably combat flaky or slow tests, organizations should address new cases as soon as they are detected, while simultaneously triaging persistent test issues. However, it can be challenging for platform and product engineering teams to work together to resolve these issues. Platform engineers are responsible for maintaining the health and reliability of CI/CD pipelines to help shorten feedback loops during the development cycle, which enables developers to ship products faster and more efficiently. When a test causes a pipeline to fail, platform engineers can help investigate and determine whether the test exhibits flaky behavior—but they don’t have the engineering context to be able to directly fix the test. On the other hand, developers often have limited visibility into how their tests affect a pipeline, or they may not know if or when their tests eventually become flaky. When developers push code changes that break or cause slowdowns in the pipeline, they may not have access to data that can help them determine if the issue lies with the CI pipeline or their application code.
To effectively address these challenges, platform and development teams need shared visibility into tests and CI pipelines, so they can collaborate to troubleshoot and resolve issues. For platform teams, this means configuring self-service tools that notify developers to new flaky tests and test performance regressions. Developers will then need to leverage these visibility tools to create processes that help them better triage, troubleshoot, and remediate software testing issues.
By bringing observability to CI testing, both platform and development teams can analyze testing trends across their organization’s repositories and gain quick and meaningful insights into test executions. One way to accomplish this is by configuring a dashboard that aggregates key test metrics. For example, Datadog’s out-of-the-box (OOTB) test visibility dashboard can help teams identify trends in flaky tests, performance regressions, as well as failing and slow test suites. By grouping this data by test service or repository, platform engineers can identify those that are becoming flakier or slower over time and notify the appropriate code owners so they can take action.
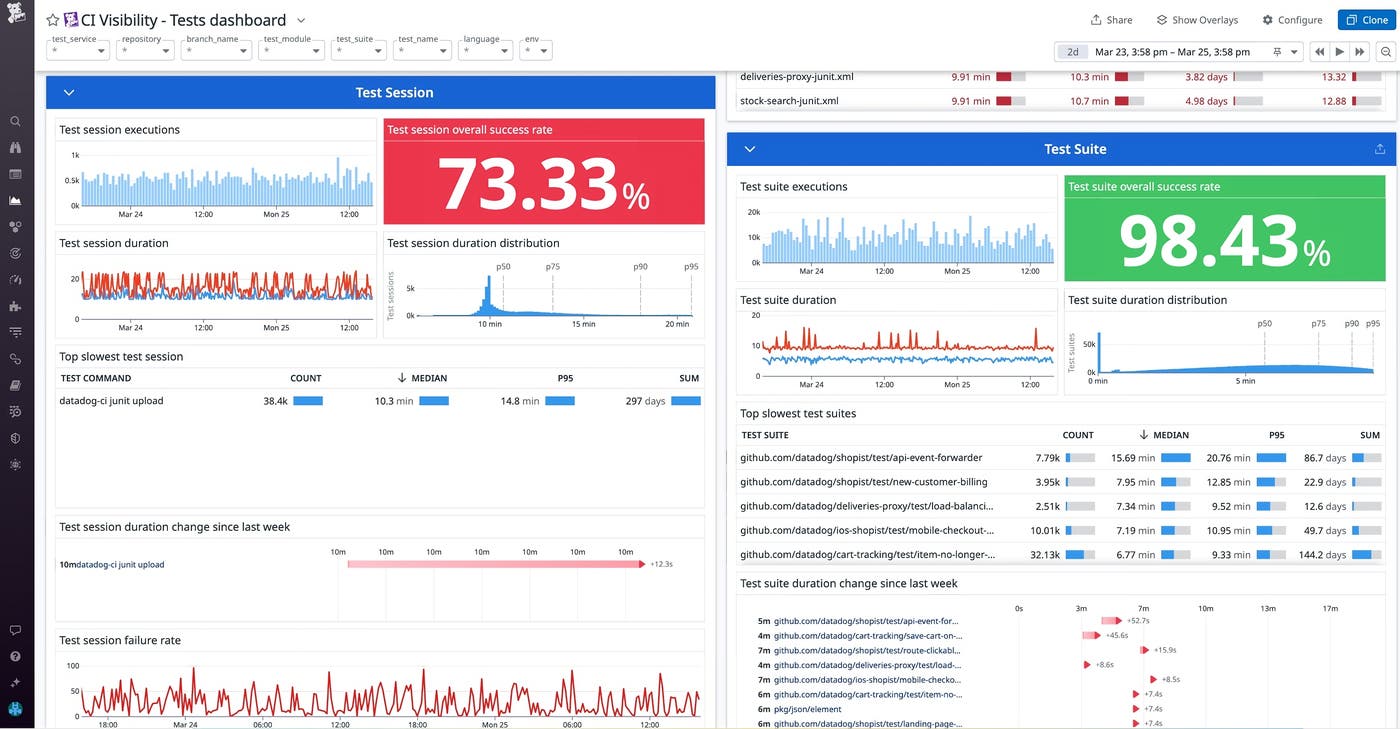
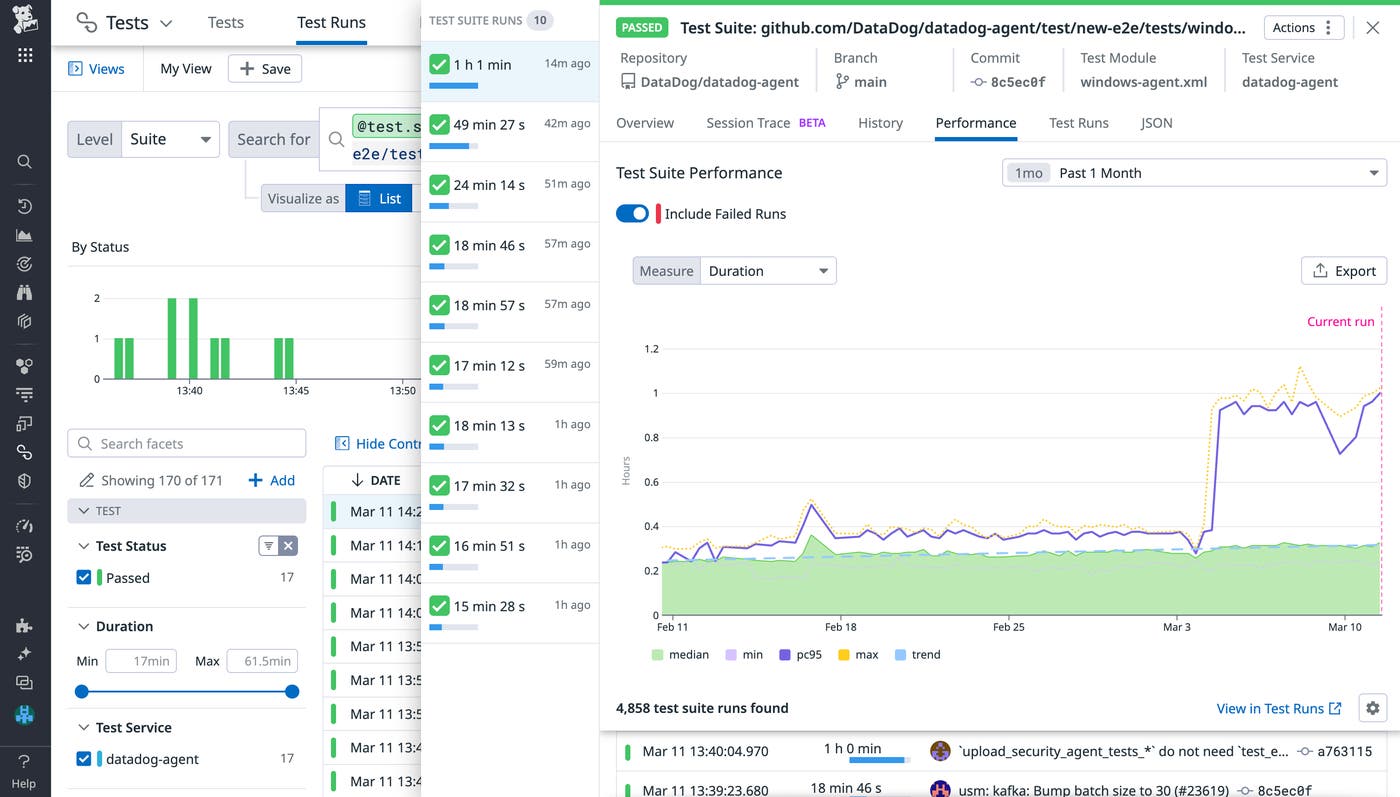
To understand how their tests are impacting the performance of their CI pipelines, developers can filter this dashboard to specifically view data from the repositories they own. The dashboard visualizes changes in test suite duration over each week, which can help highlight slowdowns and test suites that are prone to failure. To troubleshoot, developers can view related test suite runs to gain additional context around the suite’s historical performance and pinpoint when issues were introduced. In the example below, we’ve clicked to inspect a test suite that has recently begun to experience slowdowns. The “Performance” tab shows us that a change made shortly after March 3 is likely responsible. From here, we can look into the performance of individual test runs, or focus on commits within the time frame of interest and review any changes made to the specific test files associated with the test suite.
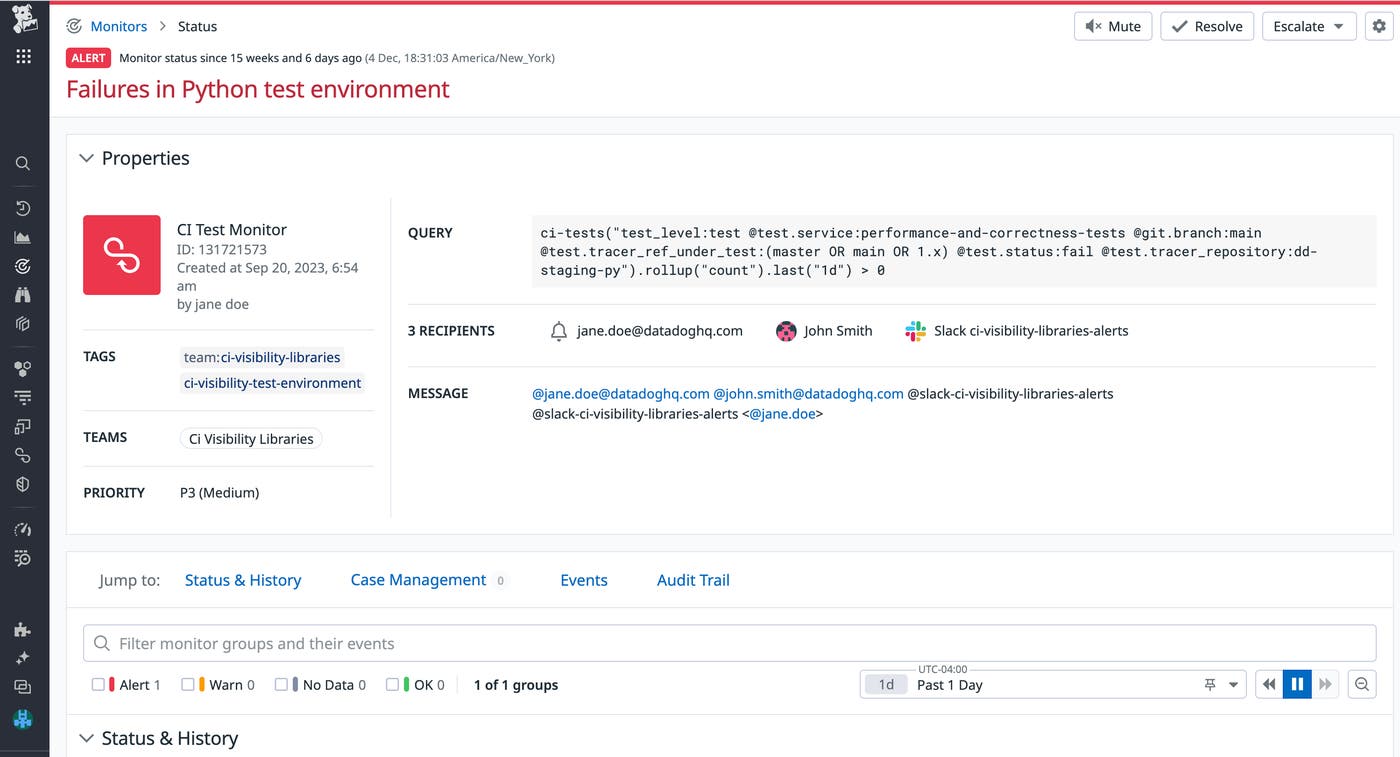
In addition to tracking long-term testing trends, platform engineers can configure monitors that automatically detect new test issues in real time. Datadog provides OOTB CI test monitors that can notify the appropriate individuals or teams about new flaky tests, test failures, and test performance regressions. Platform teams can create organization-wide monitors or customize them according to specific teams’ needs by configuring each monitor to track a specific service or branch.
If your organization does not already do so, it’s important to improve code ownership visibility by enforcing the use of tagging across CI tests. Strict adherence to this policy ensures that once a test issue is identified, it can be assigned to a designated code owner for remediation. For instance, Datadog enables you to build this step directly into your alerting framework by configuring recipients for each monitor. In the following example, once Datadog detects new test failures in the Python test environment, it will automatically notify the corresponding code owners and teams through email and Slack to ensure that these issues are quickly addressed.
By providing developers with the tools to track long-term trends in their software tests and identify new issues, you’re building the foundation to ensure performant and high-quality testing throughout the development lifecycle. Platform teams can also use these tools to gain insights into long-term test trends, and aggregate this data into recurring reports that they can share with the rest of the organization. For example, creating quarterly reports that summarize each repository’s flaky tests and performance regression trends can help engineering leadership make data-driven decisions, track the effectiveness of remediation efforts from previous quarters, and implement org-wide changes to combat flakiness. In the following section, we’ll discuss steps and workflows developers can adopt to investigate and remediate flaky tests.
Flaky tests are tests that arbitrarily pass or fail for the same commit. As your repository grows, flaky tests will inevitably be introduced to your codebase. But once a flaky test is introduced, it can cross-contaminate other test environments and hinder other developers’ workflows. Some tests may flake once every 10 commits, while others may only flake once every 100 commits, making them difficult to detect and prioritize after they’re introduced.
Flaky tests reduce developer productivity and negatively impact engineering teams’ confidence in the reliability of their CI/CD pipelines. When a test flakes, developers typically retry the pipeline until it passes, which can take a substantial amount of time and CI resources, particularly in large monolithic repositories that run hundreds or thousands of tests. At times, flaky tests may fail after catching real issues that need to be fixed. However, when a test is known to be flaky, the developer may continue to retry the pipeline without investigating the underlying issue, which slows down the feedback loop and accumulates technical debt.
This presents a problem for both platform engineering teams and developers—it directly conflicts with the platform team’s goals of maintaining trustworthy CI, and it creates longer feedback cycles for developers who need to investigate CI failures and retry their commits. Since flaky tests can often be unrelated to their code changes, developers may not feel responsible for addressing them, or they may not know how to begin investigating. If left unchecked, flaky tests can create substantial delays for engineering teams who spend time retrying pipelines, directly hindering their ability to release new features.
Pinpointing the cause of flaky tests and fixing them can be challenging—but with the proper tools and workflows to detect flakiness, developers can take action to quickly investigate and remediate these issues. In this section, we’ll discuss several tools and techniques that can help developers accelerate their investigation of flaky tests and reduce their impact in the future.
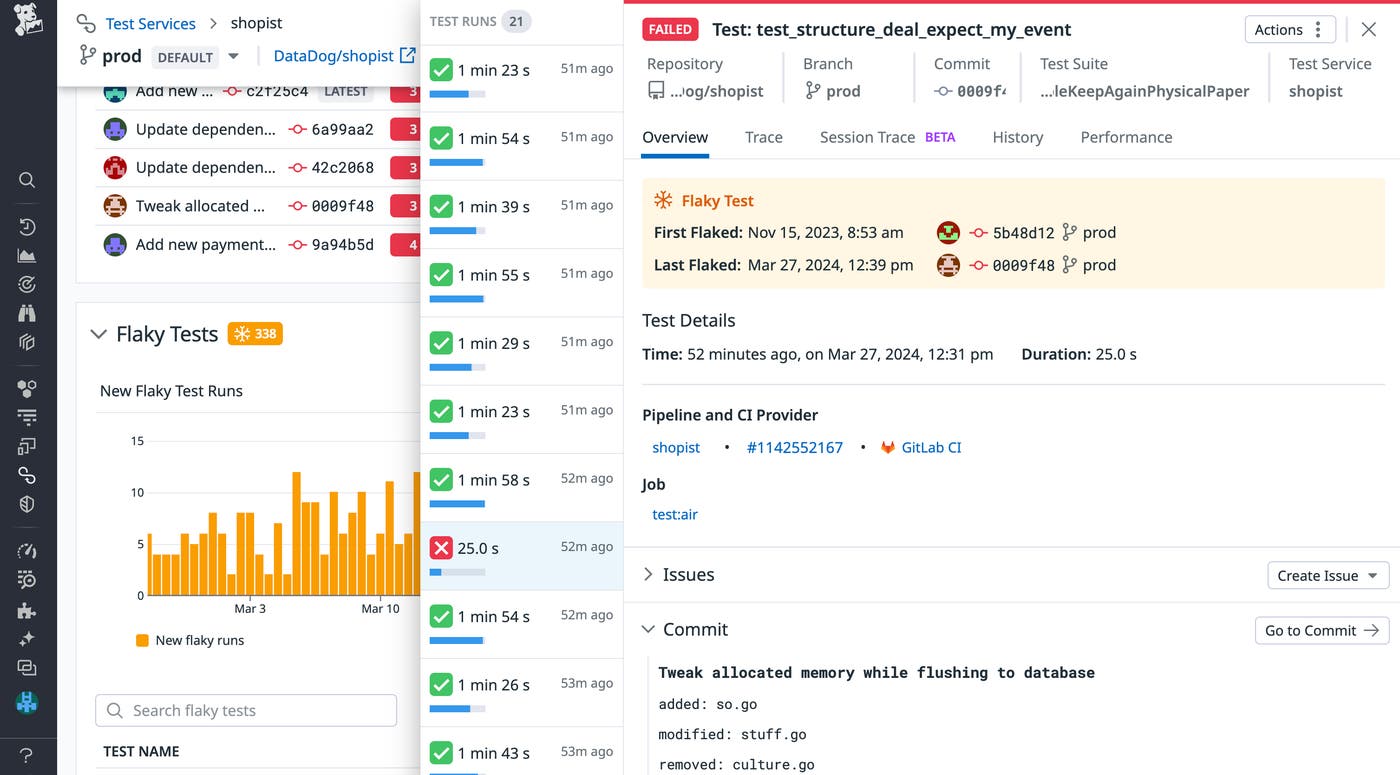
The first step to tackling flaky tests in your organization is to create effective processes that identify flaky tests and measure how frequently they flake. Your engineering teams also need data on which tests flake the most frequently over time and which tests are flaking in the most number of commits, so they can identify the tests that are a higher priority to fix first. Identifying flaky tests before they have the chance to impact a large number of commits or teams is also critical, so it’s important to set up monitors that notify you whenever any of your tests flake for the first time.
There are several methods to identify flaky tests—selecting the method that best suits your team depends on how early in the development lifecycle you want to surface flakiness and how often you want to test for it. For instance, to catch flaky tests before they impact future commits and shift the response workflow to the left, you can conduct preliminary tests for flakiness every time a PR introduces a new unit test. You can also proactively detect flaky tests by rerunning your test suite multiple times against the same commit (try to select a commit with high test coverage). The probability of surfacing a flaky test will depend on how frequently it flakes and the number of executions you choose to run; however, even running a lower number of executions against a commit can help you discover flaky tests earlier and prevent future pipeline failures.
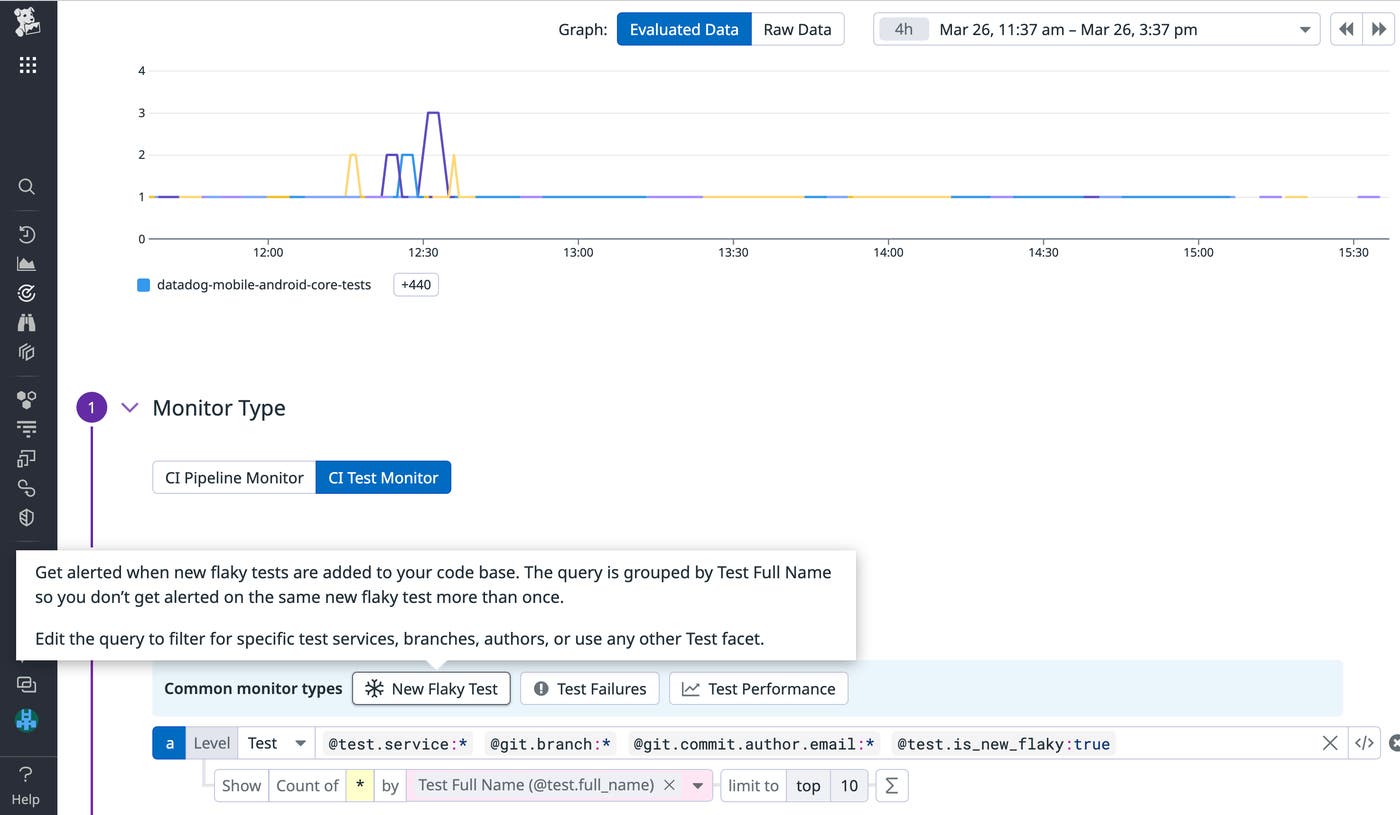
An essential component to flaky test identification is being able to immediately tag a test as flaky as soon as it exhibits flaky behavior (i.e., passes and fails on the same commit). This process can be difficult to track manually because it would require you to investigate test history across commits for each failed test. As a more sustainable solution, you can do this automatically with Datadog’s OOTB flaky test monitor shown below. By restricting your query to specific areas, such as your development branches or staging environment, you can help prevent alert fatigue and maintain the effectiveness of your monitor.
Once you’ve identified your flaky test, you’ll need to investigate and remediate the cause of flakiness, so you can maintain your software’s test coverage while restoring developer trust in CI. Flakiness can occur due to a variety of reasons, ranging from multithreading and race conditions that can create timing and synchronization issues, to environmental factors, such as network issues.
You can start investigating a flaky test by reproducing a test failure on your local machine. If you develop code using an IDE such as JetBrains (IntelliJ/PyCharm), it provides native support to run tests until failure. Using Datadog’s IDE plugins, you can view recent test runs directly within your IDE. Comparing the stack traces of failed test runs against successful ones can help you pinpoint when and why your test began to exhibit signs of flaky behavior.
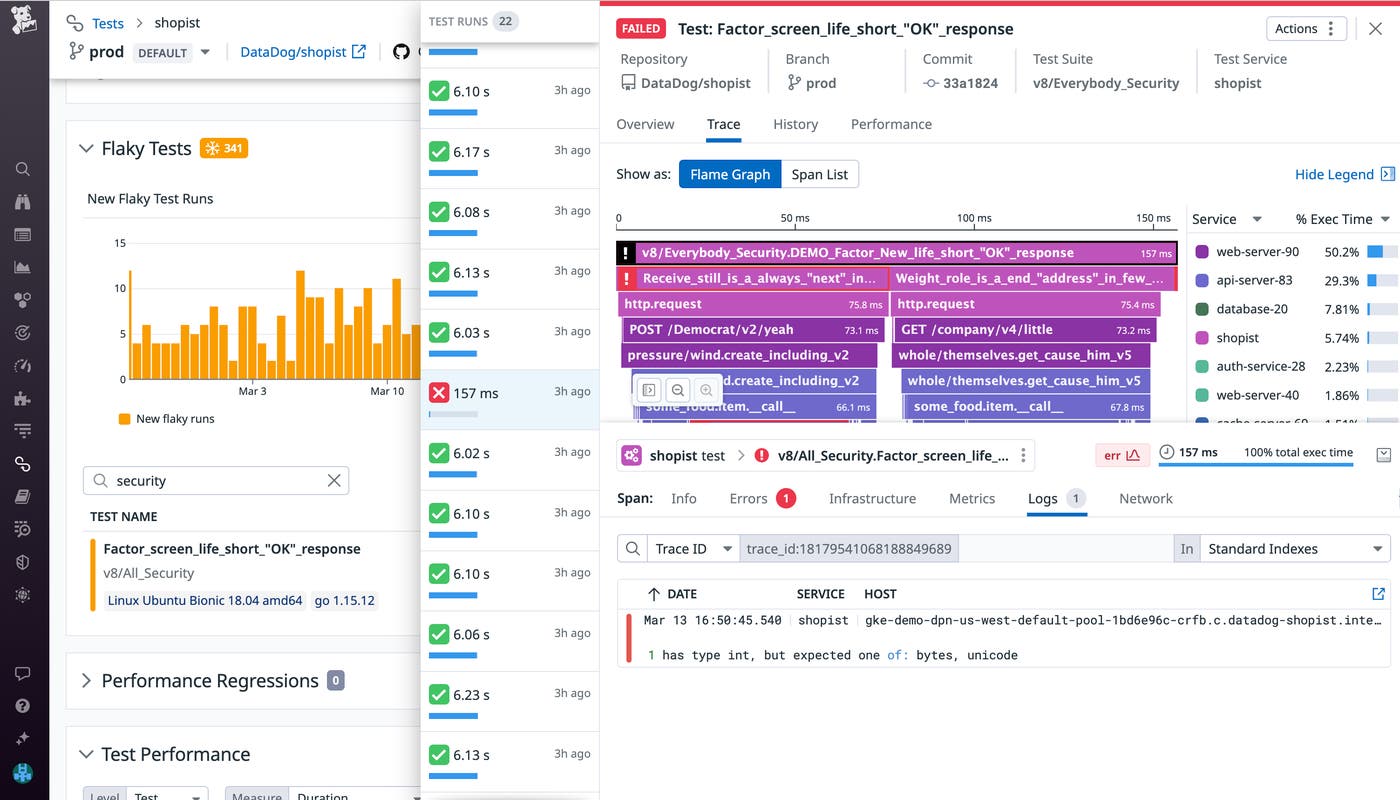
You can also investigate flaky test failures directly within a product like Test Visibility. Datadog highlights errors and provides logs and network data for additional context around each test failure, which can reduce the amount of time spent debugging. For instance, the log in the following screenshot indicates that the test ran a function that expected a byte/unicode variable, but received an integer instead. By reproducing this issue, you can identify when this type of error occurs within your test and make changes to specific function calls.
When investigating flaky tests, look out for cases of non-deterministic behavior and asynchronous calls in your functions that can create flakiness. Understanding how to properly handle asynchronous code when writing software tests can improve the overall quality of your test suite and greatly reduce the likelihood of introducing new flaky tests. For example, let’s say your test needs to make an API call to an external service, and the application needs to complete the request before the test finishes in order to successfully pass. A common pitfall is to use a sleep function to build a fixed interval directly into your test so you can account for the time spent executing an asynchronous call. Setting an insufficient sleep interval can yield flaky results, whereas setting a higher-than-needed interval can create idle wait time that slows down your pipeline. Instead, you can schedule a callback to execute once the asynchronous call completes. While this method cannot completely eliminate non-deterministic variables (such as network latency), it ensures that your tests don’t experience unnecessary downtime or become flaky as a result of mishandled asynchronous requests.
After you’ve established a framework for identifying and investigating flaky tests, the final step is to create or adopt tools to track long-term trends and reduce their future impact on your CI. Tools such as Test Visibility help you track flakiness across different repositories and immediately identify flaky tests introduced by recent commits. Filtering your flaky tests by the number of commits they’ve flaked on or their failure rate will enable you to prioritize the remediation of tests that are impacting commits across other teams and causing the most number of retries.
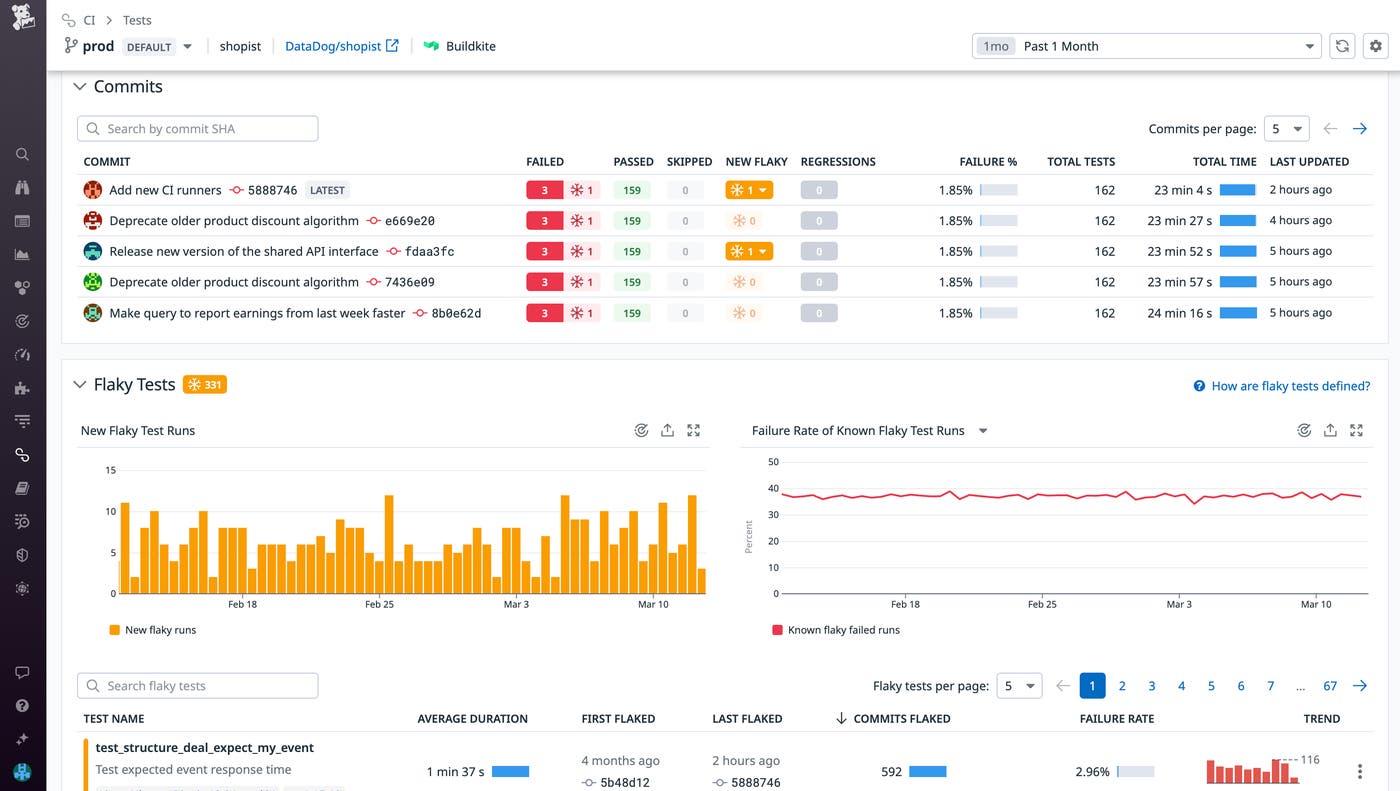
Let’s say you notice that flaky tests are proliferating in the Datadog/shopist repository, which contains the application code responsible for running a web store. After sorting the repository’s flaky tests by commits flaked, we’re able to identify and prioritize responding to tests that are persistently impacting development the most. By routinely prioritizing and addressing these existing flaky tests as well as adopting workflows to detect new flaky tests, you should begin to notice improvements in both development velocity and flaky test frustration.
In order to triage and track the progress of your team’s efforts to resolve flaky tests, consider creating additional workflows such as assigning Jira or GitHub issues to code owners as soon as their test is identified as flaky. If your organization plans on implementing a stringent flaky test policy, tools such as Datadog Quality Gates enable you to block commits if they introduce a specific number of flaky tests.
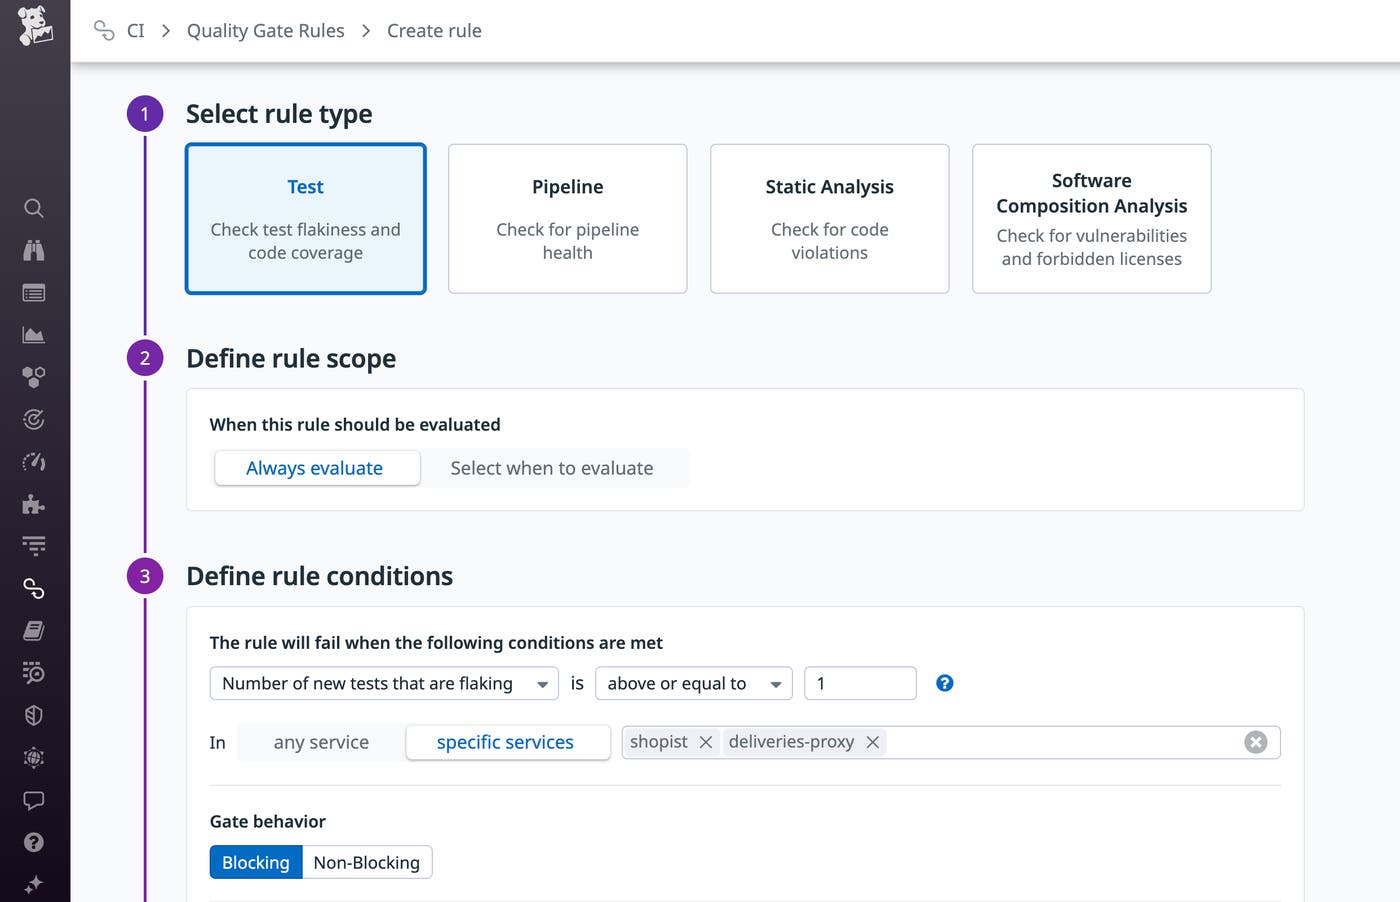
While this can help you reduce the number of flaky tests introduced to your test suite, it can also create unwanted slowdowns in development. To maintain velocity, you can configure your quality gates to block only in development or staging environments—this ensures that developers will address new flaky tests earlier in the deployment lifecycle without needlessly blocking deployments to production.
To reduce time wasted on flaky tests, you can use a tool like Datadog Intelligent Test Runner to skip tests that are unrelated to the code changes being committed. This can help reduce time spent running tests—including potentially flaky tests—while maintaining monitoring coverage. You can also configure your pipeline to automatically rerun failed tests individually, up to a fixed number of times. If the test is flaky and passes, your commit will succeed, which is much faster and cost-efficient than retrying the entire pipeline or job. On the other hand, if your test continues to fail, it’s likely a strong indicator of a real underlying issue that requires troubleshooting.
In this post, we looked at how platform teams can democratize software testing data using dashboards and other test visibility tools. We also explored how developers can better identify, investigate, and respond to flaky tests. You can read more about best practices for monitoring and investigating CI pipelines in the first part of this series or learn about monitoring your CI environment with Datadog by viewing our documentation.
If you don’t already have a Datadog account, you can sign up for a 14-day free trial.
此内容由惯性聚合(RSS阅读器)自动聚合整理,仅供阅读参考。 原文来自 — 版权归原作者所有。