


This post is part 2 of a 3-part series about monitoring Apache Cassandra. Part 1 is about the key performance metrics available from Cassandra, and Part 3 details how to monitor Cassandra with Datadog.
If you’ve already read our guide to key Cassandra metrics, you’ve seen that Cassandra provides a vast array of metrics on performance and resource utilization, which are available in a number of different ways. This post covers several different options for collecting Cassandra metrics, depending on your needs.
Like Solr, Tomcat, and other Java applications, Cassandra exposes metrics on availability and performance via JMX (Java Management Extensions). Since version 1.1, Cassandra’s metrics have been based on Coda Hale’s popular Metrics library, for which there are numerous integrations with graphing and monitoring tools. There are at least three ways to view and monitor Cassandra metrics, from lightweight but limited utilities to full-featured, hosted services:
nodetool, a command-line interface that ships with Cassandra
JConsole, a GUI that ships with the Java Development Kit (JDK)
JMX/Metrics integrations with external graphing and monitoring tools and services
Nodetool is a command-line utility for managing and monitoring a Cassandra cluster. It can be used to manually trigger compactions, to flush data in memory to disk, or to set parameters such as cache size and compaction thresholds. It also has several commands that return simple node and cluster metrics that can provide a quick snapshot of your cluster’s health. Nodetool ships with Cassandra and appears in Cassandra’s bin directory.
Running bin/nodetool status from the directory where you installed Cassandra outputs an overview of the cluster, including the current load on each node and whether the individual nodes are up or down:
$ bin/nodetool status
Datacenter: datacenter1
=======================
Status=Up/Down
|/ State=Normal/Leaving/Joining/Moving
-- Address Load Owns Host ID Token Rack
UN 127.0.0.1 14.76 MB 66.7% 9e524995 -9223372036854775808 rack1
UN 127.0.0.1 14.03 MB 66.7% 12e12ead -3074457345618258603 rack1
UN 127.0.0.1 13.92 MB 66.7% 44387d08 3074457345618258602 rack1
nodetool info outputs slightly more detailed statistics for an individual node in the cluster, including uptime, load, key cache hit rate, and a total count of all exceptions. You can specify which node you’d like to inspect by using the --host argument with an IP address or hostname:
$ bin/nodetool --host 127.0.0.1 info
ID : 9aa4fe41-c9a8-43bb-990a-4a6192b3b46d
Gossip active : true
Thrift active : false
Native Transport active: true
Load : 14.76 MB
Generation No : 1449113333
Uptime (seconds) : 527
Heap Memory (MB) : 158.50 / 495.00
Off Heap Memory (MB) : 0.07
Data Center : datacenter1
Rack : rack1
Exceptions : 0
Key Cache : entries 26, size 2.08 KB, capacity 24 MB, 87 hits, 122 requests, 0.713 recent hit rate, 14400 save period in seconds
Row Cache : entries 0, size 0 bytes, capacity 0 bytes, 0 hits, 0 requests, NaN recent hit rate, 0 save period in seconds
Counter Cache : entries 0, size 0 bytes, capacity 12 MB, 0 hits, 0 requests, NaN recent hit rate, 7200 save period in seconds
Token : -9223372036854775808
nodetool cfstats provides statistics on each keyspace and column family (akin to databases and database tables, respectively), including read latency, write latency, and total disk space used. By default nodetool prints statistics on all keyspaces and column families, but you can limit the query to a single keyspace by appending the name of the keyspace to the command:
$ bin/nodetool cfstats demo
Keyspace: demo
Read Count: 4
Read Latency: 1.386 ms.
Write Count: 4
Write Latency: 0.71675 ms.
Pending Flushes: 0
Table: users
SSTable count: 3
Space used (live), bytes: 16178
Space used (total), bytes: 16261
...
Local read count: 4
Local read latency: 1.153 ms
Local write count: 4
Local write latency: 0.224 ms
Pending flushes: 0
...
nodetool compactionstats shows the compactions in progess as well as a count of pending compaction tasks.
$ bin/nodetool compactionstats
pending tasks: 5
compaction type keyspace table completed total unit progress
Compaction Keyspace1 Standard1 282310680 302170540 bytes 93.43%
Compaction Keyspace1 Standard1 58457931 307520780 bytes 19.01%
Active compaction remaining time : 0h00m16s
nodetool gcstats returns statistics on garbage collections, including total number of collections and elapsed time (both the total and the max elapsed time). The counters are reset each time the command is issued, so the statistics correspond only to the interval between gcstats commands.
$ bin/nodetool gcstats
Interval (ms) Max GC Elapsed (ms) Total GC Elapsed (ms) Stdev GC Elapsed (ms) GC Reclaimed (MB) Collections Direct Memory Bytes
73540574 64 595 7 3467143560 83 67661338
nodetool tpstats provides usage statistics on Cassandra’s thread pool, including pending tasks as well as current and historical blocked tasks.
$ bin/nodetool tpstats
Pool Name Active Pending Completed Blocked All time blocked
ReadStage 0 0 11801 0 0
MutationStage 0 0 125405 0 0
CounterMutationStage 0 0 0 0 0
GossipStage 0 0 0 0 0
RequestResponseStage 0 0 0 0 0
AntiEntropyStage 0 0 0 0 0
MigrationStage 0 0 10 0 0
MiscStage 0 0 0 0 0
InternalResponseStage 0 0 0 0 0
ReadRepairStage 0 0 0 0 0
JConsole is a simple Java GUI that ships with the Java Development Kit (JDK). It provides an interface for exploring the full range of metrics Cassandra provides via JMX. If the JDK was installed to a directory in your system path, you can start JConsole simply by running:
Otherwise it can be found in your_JDK_install_dir/bin
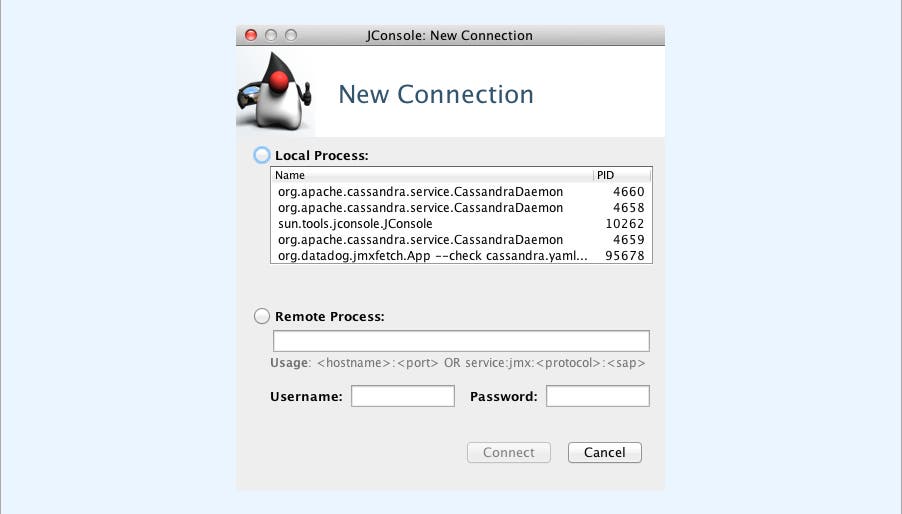
To pull up metrics in JConsole, you can select the relevant local process or monitor a remote process using the node’s IP address (Cassandra uses port 7199 for JMX by default):

The MBeans tab brings up all the JMX paths available:

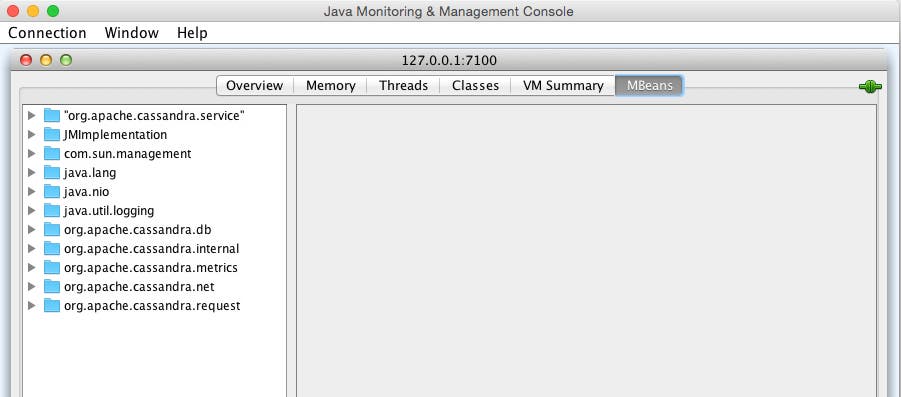
Out of the box, org.apache.cassandra.metrics (based on the Metrics library) provides almost all of the metrics that you need to monitor a Cassandra cluster. (See the first footnote on the table below for exceptions.) Prior to Cassandra 2.2, many identical or similar metrics were also available via alternate JMX paths (org.apache.cassandra.db, org.apache.cassandra.internal, etc.), which, while still usable in some versions, reflect an older structure that has been deprecated. Below are modern JMX paths, which mirror the JConsole interface’s folder structure, for the key metrics described in this article:
| Metric | JMX path |
|---|---|
| Throughput (writes|reads) | org.apache.cassandra.metrics:type=ClientRequest,scope=(Write|Read),name=LatencyAttribute: OneMinuteRate |
| Latency (writes|reads)* | org.apache.cassandra.metrics:type=ClientRequest,scope=(Write|Read),name=TotalLatencyAttribute: Countorg.apache.cassandra.metrics:type=ClientRequest,scope=(Write|Read),name=LatencyAttribute: Count |
| Key cache hit rate* | org.apache.cassandra.metrics:type=Cache,scope=KeyCache,name=HitsAttribute: Countorg.apache.cassandra.metrics:type=Cache,scope=KeyCache,name=RequestsAttribute: Count |
| Load | org.apache.cassandra.metrics:type=Storage,name=LoadAttribute: Count |
| Total disk space used | org.apache.cassandra.metrics:type=ColumnFamily,keyspace=(KeyspaceName),scope=(ColumnFamilyName),name=TotalDiskSpaceUsedAttribute: Count |
| Completed compaction tasks | org.apache.cassandra.metrics:type=Compaction,name=CompletedTasksAttribute: Value |
| Pending compaction tasks | org.apache.cassandra.metrics:type=Compaction,name=PendingTasksAttribute: Value |
| ParNew garbage collections (count|time) | java.lang:type=GarbageCollector,name=ParNewAttribute: (CollectionCount|CollectionTime) |
| CMS garbage collections (count|time) | java.lang:type=GarbageCollector,name=ConcurrentMarkSweepAttribute: (CollectionCount|CollectionTime) |
| Exceptions | org.apache.cassandra.metrics:type=Storage,name=ExceptionsAttribute: Count |
| Timeout exceptions (writes|reads) | org.apache.cassandra.metrics:type=ClientRequest,scope=(Write|Read),name=TimeoutsAttribute: Count |
| Unavailable exceptions (writes|reads) | org.apache.cassandra.metrics:type=ClientRequest,scope=(Write|Read),name=UnavailablesAttribute: Count |
| Pending tasks (per stage)** | org.apache.cassandra.metrics:type=ThreadPools,path=request,scope=(CounterMutationStage|MutationStage|ReadRepairStage|ReadStage|RequestResponseStage), name=PendingTasksAttribute: Value |
| Currently blocked tasks** | org.apache.cassandra.metrics:type=ThreadPools,path=request,scope=(CounterMutationStage|MutationStage|ReadRepairStage|ReadStage|RequestResponseStage), name=CurrentlyBlockedTasksAttribute name: Count |
* The metrics needed to monitor recent latency and key cache hit rate are available in JConsole, but must be calculated from two separate metrics. For read latency, to give an example, the relevant metrics are ReadTotalLatency (cumulative read latency total, in microseconds) and the “Count” attribute of ReadLatency (the number of read events). For two readings at times 0 and 1, the recent read latency would be calculated from the deltas of those two metrics:
(ReadTotalLatency1−ReadTotalLatency0)/(ReadLatency1−ReadLatency0)
** There are five different request stages in Cassandra, plus roughly a dozen internal stages, each with its own thread pool metrics.
Nodetool and JConsole are both lightweight and can provide metrics snapshots very quickly, but neither are well suited to the kinds of big-picture questions that arise in a production environment: What are the long-term trends for my metrics? Are there any large-scale patterns I should be aware of? Do changes in performance metrics tend to correlate with actions or events elsewhere in my environment?
To answer these kinds of questions, you need a more sophisticated monitoring system. The good news is, virtually every major monitoring service and tool supports Cassandra monitoring, whether via JMX plugins; via pluggable Metrics reporter libraries; or via connectors that write JMX metrics out to StatsD, Graphite, or other systems.
The configuration steps depend greatly on the particular monitoring tools you choose, but both JMX and Metrics expose Cassandra metrics using the taxonomy outlined in the table of JMX paths above.
In this post we have covered a few of the ways to access Cassandra metrics using simple, lightweight tools. For production-ready monitoring, you will likely want a more powerful monitoring system that ingests Cassandra metrics as well as key metrics from all the other technologies in your stack.
At Datadog, we have developed a Cassandra integration so that you can start collecting, graphing, and alerting on metrics from your cluster with a minimum of overhead. For more details, check out our guide to monitoring Cassandra metrics with Datadog, or get started right away with a free trial.
此内容由惯性聚合(RSS阅读器)自动聚合整理,仅供阅读参考。 原文来自 — 版权归原作者所有。