


As explained in Part 1 of this series, PostgreSQL provides a few categories of key metrics to help users track their databases’ health and performance. PostgreSQL’s built-in [statistics collector] automatically aggregates most of these metrics internally, so you’ll simply need to query predefined statistics views in order to start gaining more visibility into your databases.
Because some of the metrics mentioned in Part 1 are not accessible through these statistics views, they will need to be collected through other sources, as explained in a later section. In this post, we will show you how to access key metrics from PostgreSQL (through the statistics collector and other native sources), and with an open source, dedicated monitoring tool.
The PostgreSQL statistics collector enables users to access most of the metrics described in Part 1, by querying several key statistics views, including:
pg_stat_database (displays one row per database)
pg_stat_user_tables (one row per table in the current database)
pg_stat_user_indexes (one row per index in the current database)
pg_stat_bgwriter (only shows one row, since there is only one background writer process)
pg_statio_user_tables (one row per table in the current database)
The collector aggregates statistics on a per-table, per-database, or per-index basis, depending on the metric.
You can dig deeper into each statistics view’s actual query language by looking at the system views source code. For example, the code for pg_stat_database indicates that it queries the number of connections, deadlocks, and tuples/rows fetched, returned, updated, inserted, and deleted.
While some types of internal statistics are collected by default, others must be manually enabled, because of the additional load it would place on each query. By default, PostgreSQL’s statistics collector should already be set up to collect most of the metrics covered in Part 1. To confirm this, you can check your postgresql.conf file to see what PostgreSQL is currently collecting, and specify any desired changes in the “Runtime Statistics” section:
#------------------------------------------------------------------------------
# RUNTIME STATISTICS
#------------------------------------------------------------------------------
# - Query/Index Statistics Collector -
#track_activities = on
#track_counts = on
#track_io_timing = off
#track_functions = none # none, pl, all
#track_activity_query_size = 1024 # (change requires restart)
#update_process_title = on
#stats_temp_directory = 'pg_stat_tmp'
In the default settings shown above, PostgreSQL will not track disk block I/O latency (track_io_timing), or user-defined functions (track_functions), so if you want to collect these metrics, you’ll need to enable them in the configuration file.
The statistics collector process continuously aggregates data about the server activity, but it will only report the data as frequently as specified by the PGSTAT_STAT_INTERVAL (500 milliseconds, by default). Queries to the statistics collector views will not yield data about any queries or transactions that are currently in progress. Note that each time a query is issued to one of the statistics views, it will use the latest report to deliver information about the database’s activity at that point in time, so it will be slightly delayed in comparison to real-time activity.
Once you’ve configured the PostgreSQL statistics collector to collect the data you need, you can query these activity stats just like any data from your database. You’ll need to create a user and grant that user with read-only access to the pg_stat_database table:
create user <USERNAME> with password <PASSWORD>;
grant SELECT ON pg_stat_database to <USERNAME>;
Once you initialize a psql session under that user, you should be able to start querying the database’s activity statistics.
Let’s take a look at the pg_stat_database statistics view in more detail:
SELECT * FROM pg_stat_database;
datid | datname | numbackends | xact_commit | xact_rollback | blks_read | blks_hit | tup_returned | tup_fetched | tup_inserted | tup_updated | tup_deleted | conflicts | temp_files | temp_bytes | deadlocks | blk_read_time | blk_write_time | stats_reset
-------+------------+-------------+-------------+---------------+-----------+----------+--------------+-------------+--------------+-------------+-------------+-----------+------------+------------+-----------+---------------+----------------+-------------------------------
1 | template1 | 0 | 0 | 0 | 0 | 0 | 0 | 0 | 0 | 0 | 0 | 0 | 0 | 0 | 0 | 0 | 0 |
12061 | template0 | 0 | 0 | 0 | 0 | 0 | 0 | 0 | 0 | 0 | 0 | 0 | 0 | 0 | 0 | 0 | 0 |
12066 | postgres | 2 | 77887 | 11 | 249 | 2142032 | 35291376 | 429228 | 59 | 4 | 58 | 0 | 0 | 0 | 0 | 0 | 0 | 2017-09-07 17:24:57.739225-04
16394 | employees | 0 | 66146 | 6 | 248 | 1822528 | 30345213 | 365608 | 176 | 6 | 62 | 0 | 0 | 0 | 0 | 0 | 0 | 2017-09-11 16:04:59.039319-04
16450 | exampledb | 0 | 350 | 0 | 2920 | 33853 | 517601 | 9341 | 173159 | 449 | 13 | 0 | 0 | 0 | 0 | 0 | 0 | 2017-10-04 14:13:35.125243-04
pg_stat_database collects statistics about each database in the cluster, including the number of connections (numbackends), commits, rollbacks, rows/tuples fetched and returned. Each row displays statistics for a different database, but you can also limit your query to a specific database as shown below:
SELECT * FROM pg_stat_database WHERE datname = 'employees';
datid | datname | numbackends | xact_commit | xact_rollback | blks_read | blks_hit | tup_returned | tup_fetched | tup_inserted | tup_updated | tup_deleted | conflicts | temp_files | temp_bytes | deadlocks | blk_read_time | blk_write_time | stats_reset
-------+-----------+-------------+-------------+---------------+-----------+----------+--------------+-------------+--------------+-------------+-------------+-----------+------------+------------+-----------+---------------+----------------+-------------------------------
16394 | employees | 0 | 66286 | 6 | 248 | 1826378 | 30409473 | 366378 | 176 | 6 | 62 | 0 | 0 | 0 | 0 | 0 | 0 | 2017-09-11 16:04:59.039319-04
(1 row)
Whereas pg_stat_database collects and displays statistics for each database, pg_stat_user_tables displays statistics for each of the user tables in a particular database. Start a psql session, making sure to specify a database and a user that has read access to the database:
psql -d exampledb -U someuser
Now you can access activity statistics for this database, broken down by each table:
SELECT * FROM pg_stat_user_tables;
relid | schemaname | relname | seq_scan | seq_tup_read | idx_scan | idx_tup_fetch | n_tup_ins | n_tup_upd | n_tup_del | n_tup_hot_upd | n_live_tup | n_dead_tup | last_vacuum | last_autovacuum | last_analyze | last_autoanalyze | vacuum_count | autovacuum_count | analyze_count | autoanalyze_count
-------+------------+------------+----------+--------------+----------+---------------+-----------+-----------+-----------+---------------+------------+------------+-------------------------------+-----------------+-------------------------------+-------------------------------+--------------+------------------+---------------+-------------------
16463 | public | customers | 6 | 100500 | 0 | 0 | 20000 | 0 | 0 | 0 | 20000 | 0 | 2017-10-04 14:13:59.945161-04 | | 2017-10-04 14:14:00.942368-04 | 2017-10-04 14:13:59.17257-04 | 1 | 0 | 1 | 1
16478 | public | orders | 5 | 60000 | 0 | 0 | 12000 | 0 | 0 | 0 | 12000 | 0 | 2017-10-04 14:14:00.946525-04 | | 2017-10-04 14:14:00.977419-04 | 2017-10-04 14:13:59.221127-04 | 1 | 0 | 1 | 1
16484 | public | products | 3 | 30000 | 0 | 0 | 10000 | 0 | 0 | 0 | 10000 | 0 | 2017-10-04 14:13:59.768383-04 | | 2017-10-04 14:13:59.827651-04 | 2017-10-04 14:13:57.708035-04 | 1 | 0 | 1 | 1
16473 | public | orderlines | 2 | 120700 | 0 | 0 | 60350 | 0 | 0 | 0 | 60350 | 0 | 2017-10-04 14:13:59.845423-04 | | 2017-10-04 14:13:59.900862-04 | 2017-10-04 14:13:57.816999-04 | 1 | 0 | 1 | 1
16488 | public | reorder | 0 | 0 | | | 0 | 0 | 0 | 0 | 0 | 0 | 2017-10-04 14:13:59.828718-04 | | 2017-10-04 14:13:59.829075-04 | | 1 | 0 | 1 | 0
16454 | public | categories | 2 | 32 | 0 | 0 | 16 | 0 | 0 | 0 | 16 | 0 | 2017-10-04 14:13:59.589964-04 | | 2017-10-04 14:13:59.591064-04 | | 1 | 0 | 1 | 0
16470 | public | inventory | 1 | 10000 | 0 | 0 | 10000 | 0 | 0 | 0 | 10000 | 0 | 2017-10-04 14:13:59.593678-04 | | 2017-10-04 14:13:59.601726-04 | 2017-10-04 14:13:57.612466-04 | 1 | 0 | 1 | 1
16458 | public | cust_hist | 2 | 120700 | 0 | 0 | 60350 | 0 | 0 | 0 | 60350 | 0 | 2017-10-04 14:13:59.908188-04 | | 2017-10-04 14:13:59.94001-04 | 2017-10-04 14:13:57.885104-04 | 1 | 0 | 1 | 1
(8 rows)
The exampledb database contains eight tables. With pg_stat_user_tables, we can see a cumulative count of the sequential scans, index scans, and rows fetched/read/updated within each table.
pg_statio_user_tables helps you analyze how often your queries are utilizing the shared buffer cache. Just like pg_stat_user_tables, you’ll need to start a psql session and specify a database and a user that has read access to the database. This view displays a cumulative count of blocks read, the number of blocks that were hits in the shared buffer cache, as well as other information about the types of blocks that were read from each table.
SELECT * FROM pg_statio_user_tables;
relid | schemaname | relname | heap_blks_read | heap_blks_hit | idx_blks_read | idx_blks_hit | toast_blks_read | toast_blks_hit | tidx_blks_read | tidx_blks_hit
-------+------------+------------+----------------+---------------+---------------+--------------+-----------------+----------------+----------------+---------------
16463 | public | customers | 492 | 5382 | 137 | 4 | 0 | 0 | 0 | 0
16488 | public | reorder | 0 | 0 | | | | | |
16478 | public | orders | 104 | 1100 | 70 | 2 | | | |
16454 | public | categories | 5 | 7 | 2 | 0 | | | |
16484 | public | products | 105 | 909 | 87 | 0 | | | |
16473 | public | orderlines | 389 | 3080 | 167 | 0 | | | |
16458 | public | cust_hist | 331 | 2616 | 167 | 0 | | | |
16470 | public | inventory | 59 | 385 | 29 | 0 | | | |
(8 rows)
You can also calculate a hit rate of blocks read from the shared buffer cache, using a query like this:
SELECT sum(heap_blks_read) as blocks_read, sum(heap_blks_hit) as blocks_hit, sum(heap_blks_hit) / (sum(heap_blks_hit) + sum(heap_blks_read)) as hit_ratio FROM pg_statio_user_tables;
blocks_read | blocks_hit | hit_ratio
-------------+------------+------------------------
1485 | 13479 | 0.90076182838813151564
(1 row)
You may recall from Part 1 that the heap_blks_hit statistic only tracks the number of blocks that were hits in the shared buffer cache. Even if a block wasn’t recorded as a hit in the shared buffer cache, it may still have been accessed from the OS cache rather than read from disk. Therefore, monitoring pg_statio_user_tables alongside system-level metrics will provide a more accurate assessment of how often data was queried without having to access the disk.
pg_stat_user_indexes shows us how often each index in any database is actually being used. Querying this view can help you determine if any indexes are underutilized, so that you can consider deleting them in order to make better use of resources.
To query this view, start a psql session, making sure to specify the database you’d like to query, and a user that has read access to that database. Now you can query this view like any other table, like so:
SELECT * FROM pg_stat_user_indexes;
relid | indexrelid | schemaname | relname | indexrelname | idx_scan | idx_tup_read | idx_tup_fetch
-------+------------+------------+------------+-------------------------+----------+--------------+---------------
16454 | 16491 | public | categories | categories_pkey | 0 | 0 | 0
16463 | 16493 | public | customers | customers_pkey | 0 | 0 | 0
16470 | 16495 | public | inventory | inventory_pkey | 0 | 0 | 0
16478 | 16497 | public | orders | orders_pkey | 0 | 0 | 0
16484 | 16499 | public | products | products_pkey | 0 | 0 | 0
16458 | 16501 | public | cust_hist | ix_cust_hist_customerid | 0 | 0 | 0
16463 | 16502 | public | customers | ix_cust_username | 0 | 0 | 0
16478 | 16503 | public | orders | ix_order_custid | 0 | 0 | 0
16473 | 16504 | public | orderlines | ix_orderlines_orderid | 0 | 0 | 0
16484 | 16505 | public | products | ix_prod_category | 0 | 0 | 0
16484 | 16506 | public | products | ix_prod_special | 0 | 0 | 0
(11 rows)
To track how these statistics change over time, let’s try querying data by using one of the indexes:
SELECT * FROM customers WHERE customerid=55;
customerid | firstname | lastname | address1 | address2 | city | state | zip | country | region | email | phone | creditcardtype | creditcard | creditcardexpiration | username | password | age | income | gender
------------+-----------+------------+---------------------+----------+---------+-------+-------+---------+--------+---------------------+------------+----------------+------------------+----------------------+----------+----------+-----+--------+--------
55 | BHNECK | XVDQMTQHMH | 3574669247 Dell Way | | DHFGOUC | NE | 51427 | US | 1 | XVDQMTQHMH@dell.com | 3574669247 | 1 | 8774650241713972 | 2009/07 | user55 | password | 61 | 60000 | M
(1 row)
Now, when we query pg_stat_user_indexes, we can see that the statistics collector detected that an index scan occurred on our customers_pkey index:
SELECT * FROM pg_stat_user_indexes;
relid | indexrelid | schemaname | relname | indexrelname | idx_scan | idx_tup_read | idx_tup_fetch
-------+------------+------------+------------+-------------------------+----------+--------------+---------------
16454 | 16491 | public | categories | categories_pkey | 0 | 0 | 0
16463 | 16493 | public | customers | customers_pkey | 1 | 1 | 1
16470 | 16495 | public | inventory | inventory_pkey | 0 | 0 | 0
16478 | 16497 | public | orders | orders_pkey | 0 | 0 | 0
16484 | 16499 | public | products | products_pkey | 0 | 0 | 0
16458 | 16501 | public | cust_hist | ix_cust_hist_customerid | 0 | 0 | 0
16463 | 16502 | public | customers | ix_cust_username | 0 | 0 | 0
16478 | 16503 | public | orders | ix_order_custid | 0 | 0 | 0
16473 | 16504 | public | orderlines | ix_orderlines_orderid | 0 | 0 | 0
16484 | 16505 | public | products | ix_prod_category | 0 | 0 | 0
16484 | 16506 | public | products | ix_prod_special | 0 | 0 | 0
(11 rows)
As mentioned in Part 1, monitoring the checkpoint process can help you determine how much load is being placed on your databases. The pg_stat_bgwriter view will return one row of data that shows the number of total checkpoints occurring across all databases in your cluster, broken down by the type of checkpoint (timed or requested), and how they were executed—during a checkpoint process (buffers_checkpoint), by backends (buffers_backend), or by the background writer (buffers_clean):
SELECT * FROM pg_stat_bgwriter;
checkpoints_timed | checkpoints_req | checkpoint_write_time | checkpoint_sync_time | buffers_checkpoint | buffers_clean | maxwritten_clean | buffers_backend | buffers_backend_fsync | buffers_alloc | stats_reset
-------------------+-----------------+-----------------------+----------------------+-------------------+--------------+------------------+-----------------+---------------------+--------------+-------------------------------
7768 | 12 | 321086 | 135 | 4064 | 0 | 0 | 368475 | 0 | 5221 | 2017-09-07 17:24:56.770953-04
(1 row)
Although most of the metrics covered in Part 1 are available through PostgreSQL’s predefined statistics views, these three types of metrics need to be accessed through system administration functions and other native sources:
In order to track replication delay, you’ll need to query recovery information functions on each standby server that is in continuous recovery mode (which simply means that it continuously receives and applies WAL updates from the primary server). Replication delay tracks the delay between applying the WAL update (“replaying” the update that already happened on the primary), and applying that WAL update to disk.
To calculate replication lag (in bytes) on each standby, you’ll need to find the difference between two recovery information functions: pg_last_xlog_receive_location() (the location in the WAL file that was most recently synced to disk on the standby), and pg_last_xlog_replay_location() (the location in the WAL file that was most recently applied/replayed on the standby). Note that these functions have been renamed in PostgreSQL 10, to pg_last_wal_receive_lsn() and pg_last_wal_replay_lsn(). To calculate this lag in seconds instead of bytes, you can extract the timestamp from pg_last_xlog_replay_location() or pg_last_wal_replay_lsn(), depending on what version you’re running.
Although you can access the number of active connections through pg_stat_database, you’ll need to query pg_settings to find the server’s current setting for the maximum number of connections:
SELECT setting::float FROM pg_settings WHERE name = 'max_connections';
If you use a connection pool like PgBouncer to proxy connections between your applications and PostgreSQL backends, you can also monitor metrics from your connection pool in order to ensure that connections are functioning as expected.
You can also track the most recent status of locks granted across each of your databases, by querying the pg_locks view. The following query provides a breakdown of the type of lock (in the mode column), as well as the relevant database, relation, and process ID.
SELECT locktype, database, relation::regclass, mode, pid FROM pg_locks;
locktype | database | relation | mode | pid
---------------+----------+----------+------------------+-----
relation | 12066 | pg_locks | AccessShareLock | 965
virtualxid | | | ExclusiveLock | 965
relation | 16611 | 16628 | AccessShareLock | 820
relation | 16611 | 16628 | RowExclusiveLock | 820
relation | 16611 | 16623 | AccessShareLock | 820
relation | 16611 | 16623 | RowExclusiveLock | 820
virtualxid | | | ExclusiveLock | 820
relation | 16611 | 16628 | AccessShareLock | 835
relation | 16611 | 16623 | AccessShareLock | 835
virtualxid | | | ExclusiveLock | 835
transactionid | | | ExclusiveLock | 820
(11 rows)
You’ll see an object identifier (OID) listed in the database and relation columns. To translate these OIDs into the actual names of each database and relation, you can query the database OID from pg_database, and the relation OID from pg_class.
PostgreSQL provides database object size functions to help users track the amount of disk space used by their tables and indexes. For example, below, we query the size of mydb using the pg_database_size function. We also use pg_size_pretty() to format the result into a human-readable format:
SELECT pg_size_pretty(pg_database_size('mydb')) AS mydbsize;
mydbsize
------------
846 MB
(1 row)
You can check the size of your tables by querying the object ID (OID) of each table in your database, and using that OID to query the size of each table from pg_table_size. The following query will show you how much disk space the top five tables are using (excluding indexes):
SELECT
relname AS "table_name",
pg_size_pretty(pg_table_size(C.oid)) AS "table_size"
FROM
pg_class C
LEFT JOIN pg_namespace N ON (N.oid = C.relnamespace)
WHERE nspname NOT IN ('pg_catalog', 'information_schema') AND nspname !~ '^pg_toast' AND relkind IN ('r')
ORDER BY pg_table_size(C.oid)
DESC LIMIT 5;
table_name | table_size
------------------+------------
pgbench_accounts | 705 MB
customers | 3944 kB
orderlines | 3112 kB
cust_hist | 2648 kB
products | 840 kB
(5 rows)
You can customize these queries to gain more granular views into disk usage across tables and indexes in your databases. For example, in the query above, you could replace pg_table_size with pg_total_relation_size, if you’d like to include indexes in your table_size metric (by default table_size shows disk space used by the tables, and excludes indexes). You can also use regular expressions to fine-tune your queries.
As we’ve seen here, PostgreSQL’s statistics collector tracks and reports a wide variety of metrics about your databases’ activity. Rather than querying these statistics on an ad hoc basis, you may want to use a dedicated monitoring tool to automatically query these metrics for you. The open source community has developed several such tools to help PostgreSQL users monitor their database activity. In this section, we’ll explore one such option and show you how it can help you automatically aggregate some key statistics from your databases and view them in an easily accessible web interface.
PgHero is an open source PostgreSQL monitoring tool that was developed by Instacart. This project provides a dashboard that shows the health and performance of your PostgreSQL servers. It is available to install via a Docker image, Rails engine, or Linux package.
In this example, we will install the Linux package for Ubuntu 14.04 by following the directions detailed here.
Next, we need to provide PgHero with some information (make sure to replace the user, password, hostname, and name of your database, as specified below), and start the server:
sudo pghero config:set DATABASE_URL=postgres://<USER>:<PASSWORD>@<HOSTNAME>:5432/<NAME_OF_YOUR_DB>
sudo pghero config:set PORT=3001
sudo pghero config:set RAILS_LOG_TO_STDOUT=disabled
sudo pghero scale web=1
Now we can check that the server is running, by visiting http://<PGHERO_HOST>:3001/ in a browser (or localhost:3001, if you’re on the server that is running PgHero).
You should see an overview dashboard of your PostgreSQL database, including info about any long-running queries, the number of healthy connections, and invalid or duplicate indexes. You can also gather metrics from more than one database by following the instructions specified here.
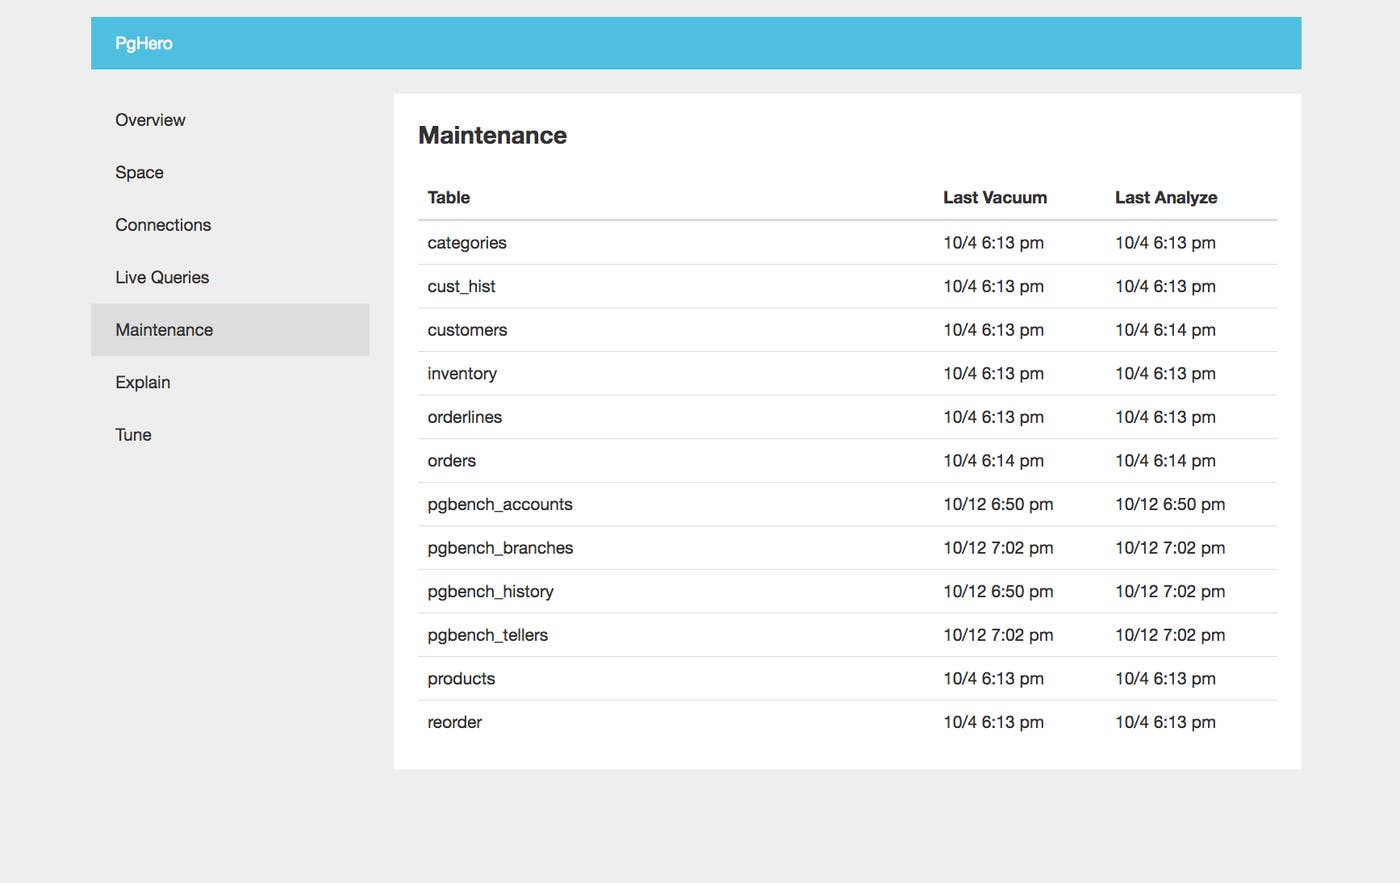
In the Maintenance tab, you can see the last time each table in the database completed a VACUUM and ANALYZE process. As mentioned in Part 1, VACUUM processes help optimize reads by removing dead rows and updating the visibility map. ANALYZE processes are also important because they provide the query planner with updated statistics about the table. Both of these processes help ensure that queries are optimized and remain as efficient as possible.
PgHero will show you a visual breakdown of active connections, aggregated by database and user:
Monitoring disk and index usage is also an important way to gauge the health and performance of your databases. PgHero shows you how much space each relation (table or index) is using, as well as how many indexes are currently unused. The dashboard below shows us that four of our indexes are currently unused, and advises us to “remove them for faster writes.”
In this post, we’ve walked through how to use native and open source PostgreSQL monitoring tools to query metrics from your databases. All metrics accessed from pg_stat_* views will be cumulative counters, so it’s important to regularly collect the metrics and monitor how they change over time. If you’re running PostgreSQL in production, you can use a more robust monitoring platform to automatically aggregate these metrics on your behalf, and to visualize and alert on potential issues in real time.
In the next part of this series, we’ll show you how to use Datadog to automatically query your PostgreSQL statistics, visualize them in dashboards, and analyze health and performance in context with the rest of your systems. We’ll also show you how to optimize and troubleshoot PostgreSQL performance with Datadog’s distributed tracing and APM.
此内容由惯性聚合(RSS阅读器)自动聚合整理,仅供阅读参考。 原文来自 — 版权归原作者所有。