


Your application’s health depends on the performance of its underlying infrastructure. Unexpectedly heavy processes can deprive your services of the resources they need to run reliably and efficiently, and prevent other workloads from executing. If one of your applications is triggering a high CPU or RSS memory utilization alert, the issue has likely occurred before. But without access to that historical context, determining the root cause is no less challenging than when the issue first occurred.
To reduce MTTR for debugging resource consumption issues, Datadog is thrilled to announce that you can now generate globally accurate aggregations of process metrics across any subset of your applications and infrastructure. These metrics will be stored at full granularity for 15 months, giving you rich historical context for exploring trends in your data and troubleshooting performance degradations of infrastructure components.
In this post, we’ll walk through how you can:
generate and manage process metrics
analyze historical trends in your infrastructure load
leverage percentile aggregates to spot outlying processes
use processes alongside other telemetry data to identify the root cause of issues
detect future issues more proactively with alerts and SLOs
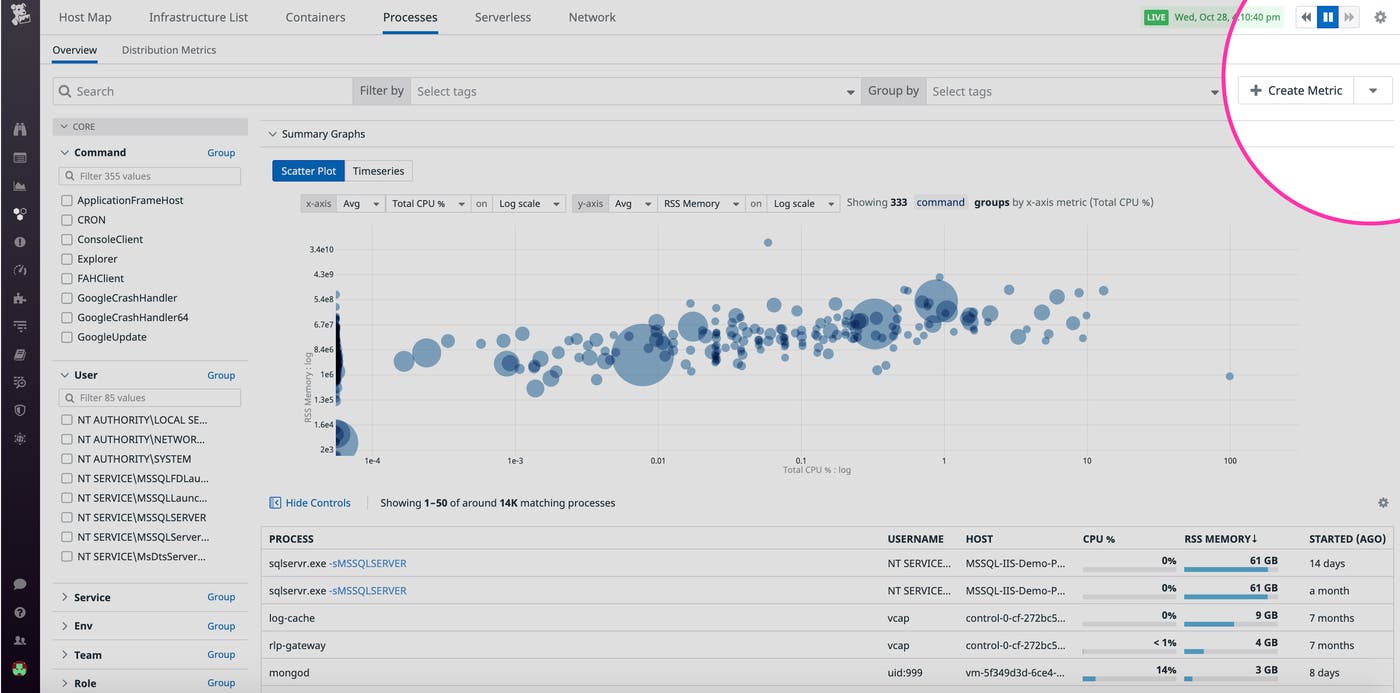
As you explore your processes in the Live Process view, you can create a process metric by clicking on the Create Metric button. Filter and group your processes using any tags or attributes that exist in your environment (e.g., host, availability zone, service), and select a metric to track (e.g., thread count, normalized CPU percentage, RSS memory).
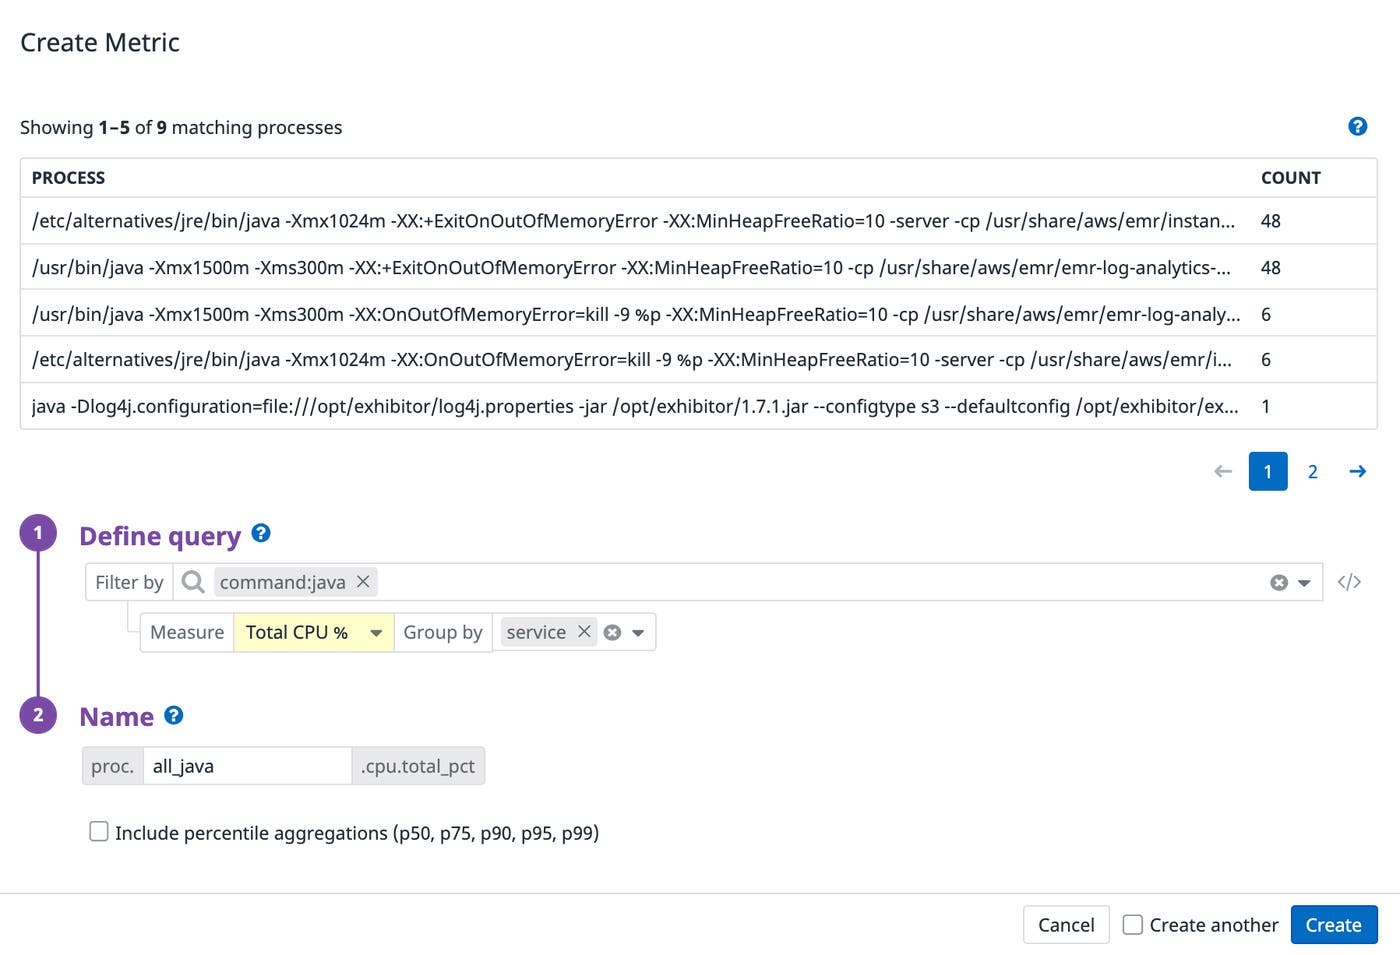
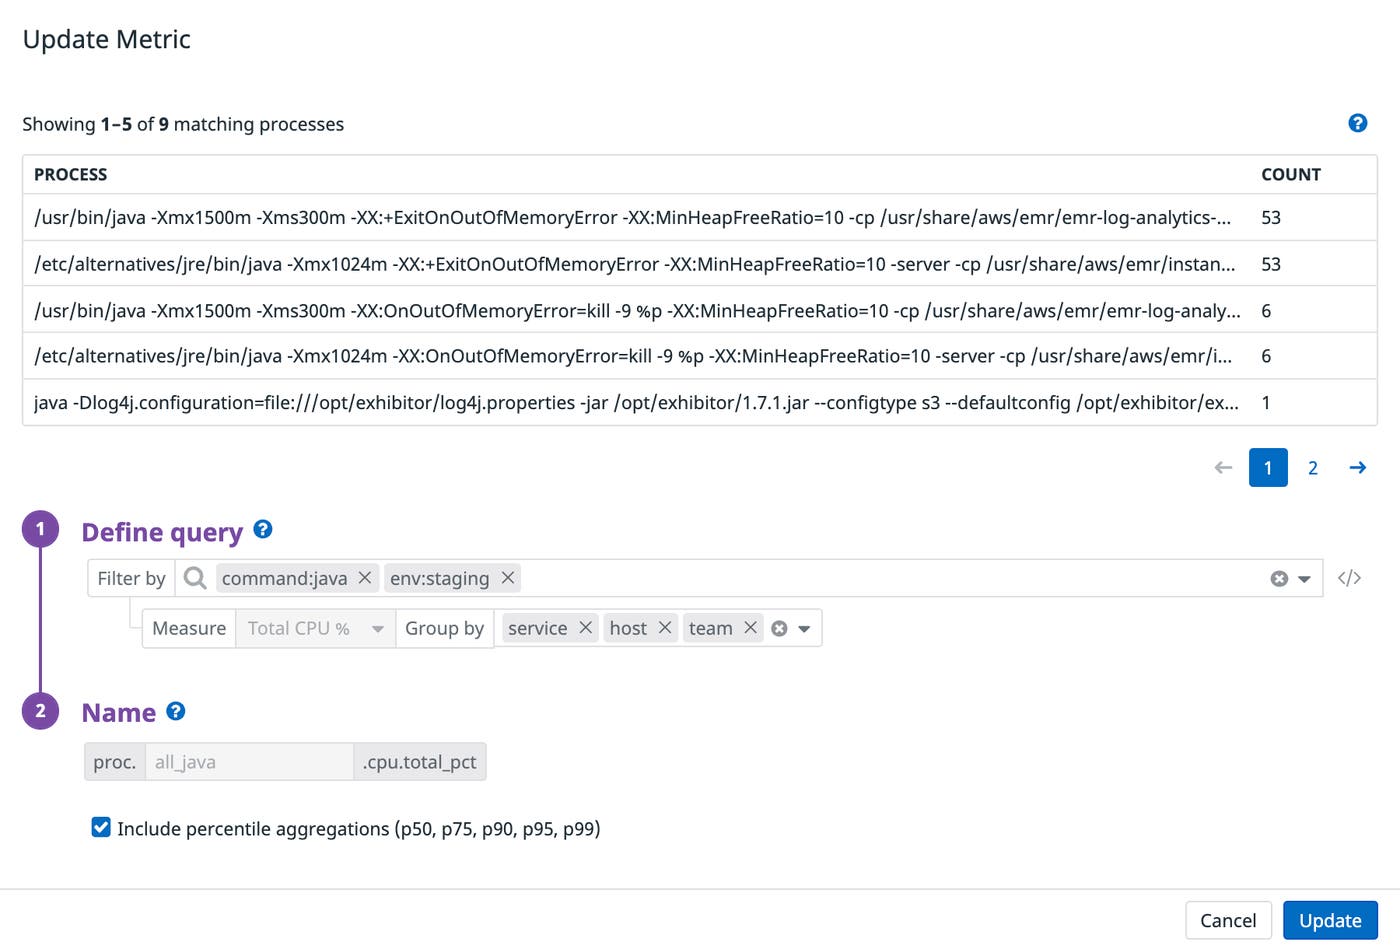
Below, we are generating a metric to track the CPU utilization of Java processes at the service level. This lets you identify which of your services are chewing up resources and can be optimized, for instance by finding and terminating runaway processes that are preventing other processes from executing.
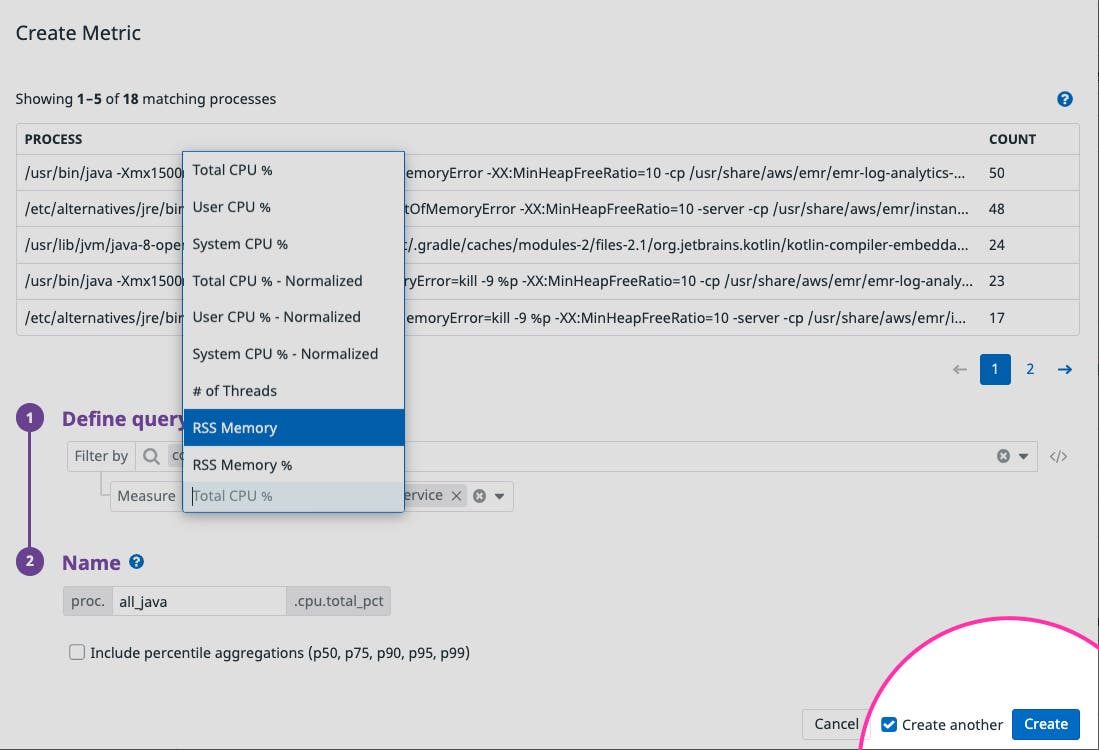
We’ve also designed this feature such that you can generate multiple metrics for the same group of processes within seconds. For instance, after you’ve created a metric to track the CPU consumption of Java processes, you can select Create another to create another metric that tracks RSS memory of the same group of processes.
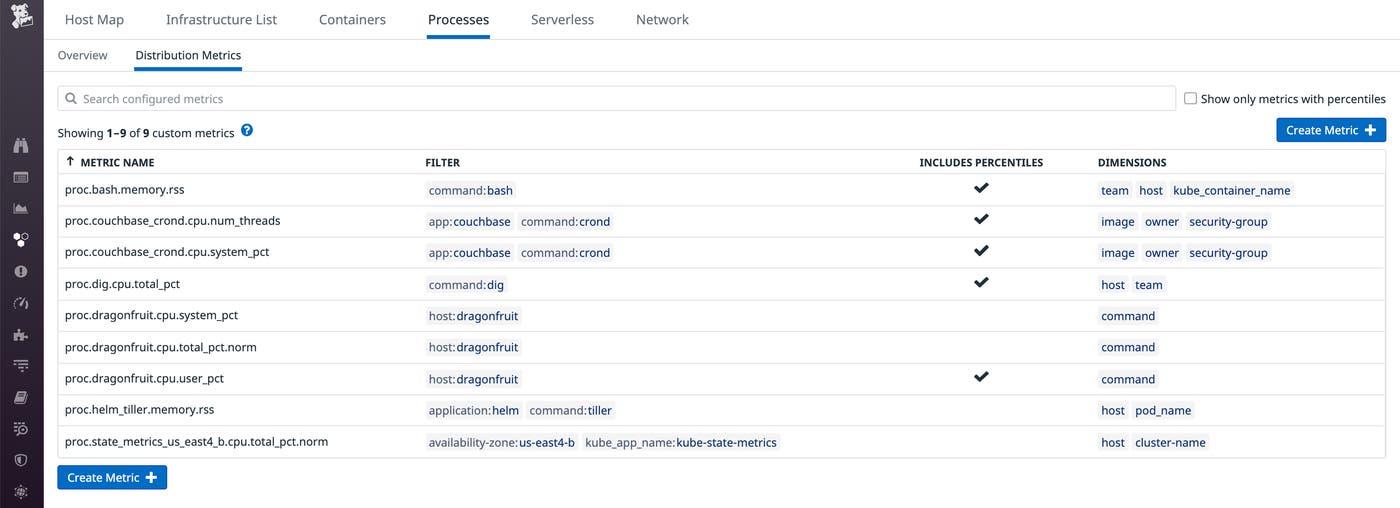
You can also apply percentile aggregations—p50, p75, p90, p95, and p99—to your process metrics by clicking on the Include percentile aggregations checkbox, selecting the relevant metrics, and applying any tags you would like to use for aggregation. All the metrics you create will appear in the Distribution Metrics tab of the Live Process view. If you are interested in expanding the scope of any existing metrics to include processes from more applications or commands, you can easily update your metric definition, as shown below.
Live Processes retains your process-level data for 36 hours, making it useful for pinpointing resource contention issues—and debugging them as soon as they arise. But in order to effectively analyze historical trends in resource contention at the process level, you need these metrics to be available over a longer period of time.
Now that you can generate and retain process metrics for 15 months, you can identify issues surfaced by days-old processes that would have otherwise gone unnoticed (e.g., if they only started causing problems over the weekend). Graphing these process metrics in dashboards—and breaking them down by command—lets you easily determine whether an anomalous spike in resource usage is caused by an internal or third-party service.
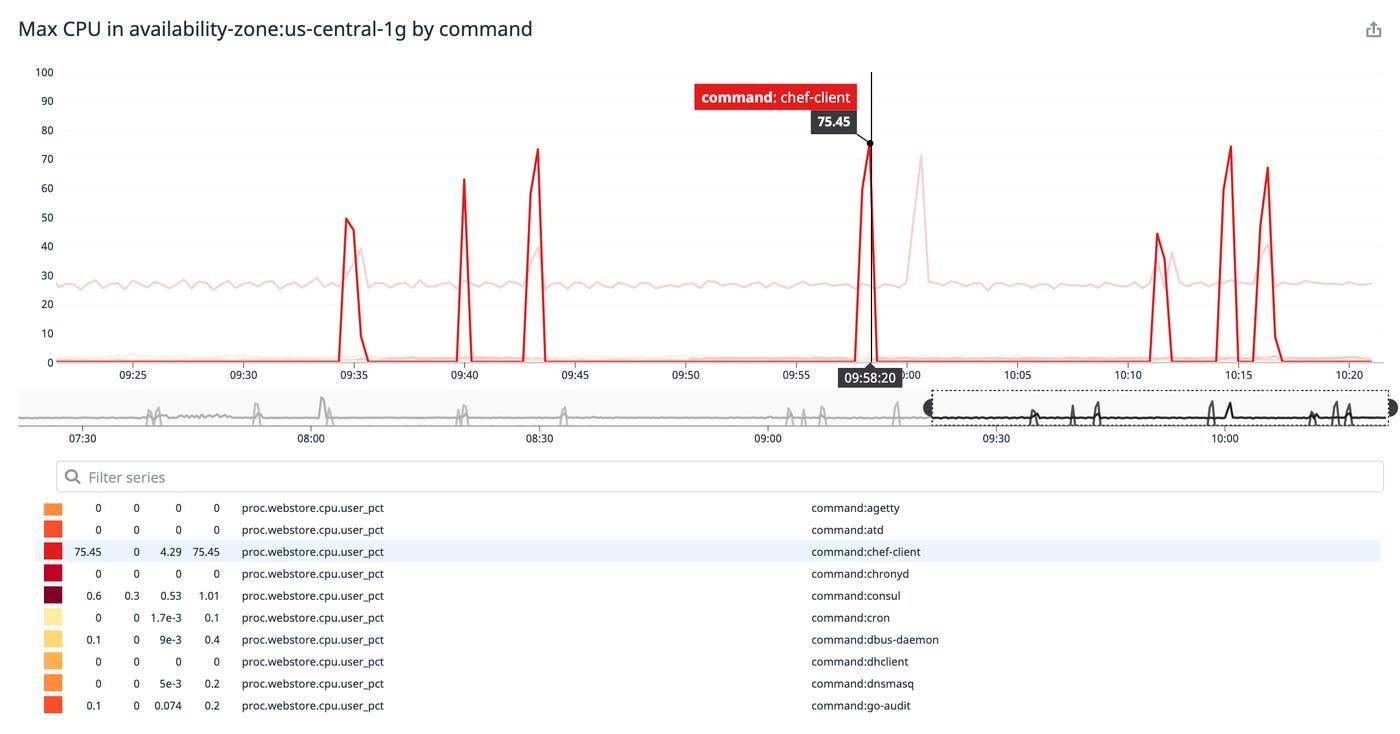
From this high-level overview, you can then drill down into the CPU or RSS memory of a particular command to spot regressions of the software you maintain or rely on.

With unified service tagging, you can apply a version tag to your services and use it to filter your process metrics to validate the success of migrations and deployments. If you see unusual trends in resource utilization after a code change, you can easily drill into all your telemetry data from the affected version. Besides validating deployments, you can also track your system’s ability to handle regular stress and load tests over time for any notable progress or setbacks. And with notebooks, teams can reference recent infrastructure issues against past behavior—and document successful mediation techniques for recurring issues.
As your infrastructure becomes larger and more distributed, you could be running up to tens or hundreds of processes every day. Distribution metrics allow you to analyze this high-cardinality data at a glance by computing globally accurate aggregations. Non-percentile aggregations (e.g., min, max, sum, average, and process count) and percentile aggregations (e.g., 50th, 75th, 90th, 95th, and 99th percentiles) concisely summarize resource consumption of processes running on any meaningful subset of hosts or containers.
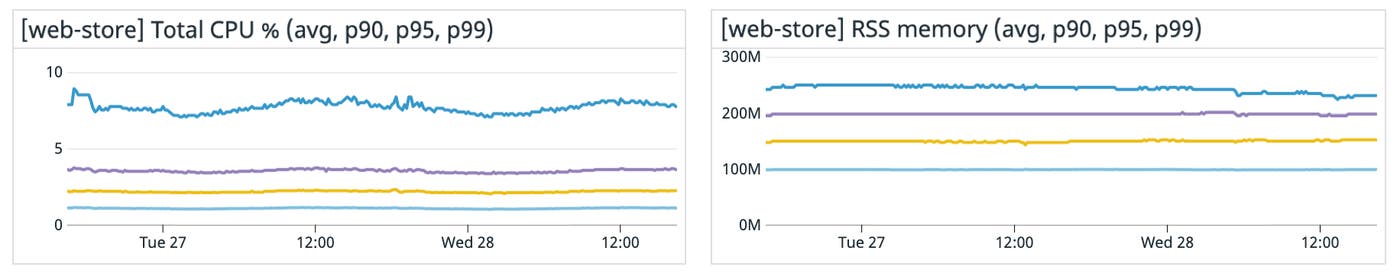
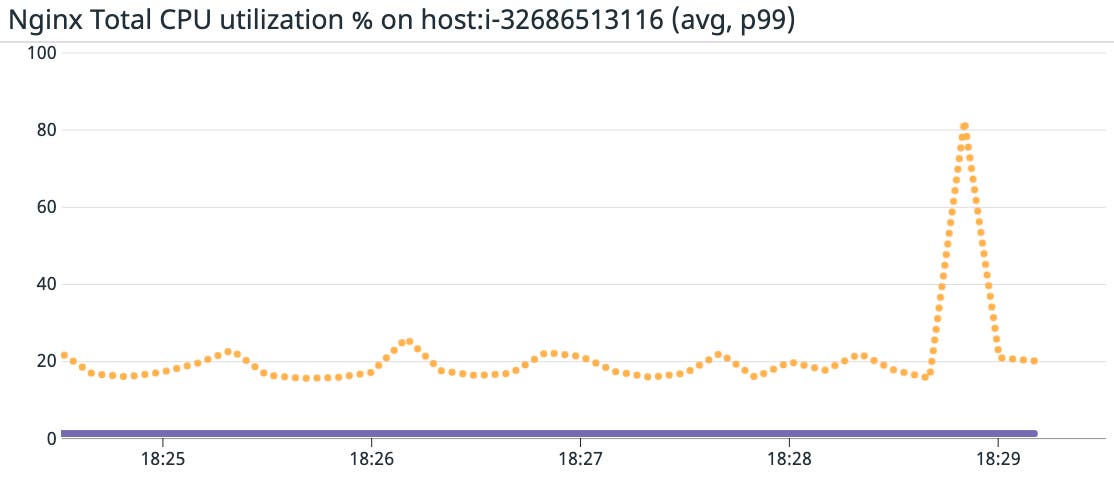
Max and percentile CPU and RSS memory distributions highlight which processes are consuming the most resources and where they are running. While high average CPU and RSS memory usage can indicate high resource consumption, percentile metrics like p95 and p99 allow you to spot outlier processes, which can unexpectedly reduce the efficiency and capacity of the host on which they are running.
Pinpointing these outliers enables you to quickly distinguish pertinent infrastructure issues from inconsequential noise. For instance, an especially heavy process could contribute to a high average CPU of a single host, or hosts running a particular software in a specific region. Percentile metrics go beyond the average metric to highlight such processes, so you can more quickly detect when high resource consumption is the root of infrastructure issues.
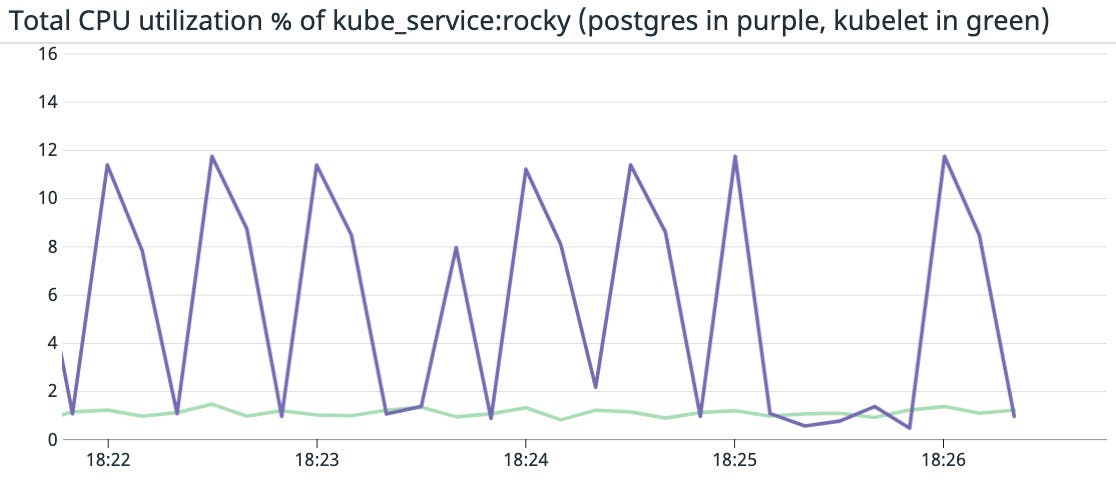
You can also use distribution metrics to differentiate between primary and secondary workloads (e.g., packet forwarder, proxy, service mesh) on a given host, and track their resource consumption simultaneously. This can help you determine whether one workload is consuming and taking away resources from the other. In the example below, we graphed the average normalized CPU utilization of a primary workload (postgres, in purple) and the Kubernetes node agent (kubelet, in green) for a particular Kubernetes service.
Application performance issues can stem from the infrastructure, container, or network level. By monitoring process metrics alongside distributed traces, logs, infrastructure metrics, and network flow data, you no longer have to make any assumptions about the root cause of an issue—you can use a process of elimination to pinpoint the exact culprit.
For instance, if your Cassandra database is facing high write latency, it could be due to a number of reasons. Perhaps there is a service issue at the code level, which would be surfaced by APM. However, this is not always the case—you might be seeing high latency but no errors.
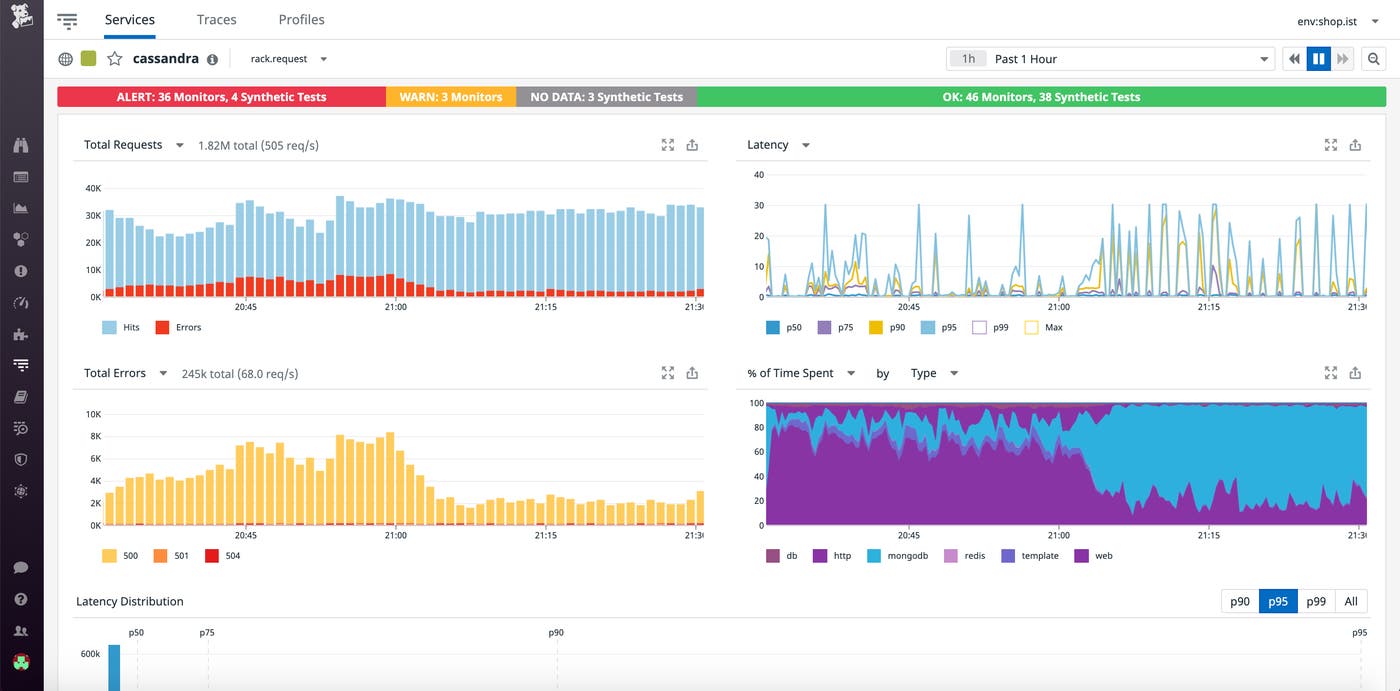
With Network Performance Monitoring, you can identify whether the service’s underlying infrastructure is getting overloaded by traffic. Alternatively, Cassandra may have low connectivity in traffic with other services that it depends on.

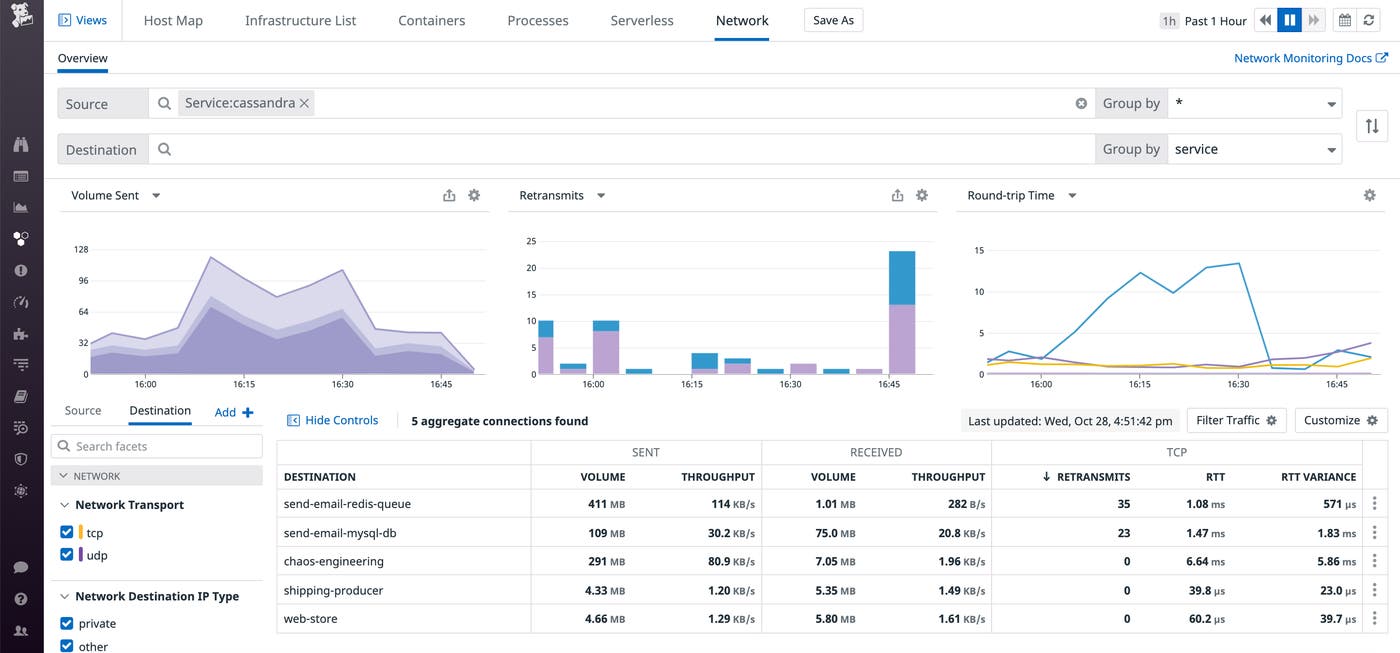
Finally, you can use process metrics to determine whether the underlying hosts or containers are running hot by identifying heavy processes that are eating up their CPU. In this case, knowing that an underlying host is running hot is not enough to identify the root cause of the application latency—you also need to know why it is running hot. Grouping your process metrics by command gives you this granularity, letting you identify which piece of software is eating up your CPU.
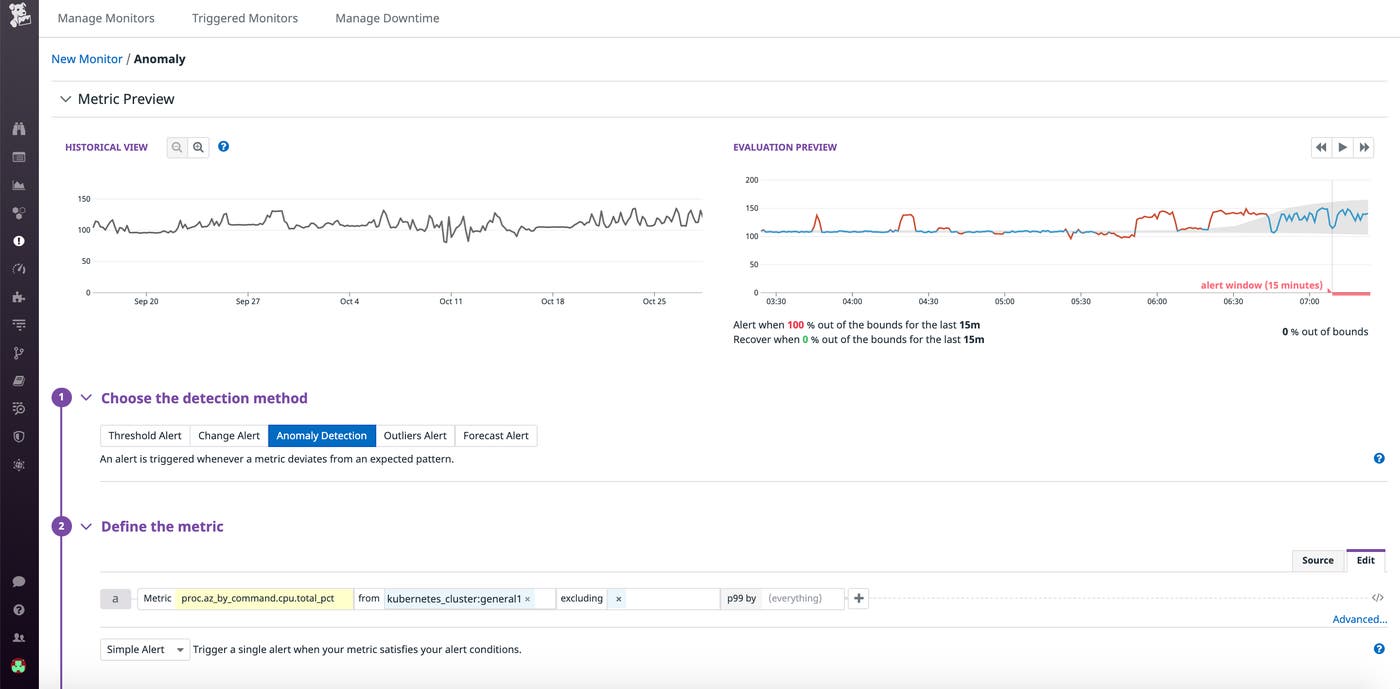
In Datadog, you can build sophisticated alerts to notify you of any potential process-related issues. Live Process monitors already allow you to set threshold-based alerts on the count of processes running a certain command or on a certain subset of your infrasture. Distribution metrics extend this functionality by providing anomaly-based alerting for any process metric.
For instance, you can apply anomaly detection to the 99th percentile CPU usage of Kubernetes clusters to be automatically notified when they deviate from normal levels. If any of your alerts trigger and you’re in the middle of an incident, pulling process metric graphs into a notebook—and documenting any insights in real time—can help your on-call team respond to the issue more effectively.
In addition to alerting, Datadog enables teams within your organization to track and visualize all their SLOs in the same place as the data you might be collecting from our 1,000+ integrations. By scoping your process metrics to the services that make up a request latency SLO, for instance, you’ll be able to drill into any resource-intensive Redis instances or Puma workers—and see how your optimizations are contributing to a positive end user experience. You can then communicate the real-time status of your SLOs—along with their impact on the bottom line—with both internal and external stakeholders.
Process metrics are now available—check out our documentation to learn more. If you’re not yet using Datadog to monitor your applications and infrastructure, you can sign up for a free 14-day trial today.
此内容由惯性聚合(RSS阅读器)自动聚合整理,仅供阅读参考。 原文来自 — 版权归原作者所有。