


Google Kubernetes Engine (GKE) is a managed Kubernetes service on Google Cloud Platform (GCP). GKE allows cluster operators to focus on running containerized applications without the overhead of managing the Kubernetes control plane.
GKE comes in two modes: Standard and Autopilot. Google’s documentation provides an in-depth comparison of these two options. The key difference is that with GKE Standard, the cluster operator remains responsible for managing individual cluster nodes, whereas with Autopilot, GKE manages those nodes for you.
Due to Kubernetes’s compartmentalized nature and dynamic scheduling, it can be difficult to diagnose points of failure or track down other issues in your infrastructure. Whether you’re using GKE Standard or Autopilot, you will need to collect metrics and other application performance data from across your cluster—such as CPU and memory usage, container and pod events, network throughput, and individual request traces—so you can be ready to tackle any issue you might encounter.
In this post, we’ll walk through:
When monitoring Kubernetes-based environments, several different types of information can facilitate effective observability and enable you to troubleshoot issues in containerized applications:
Metrics need to be gathered from the pods running in the cluster, so you can understand the application’s performance.
Logs must be sent from the application pods to a centralized environment, enabling you to gather helpful context for troubleshooting.
Distributed traces enable you to get visibility into requests as they propagate across services and applications, so you can troubleshoot performance issues.
At the node level, it’s important to get insights into performance and capacity by gathering metrics and logs from the kubelet and also the underlying host.
Monitoring the volume of traffic sent between services running in the cluster can help you optimize the performance of those services.
Lastly, even though GKE manages the control plane for you, it’s still important to monitor the performance of the Kubernetes control plane components in order to ensure a healthy cluster.
Given the ephemeral nature of containerized applications, it’s important to ensure that your telemetry data is appropriately tagged so it can be associated with higher-level Kubernetes objects like Deployments and Services. Datadog automatically imports metadata from Kubernetes, Docker, and other technologies, and tags your monitoring data accordingly, so you can get deeper insights into your infrastructure and applications.
Next, we’ll explore how you can collect and monitor all of these types of data to get deep visibility into your GKE clusters. First, we’ll walk through the components you’ll need to monitor GKE with Datadog.
In order to effectively monitor a GKE cluster with Datadog, you will need to deploy two components. First, the Datadog Agent needs to be deployed to each worker node in the cluster. The Agent can monitor processes and files on the node and forward that information to Datadog.
The second component is the Cluster Agent, which runs on a single node in the cluster. The Cluster Agent helps reduce the load on the Kubernetes API server by acting as a proxy for the individual node-based Agents. It also performs some cluster-level tasks, for example, by acting as an external metrics server for Horizontal Pod Autoscaling.
The Cluster Agent also provides a Kubernetes Admission Controller that can automatically inject tags and environment variables into pods running in the cluster, ensuring that data is appropriately classified when viewed in Datadog.
Before deploying the Datadog Agent and Cluster Agent to your GKE environment, you will need to complete a few prerequisites. As some of the metrics and logs come from the GCP platform itself, you’ll need to enable the Datadog GCP integration. It’s important to enable both the gathering of metrics and logs to get all the information relevant to your GKE clusters. Additionally, to gain access to metrics for the Kubernetes control plane components, such as the API server and scheduler, you should enable the collection of GKE control plane metrics.
Now you’re ready to deploy the Datadog Agent and Cluster Agent on your GKE cluster. If you’re using GKE Standard, you have two options to suit different cluster management approaches. One method is to use the Datadog Operator to effectively manage the lifecycle of the Datadog Agent, ensure that Agents are kept up to date, and report the Agent’s configuration status via the Operator’s CRD. Alternatively, you can use our Helm chart to customize and deploy the necessary Datadog Kubernetes components on your GKE cluster. If you’re using GKE Autopilot, the Helm chart is the best way to install Datadog, as the Operator is not currently supported. Consult our documentation to get detailed instructions for installing Datadog on GKE Standard and Autopilot.
Once the Datadog Agent has been fully deployed to your cluster, you’ll have access to a wide array of information that can help you effectively manage and troubleshoot issues. This covers both the Kubernetes clusters themselves and also components of those clusters, like information on the container images in use.
Datadog provides two out-of-the-box GKE dashboards, in addition to general Kubernetes dashboards. First, the GKE Standard dashboard displays many key metrics from your GKE cluster, including the control plane.
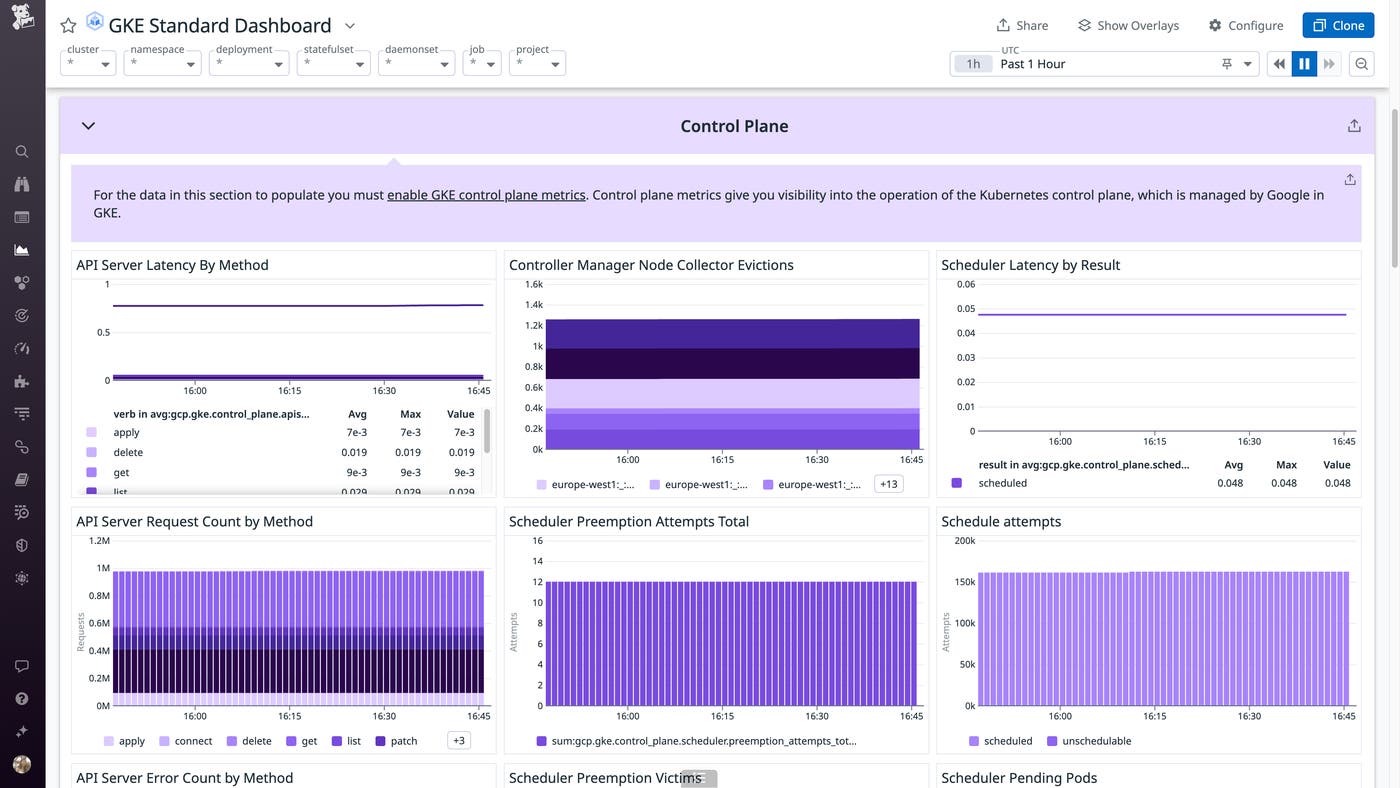
In the Overview section of the dashboard, you can see a host map that visualizes the CPU usage of nodes in your clusters. This can help you quickly identify nodes that exhibit high CPU usage, which may impact workload performance. You can also use this visualization to identify underutilized nodes that could be downsized, enabling you to cut costs for those resources.
For more detailed insights into the health and performance of your GKE cluster, you can view the GKE Enhanced dashboard. If you’ve enabled log collection, this dashboard will also display logs that could be useful for troubleshooting.
In addition to dashboards, Datadog also provides a few other ways to visualize and drill down into the details of the workloads and other resources in your GKE cluster.
The Kubernetes Overview Page provides key statistics about your clusters, and serves as a great starting point for troubleshooting activities.
The “Troubleshooting Patterns” section of this page helps you spot issues that may require further investigation, such as container restarts. Container restart patterns are an interesting area to focus on. Restarts could indicate problems with the application running in the containers. They could also indicate problems with pulling container images.
The pods view also provides another way to identify potential issues in your cluster. At the top of the page, you can see Watchdog Insights, which show you noteworthy trends identified in your clusters. For example, Watchdog Insights may highlight an anomalous increase in the percentage of unavailable replicas, unready pods, or restarted containers in your monitored clusters.
Watchdog Insights can help you quickly identify problems with your GKE clusters. In the example below, you can see an ongoing increase in the percentage of unready pods, which could point to an issue with a rollout or with the nodes running in the cluster.
Another powerful feature in the pods view is the ability to group by different categories, such as Kubernetes namespace or Deployment. For example, after grouping the pods view by Deployment, you may spot a problem that warrants further investigation, such as a specific Deployment which has a lot of pods that have crashed.
Node-level and pod-level metrics can point you in the right direction when an issue occurs, but to better identify issues and understand root causes, you often need to look at the application itself. For example, high CPU usage may or may not be a concern on its own, but if you see increased application latency combined with saturated CPU, you will want to take action. If you have enough depth of visibility, you might even discover that a specific function in your call stack is to blame. With the addition of application-level metrics, you can correlate and compare performance data across your infrastructure for better insights into the health and performance of your entire system.
Out of the box, the Datadog Agent will start collecting metrics from a number of common containerized services, such as Redis and Apache (httpd), thanks to its Autodiscovery feature. You can also configure the Agent to monitor any containerized services that require custom check configurations or authentication credentials by defining configuration templates.
With Datadog APM, you can trace real requests as they propagate across distributed services and infrastructure components, allowing you to precisely determine the performance of your applications. A trace is an end-to-end collection of spans that individually measure the amount of time that each function, or specified scope, in your call stack takes to complete. APM allows you to monitor the performance of every application and service in aggregate and at the request level, ensuring your system runs at peak performance.
Instructions for configuring the Datadog Agent to accept traces will differ slightly based on whether you used Helm or the Datadog Operator to deploy the Agent on your cluster. For more details, see our documentation for Helm and the Operator. Then consult our APM docs to learn how to configure your application pods to send traces to the Agent.
Once your application starts sending traces to the Agent, you can view your detailed request traces in Datadog APM, as shown below. Flame graphs visualize how a request was executed, so you can see which parts of the application are contributing to overall latency and dive into the details of each individual call or query.
In this post we have explored how to use Datadog to get insight into every facet of your GKE infrastructure. You can customize the out-of-the-box GKE dashboards to include the metrics that matter most to you, set up flexible alerting, configure anomaly detection, and more to meet the specific needs of your organization. And with over 1,000 integrations with popular technologies, you can monitor and correlate key metrics and events across your complex infrastructure.
If you are already using Datadog, you can start monitoring not only Google Kubernetes Engine, but the entire Google Cloud Platform by following our documentation. If you are not using Datadog yet and want to gain insight into the health and performance of your infrastructure and applications, you can get started by signing up for a 14-day free trial .
此内容由惯性聚合(RSS阅读器)自动聚合整理,仅供阅读参考。 原文来自 — 版权归原作者所有。