


In Part 2 of this series, we surveyed tools for monitoring SQL Server performance. If your SQL Server instances are part of a complex web application, handling queries from HTTP servers, running in a cluster, or otherwise connecting to other services, you’ll need a monitoring solution that can peer into your databases while keeping their interactions with your stack in the picture. Datadog provides end-to-end visibility into the health and performance of your SQL Server instances—along with 1,000+ other technologies running alongside them.
In this post, we will walk you through the process of setting up Datadog’s SQL Server integration to monitor metrics, distributed request traces, and logs in a single platform—and how to pivot between these sources to get insights into your system.
The Datadog Agent is open source software that gathers data from your hosts and sends it to Datadog for aggregation, visualization, and alerting. As we’ll see, the Agent can report metrics, distributed traces, and logs.
If you’re running SQL Server on Windows, install the Agent by logging into Datadog and following our documentation. As of the time of this writing, the SQL Server integration is available only for Windows. If you’re using Linux, you can install the Datadog Agent on a Windows host and configure it to monitor your Linux instances remotely.
To install the SQL Server integration, copy our example YAML file to the integration directory, C:\ProgramData\Datadog\conf.d\sqlserver.d. The Agent locates your SQL Server instances from the instances section:
init_config:
instances:
- host: <host>,<port>
username: <admin user>
password: <admin password>
For each instance you want to monitor, fill in the host address (or name, e.g., localhost) and port, plus the login details for a user with SELECT privileges for the sys.dm_os_performance_counters dynamic management view. Hosts in the instances section can be remote Linux machines, but any remote host will report metrics under the hostname you set in the Agent configuration file of your local monitoring machine.
Next, run this command to restart the Agent:
C:\Program Files\Datadog\Datadog Agent\embedded\agent.exe restart-service
You can see if the Agent is reporting by running the Agent information command and looking for the sqlserver section:
sqlserver
---------
Total Runs: 105
Metrics: 10, Total Metrics: 1050
Events: 0, Total Events: 0
Service Checks: 1, Total Service Checks: 105
The SQL Server integration gathers metrics by querying the sys.dm_os_performance_counters dynamic management view for key metrics like memory usage and the buffer cache hit ratio. As we’ll see in Part 4, you can complement this data with custom metrics by editing the integration’s YAML file.
Once you’ve set up Datadog’s SQL Server integration, you’ll see two out-of-the-box dashboards for SQL Server: a screenboard that gives you a real-time overview of your SQL Server instances and a timeboard that’s well suited for correlating SQL Server metrics with system metrics and events.
You can clone and customize these dashboards to visualize data from SQL Server alongside metrics from related systems. Custom dashboards can tell you at a glance when something in your infrastructure needs attention. Here we’ve created a screenboard that compares two timeseries graphs for a single host: batch requests per second and T-SQL compilations per second.
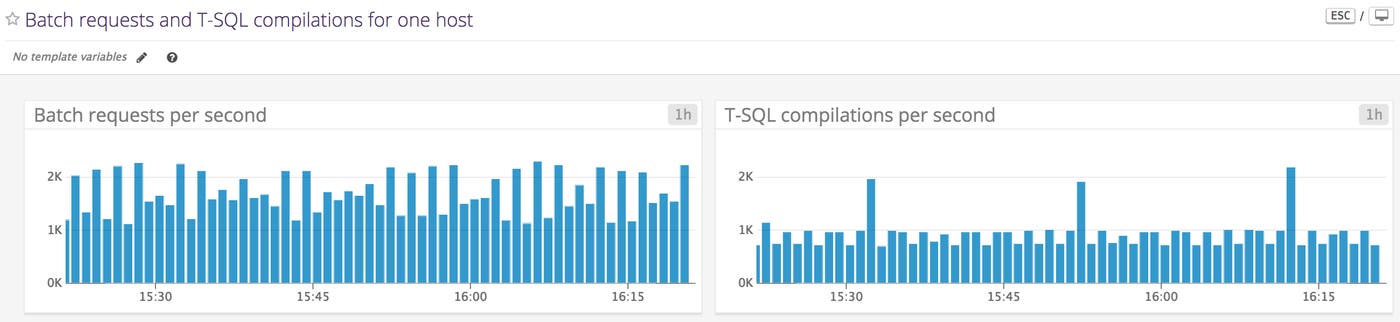
We can already see an issue: T-SQL batch compilations regularly approach the number of batch requests, which we know from Part 1 suggests that our batches are not benefiting from caching. We’ll want to consider taking steps like specifying parameters to make execution plans within the cache more reusable.
You can use Datadog distributed tracing and application performance monitoring (APM) to visualize requests in detailed flame graphs and generate latency, error, and throughput statistics for your applications. The Agent has built-in tracing support for common web frameworks and libraries in a growing number of languages, including popular ORMs for SQL Server.
In this example, we’ll be tracing requests to SQL Server within a Ruby on Rails application using Datadog’s tracing library. Links to similar libraries for other languages are available in the Datadog documentation.
To start tracing requests to SQL Server, make sure the Datadog Agent is installed on your application’s host. In the apm_config section of your Datadog configuration file, located at C:\ProgramData\Datadog\datadog.yaml, set apm_enabled to true. Follow the steps in our documentation to install the ddtrace gem, require it within your Rails application, and add a Rails initializer that will auto-instrument your application. The Agent will send traces to Datadog without any need to add individual collection points within your code.
The remaining steps customize the way traces appear within Datadog. Our Rails example includes the following in config/initializers/datadog-tracer.rb:
Datadog.configure do |c|
c.use :rails, service_name: 'pg-sqlserver-demo', database_service: 'pg-sqlserver-demo-db'
c.tracer env: 'demo'
end
In Datadog, traces and services are organized by environment, defaulting to env:none. You can easily set a different environment if you prefer—the example above tags service-level metrics and traces from our application with env:demo.
The configure block tells the Agent to instrument your Rails application automatically, and names two services that will appear in Datadog: a service_name for the main Rails application as well as a database_service. If you leave these unspecified, the Agent will derive the service_name from the application itself, and the database_service from the service_name plus the adapter for the database (e.g., sqlserver).
Once you’ve added your configuration details, restart the Agent. In the Datadog APM view, you’ll see a summary of requests to the two services.
If we navigate to the service-level dashboard for pg-sqlserver-demo-db, we can see that Datadog has grouped our SQL Server queries by T-SQL statement. You can sort statements by request count, average latency, and total time. In our case, we can see that SELECT queries to the customers table average twice as long as SELECT queries to the orders table. Viewing performance metrics by T-SQL statement is a quick way to determine which queries or tables to optimize.
We can monitor data from our T-SQL queries alongside other SQL Server metrics by navigating to the page for one of our T-SQL statements, clicking the menu icon for the “Total Requests” or “Latency” graphs, and adding the graphs to a Datadog timeboard. You can add graphs to a timeboard from any service dashboard within the Datadog APM view.
You can add timeseries graphs of service-level metrics to a custom timeboard, create views that compare the performance of various queries to your database service, and use these to help you investigate issues. For instance, you can create a dashboard to track queries to the customers and orders tables and compare them over time.
Datadog’s log management features are interwoven with metrics and tracing: you can correlate traces with system metrics to determine which services in your stack are contributing to issues, then examine the logs from those services to get context.
Custom log collection directs the Agent to listen on a port or tail a file, and send logs to Datadog as they arrive. You’ll point the Agent to an existing input source for logs, and determine how the logs will be parsed and enriched. In this example, our Rails application already logs its database transactions by default, and we’ll take advantage of this behavior when setting up custom log collection. You might choose a different source to accommodate your own configuration, such as the SQL Server error log.
Log management is bundled with the Agent as of version 6.x, and there’s no need to install additional log collection software. Sending SQL Server logs from our Rails application to Datadog takes only a few steps:
Edit the Datadog Agent configuration file
Add a configuration file for logs
Set up log processing rules (optional)
Edit the Datadog configuration file. Enable logging by changing logs_enabled to true within the Agent configuration file.
Add a configuration file for logs. In order to set up custom log collection, you will need to add a new folder within the Agent’s integration configuration directory, then add a YAML file to that folder. Datadog recommends naming the new folder after the source of your logs and the YAML file conf.yaml. For instance, in this case you would create a new config file at conf.d/ruby.d/conf.yaml:
logs:
- type: file
path: /shared/log/development.log
service: pg-sqlserver-demo
source: ruby
tags: env:demo
In this example, we’ve assigned values for four mandatory keys: type, path, service, and source. Our settings configure the Agent to tail the file (type) that exists at a certain path, connect the log to the service pg-sqlserver-demo, and associate it with the ruby integration. You can read about mandatory keys within the log management configuration file in the Datadog documentation.
You’ll notice that the service and env of our logs is the same as those of our traces. Our logs will be tagged automatically based on the configuration we’ve specified. We can use these tags for filtering in the logs view, as well as for navigating between metrics, traces, and logs for the same service and env.
Set up log processing rules. You may want to give the Agent additional instructions for collecting and pre-processing logs before they’re sent to Datadog. By default, the Agent will send logs to Datadog one line at a time. Depending on the format of your logs, you may need to report logs as multi-line chunks.
Datadog identifies a cluster of lines by matching a pattern. In the configuration file for Datadog log management, we’ve added a log processing rule within the first item under logs. We’ve defined a multi-line aggregation rule based on a particular string—so every time the Agent encounters the string &>&>& within the log file, it will identify a new log entry.
- type: file
# ...
log_processing_rules:
- type: multi_line
name: new_log_start_with_date
pattern: \&\>\&\>\&
We’ve also added a line to one of Rails’ configuration files:
config.log_tags = ["&>&>&"]
This line instructs Rails to tag each log with &>&>& (the string we specified in the log_processing_rules section of our configuration file).
You may also want to produce logs as JSON, a format that the Datadog Agent will parse automatically, without the need to define explicit parsing rules.
Now that you’ve configured log management, restart the Agent to start seeing your logs within Datadog.
Datadog lets you move with ease between service-level dashboards for your database, graphs of system metrics, and logs from moments of interest. If your SQL Server instances run into issues, you can navigate between metrics, logs, and traces to get the context you need for troubleshooting.
In the example below, the tracing dashboard for a Rails application displays a wave of errors, and the database service disappears from the graph “Total Time Spent by Service.”
One way to learn more about the issue is to navigate from our tracing dashboard to graphs of system metrics. You can do this by clicking a trace, then clicking the “Host Info” tab, which gives you a selection of dashboards right within the tracing view. Or you can navigate to a dedicated dashboard for your host. Click the name of a host within the list of traces, then click “Host dashboard” (as below).
The host dashboard shows us system-level metrics from our application server, which helps us determine if our issue corresponds with any revealing trends. In this example, we’ve navigated to a graph that shows, at around the same time we started receiving errors in the tracing dashboard, a sudden leveling of network traffic.
To gain additional context, we can click on the graph at that point in time, then click “View related logs.” This will take you to the Log Explorer and filter the logs to the time period and host you’ve selected within the graph. In this case, we find a log that sheds light on both the errors within our traces and the loss of network traffic: Rails cannot connect to the database server.
Datadog makes it straightforward to monitor SQL Server’s interactions with the rest of your web application. You can gather logs from a file or network port, and send traces by auto-instrumenting a web framework that SQL Server integrates with. And with easy navigation between metrics, traces, and logs, you can quickly pin down which parts of your infrastructure are causing an issue.
In this post, we’ve shown you how to use Datadog with SQL Server to collect metrics, traces, and logs. With all of this data on the same platform, you can easily switch between views and troubleshoot issues in your SQL Server–based applications.
You can gain even more visibility into SQL Server by configuring the Agent to collect custom metrics. Read the next part of this series to learn three ways to do so.
If you’re already using Datadog, you can follow the steps above to enable the SQL Server integration, as well as APM and log collection, to give you a full view of your system. If you’re new to Datadog, you can get started monitoring SQL Server performance by signing up for a free trial.
此内容由惯性聚合(RSS阅读器)自动聚合整理,仅供阅读参考。 原文来自 — 版权归原作者所有。