


Chef is a platform that automates configuration management for your infrastructure, supporting a continuous delivery workflow. As a configuration management tool, Chef monitors the state of resources across your infrastructure to ensure that each resource is in the desired state with every Chef run. For example, if you try to use Chef to add a user group that already exists on a particular host, Chef will recognize this, and move on without executing a change because the host is already in the desired state.
Chef uses policies to manage workflows and operational requirements. These policies apply the same set of configurations to machines based on their server type (e.g., web or database server) or where they fit in an organization’s development process (e.g., staging or production). In this post, we will show you how to use one of these policy types—Chef roles—to deploy the Datadog Agent and configure specific monitoring integrations, using Prometheus as an example.
Chef operates on three foundational elements: nodes, a workstation, and the Chef server. Nodes are any machines (e.g., Apache web servers) that make up your infrastructure and are managed by Chef. The workstation is simply the machine you use to create configurations for your infrastructure. The server acts as a hub for all your infrastructure’s configurations and communicates between your workstation and each node. The Chef server can run on the workstation or on a separate machine.
In the Chef model, you configure nodes through recipes: Ruby files that contain any element needed to set up a part of your system. A collection of recipes is called a cookbook. Cookbooks are similar to Ansible roles or Puppet modules in that they are packages that accomplish essential tasks such as configuring a web server. You can create a repeatable process for configuring nodes by assigning a role to them. Roles define what nodes should do along with how they should be configured via a run-list of recipes and associated configuration attributes.
Chef enables you to implement infrastructure as code and efficiently manage all of the nodes across your infrastructure. You can take it a step further and implement monitoring as code by using the platform to automatically install and configure the Datadog Agent on the nodes you’re already managing with Chef. And with Datadog’s Chef integration, you get real-time visibility into what is happening with your Chef resources, run-time performance, and execution failures. You can actively monitor the health of your Chef server in conjunction with the systems it’s managing, and be notified of any performance problems or anomalies.
To follow the deployment and configuration steps outlined below, you will need a running Chef server, a workstation with the Chef development kit installed, and a bootstrapped node. If you haven’t installed Chef yet, you can refer to these tutorials to get each piece set up. Note that you will need the name of your bootstrapped node later.
Datadog provides a cookbook that includes a dd-agent recipe for installing the Agent, along with a few other elements to set up common integrations. To install the Datadog cookbook and manage dependencies you can use a Berksfile, much like a Gemfile for Ruby. Navigate to the Chef repository (typically chef-repo) on your workstation, add cookbook 'datadog', '~> 2.15.0' to your Berksfile, then install the cookbook on your workstation with the command:
Every time you create or edit cookbooks, you will need to upload them to the Chef server so it can distribute them to appropriate nodes:
Next, you’ll need to create a role that will run recipes from the Datadog cookbook. Create a new file at /chef-repo/roles/ and name it deploy_dd_agent.rb. (You may have to create the roles directory if it doesn’t already exist.) Include the following in your new file:
name 'deploy_dd_agent'
description 'Role that deploys Datadog components to servers'
default_attributes(
'datadog' => {
'api_key' => '<YOUR_API_KEY>',
'application_key' => '<YOUR_APP_KEY>',
'agent6' => true,
}
)
run_list %w(
recipe[datadog::dd-agent]
)
Note that you need to substitute the API and application keys with keys from your Datadog account. For added security, consider using chef-vault to manage your keys so they will not be stored as cleartext on the Chef server. The role you created includes the Datadog cookbook recipe to install the Agent as part of its run_list and applies the default_attributes as configuration details needed for the Agent to run on the node.
Save the file and execute this command on your workstation:
knife role from file roles/deploy_dd_agent.rb
This uploads the role to the Chef server, but you still need to assign the role to your bootstrapped node. You can do this by updating the node’s run_list with:
knife node run_list add <BOOTSTRAPPED_NODE_NAME> 'role[deploy_dd_agent]'
Using Chef roles makes scaling your systems more efficient, as Chef can easily deploy the same role to multiple nodes within your infrastructure. This saves you from having to manually install the Agent on each node. By default, the Chef client runs every 30 minutes on managed nodes to apply any recent configuration changes. This will pick up the new role and install the Datadog Agent on the node. You can also SSH into the bootstrapped node and run the command manually:
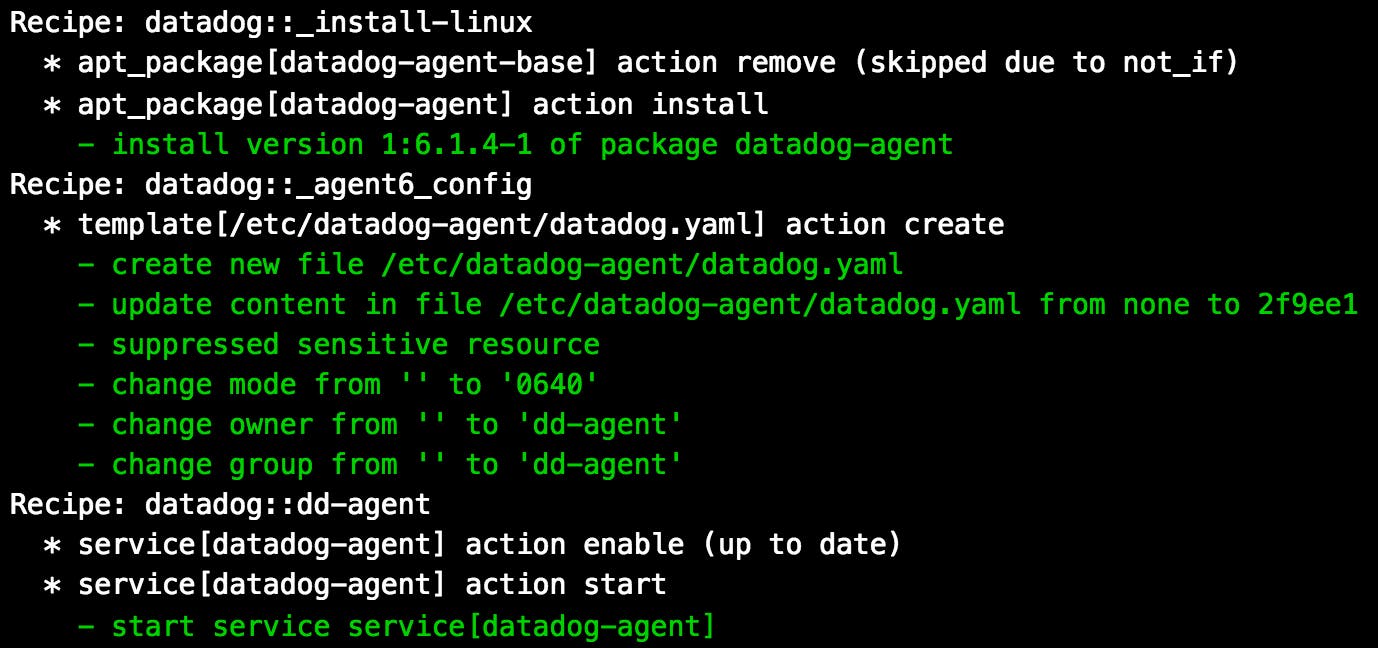
Using Chef to install the Datadog Agent on a node is the first step toward monitoring your infrastructure, as the Agent collects system-level metrics for your nodes by default. But for collecting metrics from a specific integration, you need a recipe and an associated template for your Chef role. The Datadog cookbook already includes recipes and templates for common integrations such as Apache, MySQL, and Docker. You can apply the same method for setting up these integrations as you did with installing the Agent by including their recipes and configuration details in your role’s run-list and attributes. You can also configure Datadog for additional integrations by creating your own recipes and templates, as we’ll demonstrate below.
Datadog supports collecting and monitoring metrics that are formatted for Prometheus, an open source monitoring system. Prometheus uses a text-based exposition format to collect timeseries metric data and is a popular monitoring tool for Kubernetes. If some of your existing applications are configured to emit Prometheus metrics, you can use Chef recipes to automatically configure the Agent to start collecting that data. In the chef-repo/cookbooks/datadog/templates/ folder, create a new file called prometheus.yaml.erb:
instances:
<% @instances.each do |i| -%>
- prometheus_url: <%= i['prometheus_url'] %>
<% if i['namespace'] -%>namespace: <%= i['namespace'] %><% end -%>
<% if i.key?('metrics') -%>
metrics:
<% i['metrics'].each do |m| -%>
- <%= m %>
<% end -%>
<% end -%>
<% end -%>
The template generates the static text required for the Agent’s configuration files based on your role’s attributes. Save the template and create a new prometheus.rb recipe in the chef-repo/cookbooks/datadog/recipes/ folder:
# Cookbook:: datadog
# Recipe:: prometheus
# Integrate Prometheus metrics into Datadog
datadog_monitor 'prometheus' do
instances node['datadog']['prometheus']['instances']
end
This recipe uses the template to create a new prometheus.yaml file in your node’s /etc/datadog-agent/conf.d/ directory. That YAML file provides the Datadog Agent with the configuration details it needs to gather metrics from your Prometheus endpoints. Save the file, and update your role’s default_attributes and run_list to include the Agent’s necessary configurations related to Prometheus:
name 'deploy_dd_agent'
description 'Role that installs and configures the Datadog Agent for Prometheus'
default_attributes(
'datadog' => {
'api_key' => '<YOUR_API_KEY>',
'application_key' => '<YOUR_APP_KEY>',
'agent6' => true,
'prometheus' => {
'instances' => [
{ 'prometheus_url' => 'http://localhost:9090/metrics',
'namespace' => 'web-app',
'metrics' => ['http_requests_*', ‘process_cpu_seconds_total’, ‘go_threads’]
}
]
}
}
)
run_list %w(
recipe[datadog::dd-agent]
recipe[datadog::prometheus]
)
This example specifies three parameters needed to set up Datadog’s Prometheus integration:
a Prometheus URL endpoint where the Datadog Agent can retrieve metrics
a namespace that serves as a prefix for your metrics
a list of metrics to collect
Each Prometheus metric will show as web-app.metric_name in Datadog with this example configuration. For more advanced customization, check out this example configuration file to see a complete list of options available for setting up Datadog’s Prometheus integration. Finally, re-upload both the role and cookbook to the Chef server from your workstation so your node can pick up the latest additions:
knife role from file roles/deploy_dd_agent.rb
berks upload
SSH back into your bootstrapped node and execute the chef-client command again. You should see both the dd-agent and prometheus recipes run. The latter recipe creates a new YAML configuration file and automatically restarts the Agent so it can begin collecting your custom Prometheus metrics and forwarding them to Datadog.
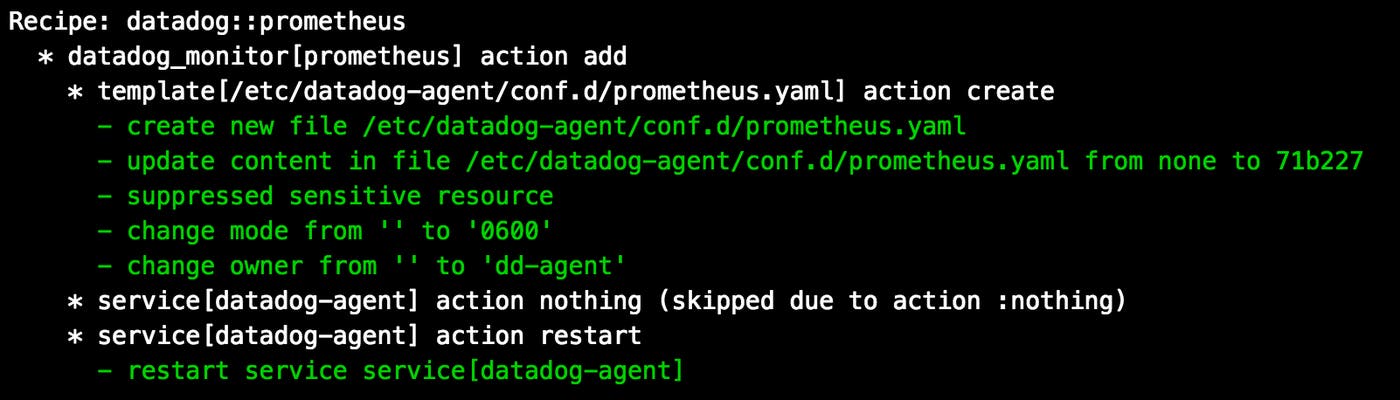
Now that the Agent is installed and configured on the new node, you can begin monitoring your Prometheus metrics with Datadog dashboards and alerts, as well as all the detailed, system-level metrics from the node itself. And, of course, you can continually add new recipes and configurations to your Datadog role to ensure that your monitoring automatically covers all the components in your infrastructure.
For more comprehensive monitoring, the Datadog cookbook includes a dd-handler recipe that installs a Chef Report Handler. The handler reports metrics from Chef runs to Datadog’s event stream and includes information about failed executions and run-time performance for the Chef server. This gives you a high-level view into how Chef is performing each time it runs on a managed node.
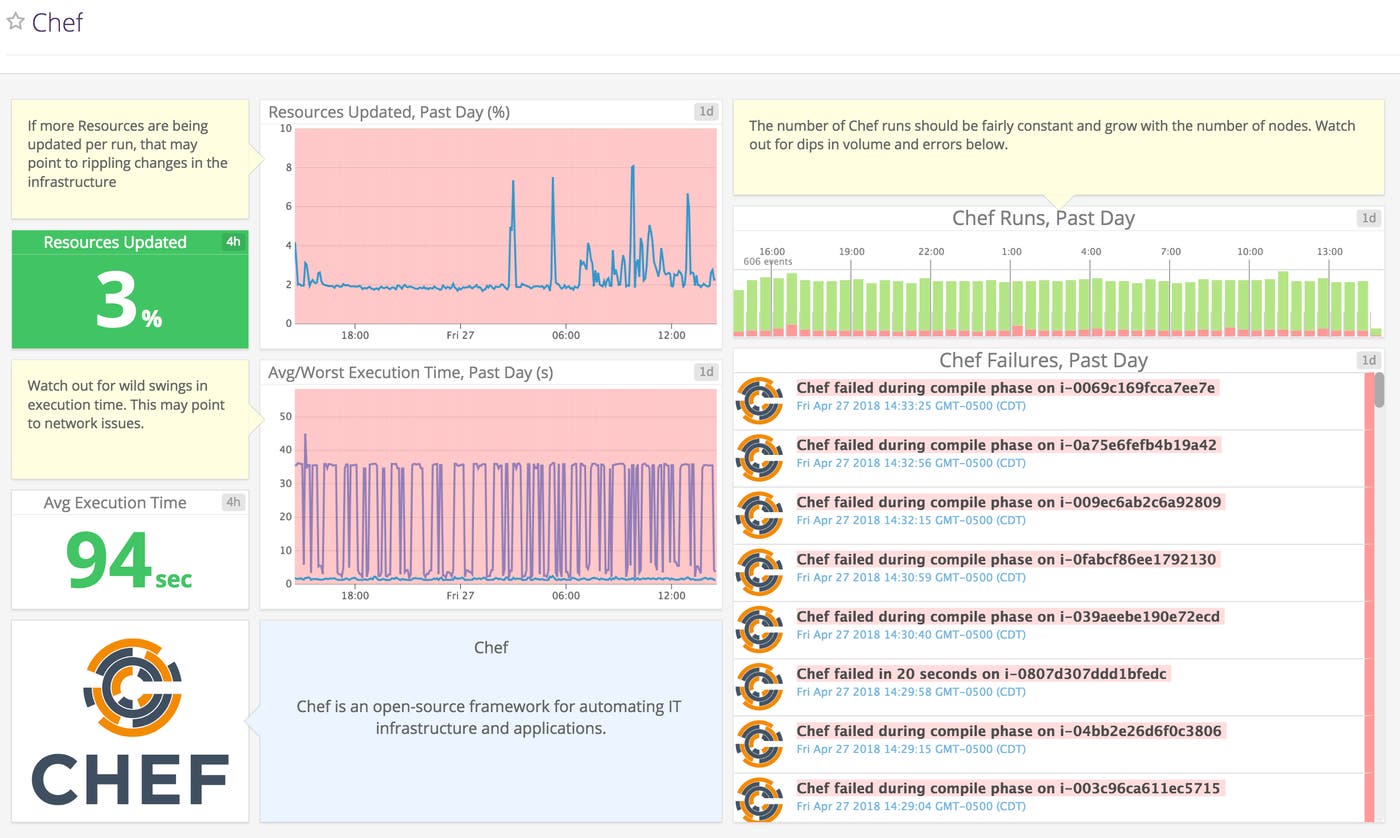
With Datadog and Chef, you have a repeatable process for managing and monitoring your infrastructure. You can configure Chef to automatically install the Agent and set up integrations for services across your environment, so you never have infrastructure blind spots or gaps in coverage. Datadog provides a collection of recipes for popular integrations to help you get started, and makes it easy to create additional configurations to automatically monitor any of the other 1,000+ integrations that Datadog offers.
If you haven’t already, sign up for a free trial and start monitoring the servers in your infrastructure with Datadog and Chef today.
此内容由惯性聚合(RSS阅读器)自动聚合整理,仅供阅读参考。 原文来自 — 版权归原作者所有。