




In this series, we’ve explored Karpenter’s architecture, the key metrics that reflect its health and performance, and the vendor-agnostic tools for collecting and analyzing its telemetry data. In this final post, we’ll show you how Datadog helps you monitor and alert on Karpenter alongside your Kubernetes cluster and the infrastructure that runs it. We’ll also look at how Datadog Cloud Cost Management (CCM) helps you correlate Karpenter’s scaling activity with cloud spend so you can actively optimize your costs.
We’ll show you how to:
Enable the Karpenter integration
Visualize and alert on your Karpenter metrics
Track cost efficiency with Cloud Cost Management
Datadog’s Karpenter integration runs as a check in the Datadog Agent and scrapes Karpenter’s Prometheus endpoint to collect metrics. In Kubernetes, the easiest way to configure the check is to use Autodiscovery, which reads integration configuration from Karpenter’s controller pods via annotations and automatically applies it so the Agent knows where to find Karpenter’s /metrics endpoint.
The openmetrics_endpoint parameter defines the location of Karpenter’s /metrics endpoint. By default, Karpenter uses port 8080, but this could be different depending on how you’ve installed Karpenter and whether you’ve set its METRICS_PORT environment variable. See Part 2 of this series for more information on how to determine your configured port, then set the openmetrics_endpoint value in your Karpenter controller’s annotation accordingly.
You can use the %%host%% template variable to enable the Agent to automatically target the controller pod’s IP address. This allows you to avoid maintaining static configuration files and automatically keeps the integration’s configuration current as pods churn.
To ensure the Datadog Agent can scrape Karpenter’s metrics without manual pod-level modifications, you can provide the check configuration directly to the Agent. Depending on your deployment method, add the following configuration to your Datadog Operator manifest (under spec.override.nodeAgent.extraConfd) or your Helm values (under datadog.confd). This approach uses Autodiscovery to identify the Karpenter controller and apply the check dynamically.
# karpenter.yaml configuration for the Datadog Agent
ad_identifiers:
- karpenter
init_config: {}
instances:
- openmetrics_endpoint: "http://%%host%%:8080/metrics"
Next, validate that the integration is configured properly. Run the agent status command from the Agent pod that’s running on the same node as the Karpenter controller’s leader pod:
kubectl exec -it <datadog-agent-pod-name> agent status
Confirm that karpenter appears in the Checks section of the output. If it does, the Agent is successfully collecting Karpenter telemetry data. You can then open Datadog and start viewing your Karpenter metrics.
You can also send Karpenter logs to Datadog for storage, exploration, and analysis. To enable log collection, add the following annotation:
metadata:
annotations:
ad.datadoghq.com/controller.logs: |
[
{
"source": "karpenter",
"service": "karpenter",
"tags":["team:platform"]
}
]
The Agent will then collect logs from the Karpenter controller container and apply the specified tags. The service tag is a key piece of unified service tagging, which helps you correlate metrics and logs throughout your environment. The team tag can help you clarify ownership, improve collaboration, and accelerate troubleshooting.
Once the Datadog Agent is collecting Karpenter telemetry data, you can graph Karpenter metrics over time, filter by tags to isolate the performance of individual clusters or NodePools, and create monitors to alert on issues such as slow scaling or upstream problems with your cloud provider.
Karpenter emits NodeClaim life cycle metrics that help you see whether it’s creating the capacity your workloads need. You can graph karpenter.nodeclaims_created to see the rate at which Karpenter is creating NodeClaims. Other NodeClaim life cycle metrics give you visibility into Karpenter’s provisioning progress—for example to spot nodes that have been created but not yet registered or initialized.
You can add context to these metrics by correlating them with Kubernetes scheduling pressure and activity. Datadog enables you to track Kubernetes FailedScheduling events, which indicate workloads that don’t have a node to run on and are Karpenter’s cue to add capacity. When Karpenter is behaving as expected, these events are followed by NodeClaim activity and then successful pod scheduling as capacity becomes available.
You should alert on NodeClaim activity to proactively detect issues in the provisioning process. For example, you can create an anomaly detection monitor to alert if the difference between NodeClaims created and NodeClaims registered—when capacity is actually added to the cluster—is unusually high.
When Karpenter is slow to react, the cause often shows up in controller reconciliation latency. Datadog enables you to visualize Karpenter’s p95 or p99 reconciliation times so you can spot emerging latency. Sustained increases can indicate overly complex constraints, API throttling, or control plane issues that force Karpenter to retry or re-evaluate more often than expected.
You should also alert on reconciliation latency, since it can directly affect the performance of the applications in your cluster. To avoid noisy alerts, create a monitor that triggers when reconciliation time stays above a threshold for a sustained period rather than alerting on every short spike.
When scaling slows down, the bottleneck is often not Karpenter’s scheduling simulations, but rather cloud provider API latency, throttling, or capacity limits. Graph karpenter_cloudprovider_duration_seconds to see whether Karpenter’s cloud API calls are taking longer than usual. Then graph karpenter_cloudprovider_errors_total to confirm whether the slowdown coincides with more failed requests (for example, throttling or capacity-related errors).
If you run Spot instances (or rely on interruption or termination signals), you want visibility into both the volume of interruptions and how quickly Karpenter responds. Once you’ve configured interruption handling, you can track the karpenter.interruption.received_messages.count metric and visualize the volume of interruption notices across your clusters. By correlating this with karpenter.nodeclaims_terminated, you can check that Karpenter is proactive in draining nodes before they are reclaimed by the cloud provider, preventing sudden capacity gaps.
Monitoring Karpenter metrics gives you a clear picture of when and how it scales your cluster. To help you understand the cost effects of this scaling activity, Datadog Cloud Cost Management (CCM) gives you visibility into the details of your cloud spend, in the same platform where you’re monitoring Karpenter and the rest of your environment. CCM helps you track and manage Kubernetes costs so you can see how Karpenter’s consolidation and Spot usage affect spend over time.
Karpenter can reduce cost in two main ways: consolidation (moving workloads onto fewer, better-utilized nodes) and Spot usage (preferring Spot instances when your NodePool allows it). CCM doesn’t attribute savings to a single Karpenter consolidation event, because it bases your cost visibility on aggregated and delayed cost data from your cloud provider. Once CCM is ingesting your cloud cost data, you can observe the effect of Karpenter over days or weeks.
To bridge the gap between autoscaling and actual spend, CCM provides granular container cost allocation that attributes expenses directly to your namespaces, pods, and custom labels. This visibility allows you to pinpoint high-cost workloads, track how infrastructure changes drive your cloud spend over time, and identify optimization opportunities. CCM’s GPU allocation capability clarifies which of your workloads are contributing to high GPU costs. And by using the Cloud Cost Explorer to group by tags, you can manage cross-zone networking cost by co-locating chatty workloads.
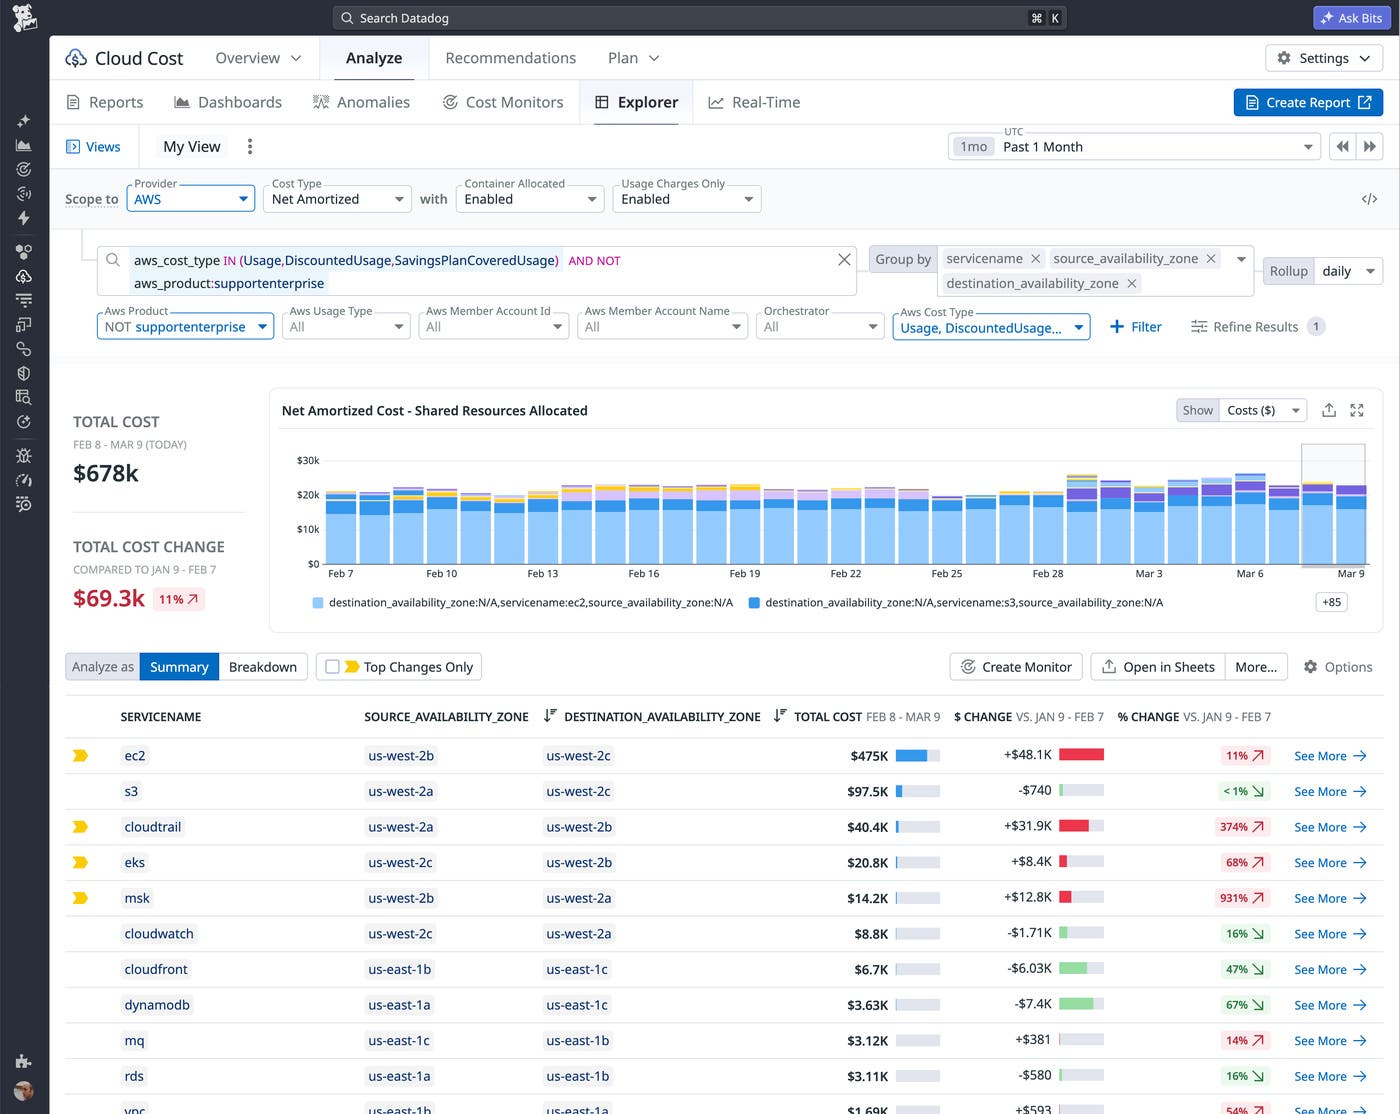
Karpenter’s consolidation behavior is a key to its ability to help you manage costs. CCM gives you visibility into idle or underutilized resources, which can help you see the cost of capacity that Karpenter hasn’t yet consolidated or that could be right-sized. Once you spot these optimization opportunities, you can investigate the causes of underutilization, such as malformed or disabled consolidation configurations, or quotas that prevent Karpenter from optimizing.
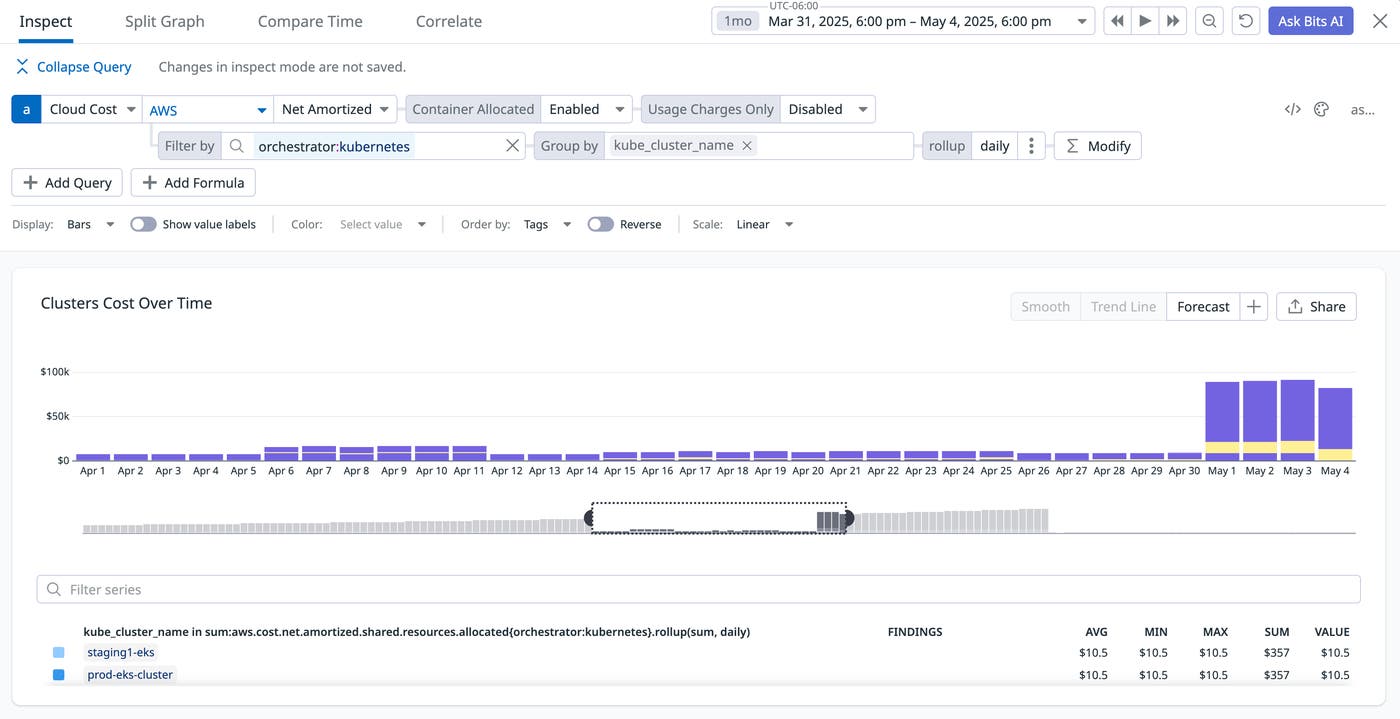
The following screenshot shows a spike in Kubernetes cluster costs. When a platform team sees this on a dashboard, they might investigate by reviewing their Karpenter configuration. Disabled consolidation or a disruption budget set to zero might explain the cause. After resolving the configuration issue, the team can rely on CCM to confirm that costs drop to their expected levels as Karpenter consolidates nodes again.
Use Cloud Cost Monitors to get notified when spend crosses a threshold or deviates from an expected pattern. For example, you can set a threshold or anomaly monitor on daily or weekly Kubernetes spend so that if a Karpenter misconfiguration (such as accidentally disabling consolidation) causes a sudden spike, your team is alerted. You can also use Notebooks to document cost postmortems and share with stakeholders how changes in Karpenter configuration or NodePools affected spend.
In this post, we’ve shown you how to enable the Karpenter integration in Datadog, visualize and alert on NodeClaim life cycles, and use Cloud Cost Management to correlate Karpenter’s behavior with your spend.
By unifying these signals, you move beyond simple autoscaling to automated efficiency. You can now ensure that every node Karpenter provisions is not only necessary for application performance but also optimized for cost, giving your platform team the data needed to prove the ROI of your cloud-native infrastructure.
See the Karpenter documentation for more information. To get started using Datadog to monitor Karpenter, see the Karpenter integration documentation.
If you’re new to Datadog, sign up for a 14-day free trial.
此内容由惯性聚合(RSS阅读器)自动聚合整理,仅供阅读参考。 原文来自 — 版权归原作者所有。