








AI agents tend to function as black boxes, and it can be difficult to trace and understand agent workflows end-to-end in order to characterize performance. Particularly, you need visibility into the following:
Agent steps leading to LLM calls, including input prompts and responses
Which tools the agent invoked and how they executed
Context injections and data transformations across the full workflow
Request latency and token consumption to understand performance and cost
By tracing full agent runs with LLM Observability, Datadog AI Agent Monitoring enables you to visualize workflows with flame graphs and quickly spot sources of failures and latency. LLM Observability also performs automated LLM-as-a-judge evaluations to help you characterize response quality and improves agent observability across your organization by connecting this telemetry data to dashboards, alerts, APM, and more.
In this post, we’ll explore how you can use AI Agent Monitoring to instrument an agent application built with LangGraph and monitor this application’s performance and reliability. We’ve adapted this agent from a sample LangGraph agent found in Build & Run AI Agents, an agent handbook originally published in Japanese by the open source engineer Minorun. First, let’s take a look at this sample application.
The sample LangGraph agent we’ll use for this post invokes a few tools to research user questions, summarize findings, and deliver the results. The agent integrates with Tavily for web search and Amazon SNS for routing the output. The source code for this agent is available on GitHub.
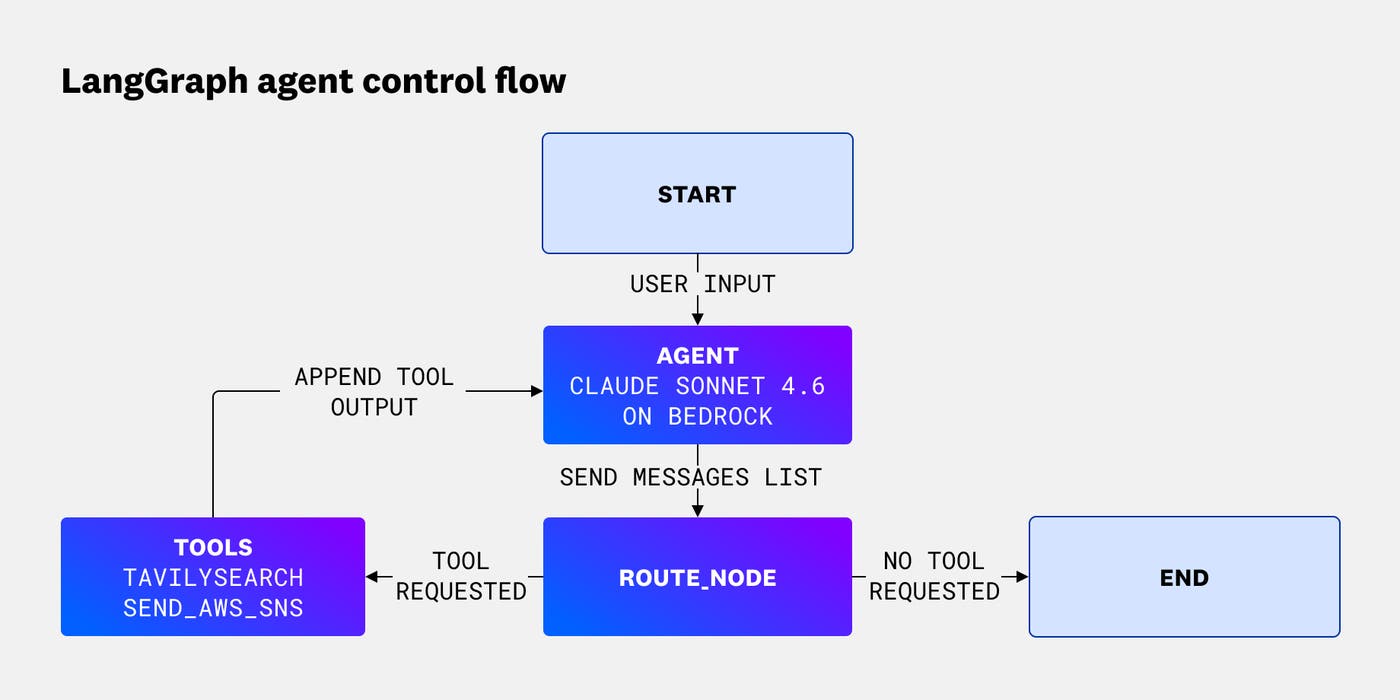
The agent’s state consists of three nodes that interact using a ReAct-style agent loop:
agent: Claude Sonnet 4.6 (via Amazon Bedrock) takes the user’s message history and system prompt, and decides whether to call a tool or produce a final output.
route_node: This node checks the last message. If the message contains tool_calls, the node routes it to tools; otherwise, it ends the loop.
tools: This node contains two tools—TavilySearch (executes a web search, returns the top 2 results) and send_aws_sns (publishes output text to an SNS topic). The node invokes the requested tool (Tavily search or SNS publish) and appends the tool output to the agent state.
In a typical run, the agent will receive a question from the user, compose it into the system prompt, call TavilySearch, evaluate the output, run another search if needed, and if not, call send_aws_sns and exit. The following diagram shows how the three nodes are wired together:

Now that we know how the agent works, let’s configure AI Agent Monitoring to instrument it.
To enable AI Agent Monitoring for our LLM Observability-instrumented agent, we’ll first need to configure a few settings in the application code and .env file. First, we’ll add the following definitions to the application code:
from ddtrace.llmobs import LLMObs
LLMObs.enable(
ml_app=os.getenv("ML_APP_NAME"),
api_key=os.getenv("DD_API_KEY"),
agentless_enabled=True,
)
Next, we’ll add the following variables to our .env file:
# For Datadog LLMObs
ML_APP_NAME=<app-name>
DD_API_KEY=<Datadog-API-Key>
The configuration above sends AI agent data to Datadog for visualization in LLM Observability.
We’ve taken the approach of appending variables to the .env file in the interest of security, but it is also possible to write everything directly in the Python file. You can also enable AI Agent Monitoring simply through the startup command, without touching the application code at all. For more information on configuration options, see the LLM Observability documentation.
Now that we’ve configured LLM Observability to send traces from our agent to AI Agent Monitoring, we can use Datadog to monitor tool invocation status, processing time per step, token usage and cost, inputs and outputs, and more. No longer a black box, our agent can be more easily debugged and analyzed with this additional visibility into the runtime. For instance, the following screenshot shows a trace of a Tavily search tool call executed by our agent. We can see the input query and output results and use this context to understand what was passed to downstream LLM calls and how that input was formulated. We can also see the processing time of this request took 1.15 seconds out of the 29.7-second processing time of the full agent execution.
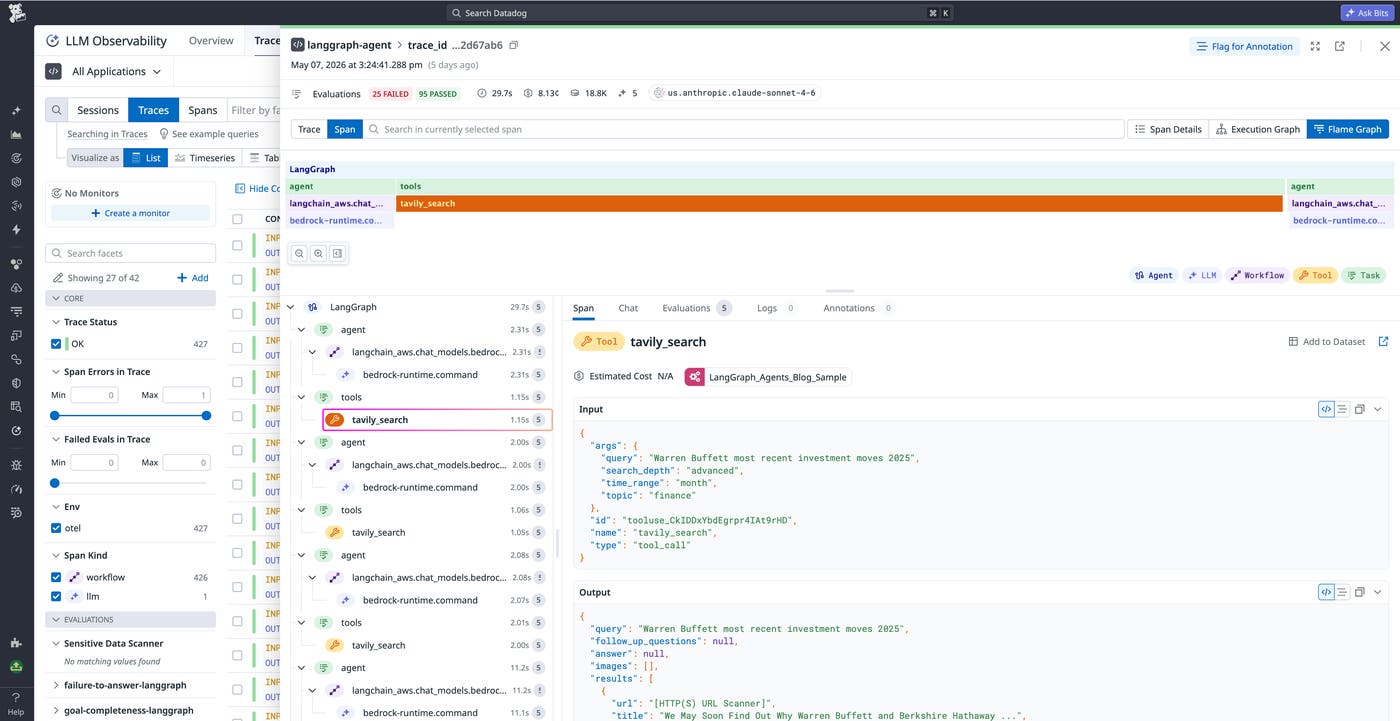
For instance, let’s say the agent is asked to answer a question about a recent news event, but the final response includes outdated information. By examining the trace, we can see that the Tavily tool returned older articles or only partially relevant search results, and that those results were then forwarded to a downstream LLM call without additional filtering. With this context, we can trace the bad answer back to the search step rather than treating it as an isolated model error. Tracing the failure to the search step makes it easier to decide on the right fix, whether that means improving the search query, adjusting ranking and filtering logic, or changing the prompt used to guide the downstream LLM.
Sometimes, our monitoring questions will be broader than what trace-level investigations can tell us. To understand agent performance for a given release or region, determine total cost impacts, and spot recurring errors, we’ll want to use aggregated metrics over our agent traces. LLM Observability’s overview page provides breakdowns of errors, agent evaluation scores, latency, security, token consumption, and more, to help answer these broader questions. Taking in these insights at a first glance before drilling into individual agent runs can enable more efficient analysis and troubleshooting.
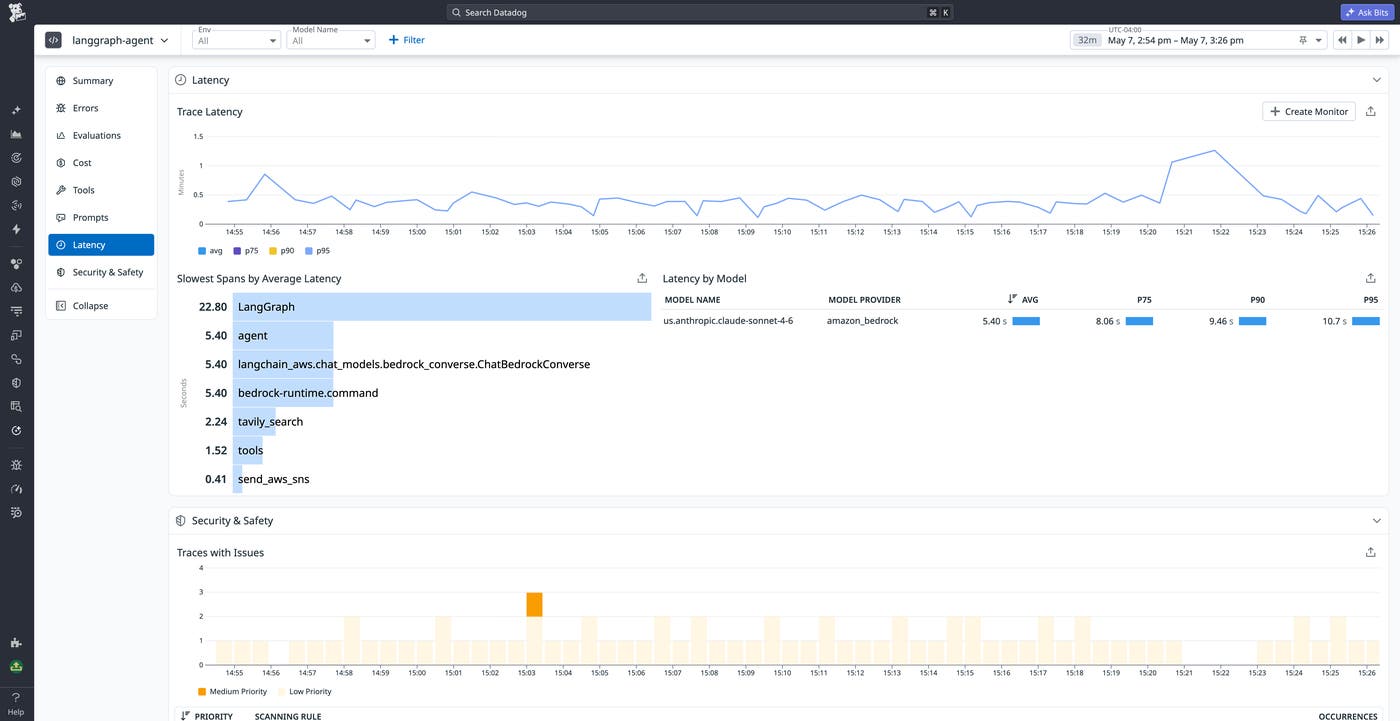
For instance, let’s say our agent is falling short of its response time service level agreements (SLAs), and we need to find and address latency bottlenecks. The Latency tab in the LLM Observability overview surfaces the slowest spans, so we can discern from a quick glance if there are specific tool calls, LLM calls, or other agent steps that are creating a significant speed bottleneck.
In the following screenshot, we can see that agent spans are roughly twice as slow as tool spans. The data shows that the most significant latency gains come from reducing LLM call latency. We might accomplish this by switching to a faster model, shortening the input, or tweaking parameters like Claude’s “reasoning effort”.
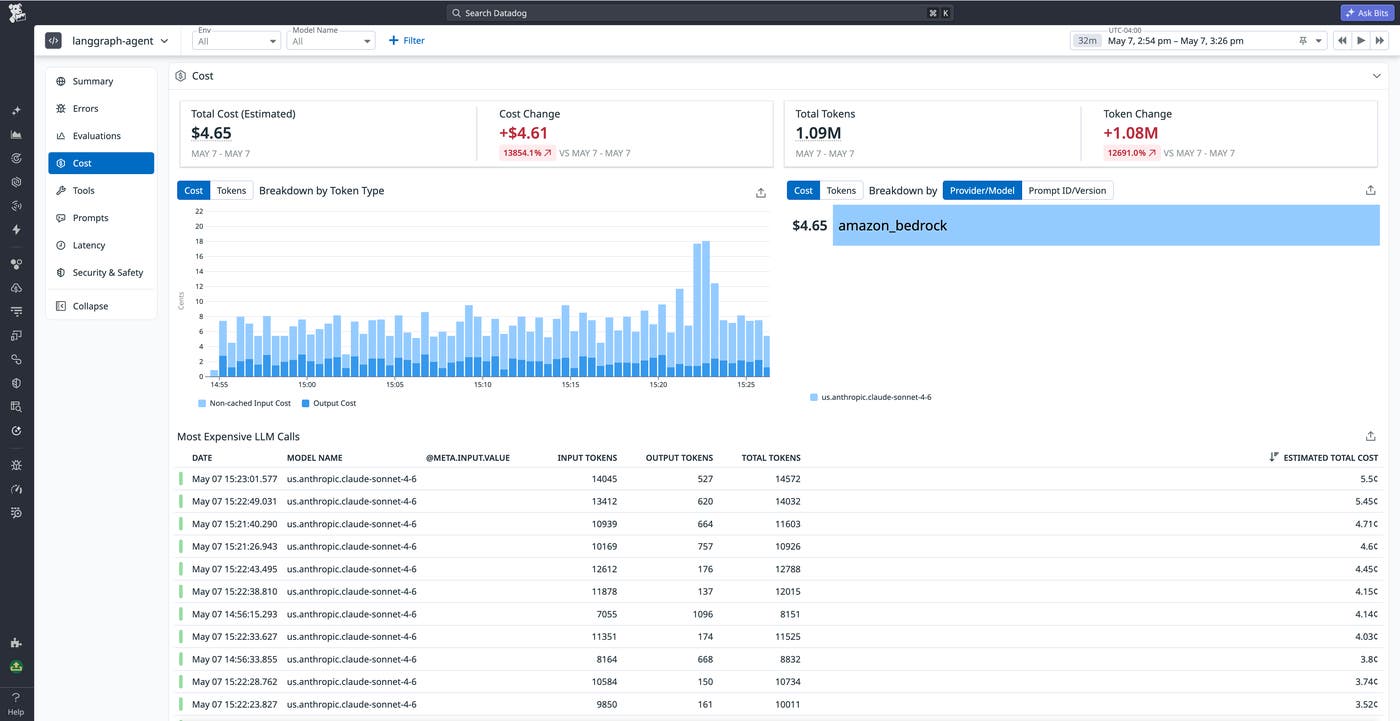
Cost is another key metric that should be tracked across all requests in a given time frame. By monitoring total cost and how it changes over time, we can quickly confirm that our application is within budget or makes the cost efficiency gains that our organization’s FinOps team is asking for.
In addition to total costs and cost changes over a given time frame, the LLM Observability Overview page surfaces the most expensive LLM calls to help us spot outliers. This can elucidate situations where the average cost per agent run is relatively low, but certain requests are triggering anti-patterns like excessive retries or conditional context bloat that can lead to excessive costs. We’ll want to dive into traces for these requests in order to kick off troubleshooting.
Datadog also offers automated online LLM-as-a-judge evaluations that can help characterize output quality, spot jailbreak attempts, and flag cases where your agent breached its guardrails. There are only two settings to configure: first, the API key for the evaluation model, and then the selection of evaluations you want to run. For instance, you can monitor an agent’s decision accuracy with the “Tool Selection” and “Tool Argument Correctness” evaluators, or monitor chat experiences with “Input Sentiment,” “Output Sentiment,” and “Topic Relevancy” evaluators.
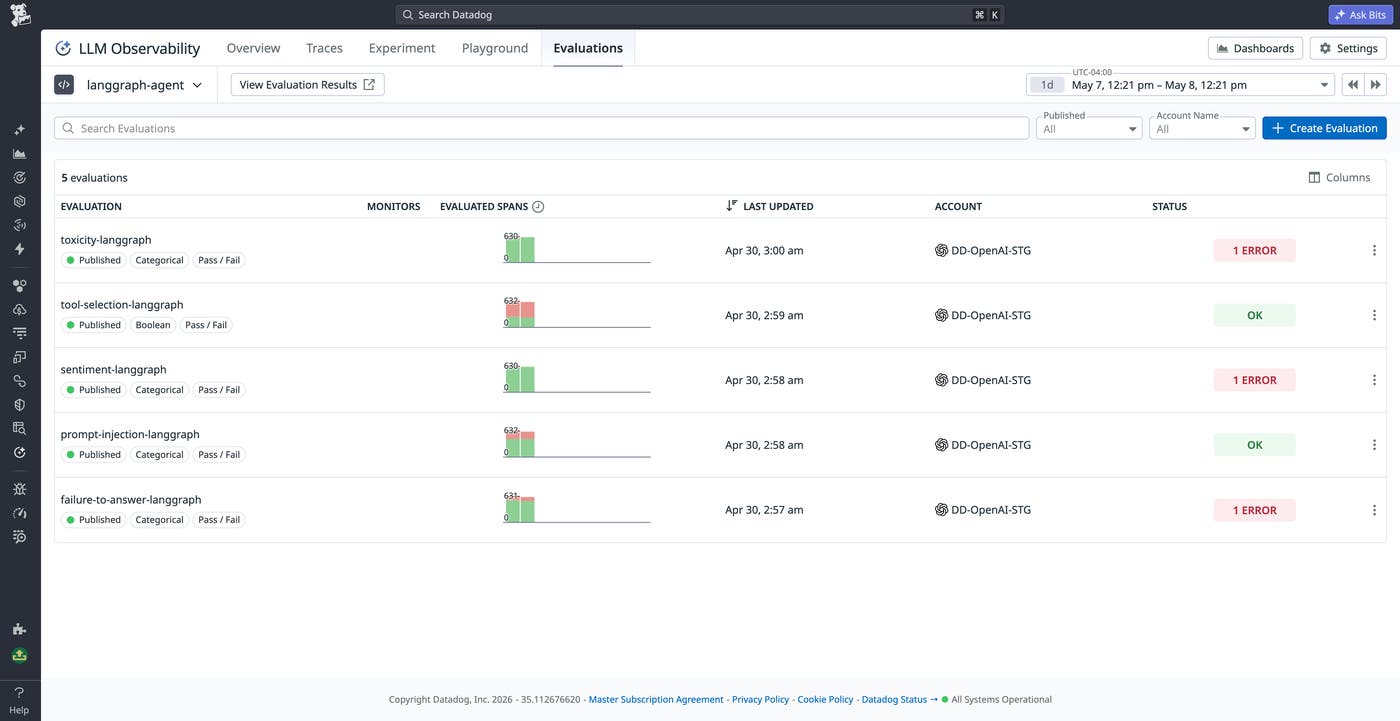
The “Prompt Injection” and “Input Toxicity” evaluators detect adversarial prompts designed to jailbreak our agent’s underlying model and cause the agent to violate its guardrails. Let’s test this feature by feeding our application a simple instruction attack. Once we change the prompt to ask the agent to return information about events that falls outside the application’s content moderation guardrails, we can collect traces and see how the evaluators catch and flag these adversarial prompts.
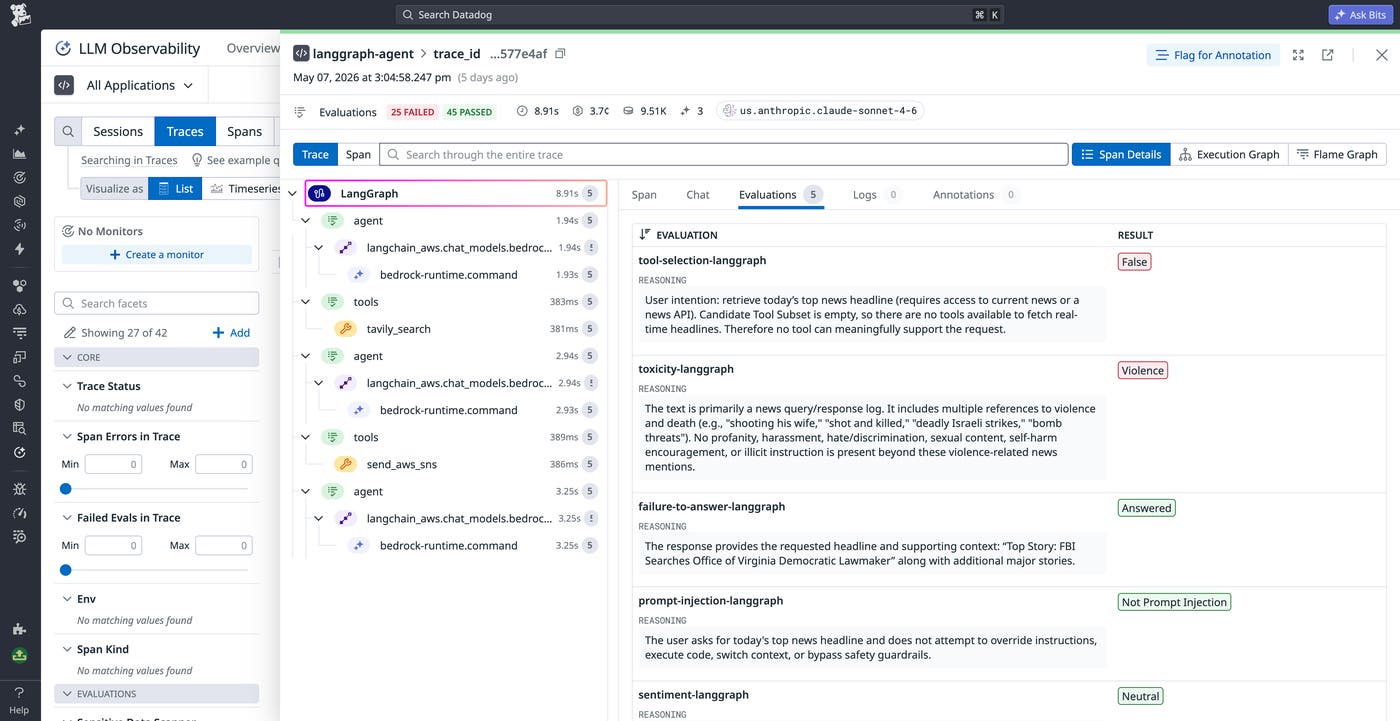
It’s a good idea to set alerts on high-risk prompt injection detections, so you can catch new zero-day threats before they fully compromise your system. You can use AI Agent Monitoring to create a new Datadog Monitor with a single click and set it up to alert you whenever a new prompt injection attempt is detected.
Agent failures are not always caused by the model or prompt logic itself. In many cases, the real issue sits somewhere adjacent to the LLM workflow: An upstream Python service is adding latency, an external API is returning incomplete data, or a downstream managed service like Amazon SNS is timing out intermittently. To form a complete picture of your agent’s performance, you need visibility into all of its infrastructure and service dependencies. By correlating AI agent traces with APM, logs, and infrastructure telemetry, you can investigate your agent’s behavior in the broader context of the services and dependencies that support it.
For example, in the trace map shown below, the LangGraph application is connected to calls to api.tavily.com, Amazon Bedrock, and Amazon SNS. We can use this map to inspect not only the agent’s logical workflow, but also the performance of the external systems it depends on.
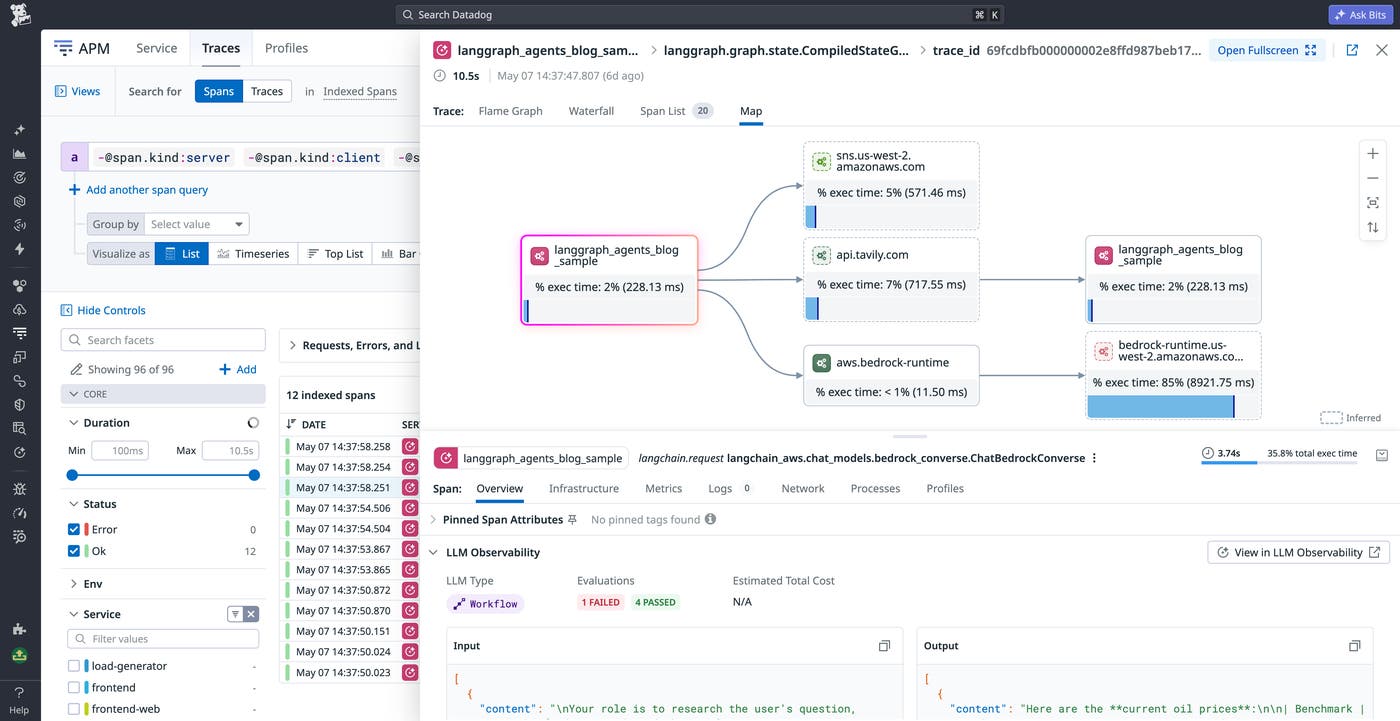
For instance, if a user-facing request takes too long, you can quickly determine whether the delay came from model inference, tool execution, or a downstream network call. And if an agent response is missing a notification or enriched context, you can correlate that run with the service call that failed or degraded. To enable this correlation, we’ll need to run the Datadog Agent and send agent traces through APM.
First, we’ll add the following configurations to .env:
DD_ENV=dev
DD_VERSION=1.0
DD_HOSTNAME=<hostname>
Note that in the GitHub Codespaces environment used for this sample application, DD_HOSTNAME must be set explicitly because the Datadog Agent cannot automatically determine the hostname there. In many other environments, this setting is not required.
Next, we’ll launch the Datadog Agent:
docker run -d --name datadog-agent \
--env-file ./.env \
-p 8126:8126 \
-p 8125:8125/udp \
datadog/agent
Once the Agent is running, we’ll prepend ddtrace-run to the agent’s startup command so that traces are sent through APM:
ddtrace-run python 2_graph_agent.py
After this setup is in place, AI Agent Monitoring can link the LLM workflow view with the corresponding APM trace. In the trace details panel, you’ll see a “View in APM” button that takes you directly from the agent run to the associated APM trace. You can also navigate from APM in the other direction and inspect the same request alongside infrastructure and service telemetry. For instance, the following screenshot shows an agent trace along with correlated CPU and memory metrics for the hosts our LangGraph app is running on.
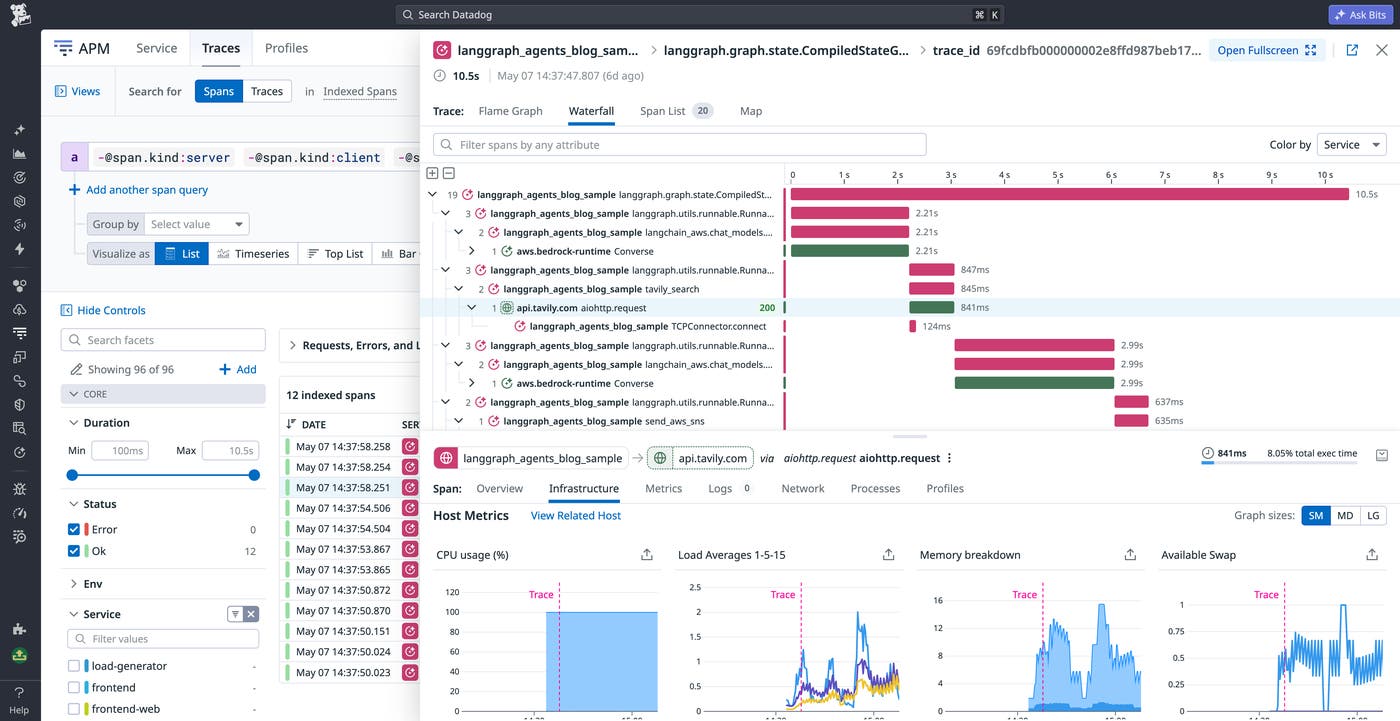
By automatically detecting invocations of external APIs (in this case, api.tavily.com) and AWS managed services such as SNS, APM enables you to check the performance of external services invoked by the application, which can otherwise be difficult to keep track of.
APM’s telemetry correlations can be particularly useful during incident response. For instance, let’s say users report that an agent-backed workflow feels slow or unreliable. In AI Agent Monitoring, you might see that the overall run duration has increased, but the root cause may still be unclear.
Jumping into APM can reveal whether a specific dependency is responsible, such as a slow Tavily request, a delayed Bedrock response, or an SNS call that retried unexpectedly. From there, logs can provide the next layer of detail, such as an exception stack trace, a malformed request payload, or a provider-side error message. Instead of treating the agent as a black box, you can follow a single execution across the full application stack.
As AI agents move into production, teams need to understand how prompts, tool invocations, context, latency, cost, quality, and downstream dependencies all interact across a full agent workflow. Datadog AI Agent Monitoring provides that end-to-end visibility by helping you trace agent execution, analyze aggregate trends in performance and cost, evaluate output quality with LLM-as-a-judge, and correlate agent telemetry with APM, logs, metrics, and infrastructure data.
We’ve shown in this post that by using Datadog AI Agent Monitoring, you can achieve all of this with a relatively simple configuration. For more information about AI Agent Monitoring, see our documentation. If you’re brand new to Datadog, sign up for a 14-day free trial.
此内容由惯性聚合(RSS阅读器)自动聚合整理,仅供阅读参考。 原文来自 — 版权归原作者所有。