


Jean-Mathieu Saponaro
This post is part 1 of a 3-part series on monitoring Amazon ELB. Part 2 explains how to collect its metrics, and Part 3 shows you how Datadog can help you monitor ELB.
Note: The metrics referenced in this article pertain to classic ELB load balancers. We will cover Application Load Balancer metrics in a future article.
Elastic Load Balancing (ELB) is an AWS service used to dispatch incoming web traffic from your applications across your Amazon EC2 backend instances, which may be in different availability zones.
ELB is widely used by web and mobile applications to help ensure a smooth user experience and provide increased fault tolerance, handling traffic peaks and failed EC2 instances without interruption.
ELB continuously checks for unhealthy EC2 instances. If any are detected, ELB immediately reroutes their traffic until they recover. If an entire availability zone goes offline, Elastic Load Balancing can even route traffic to instances in other availability zones. With Auto Scaling, AWS can ensure your infrastructure includes the right number of EC2 hosts to support your changing application load patterns.
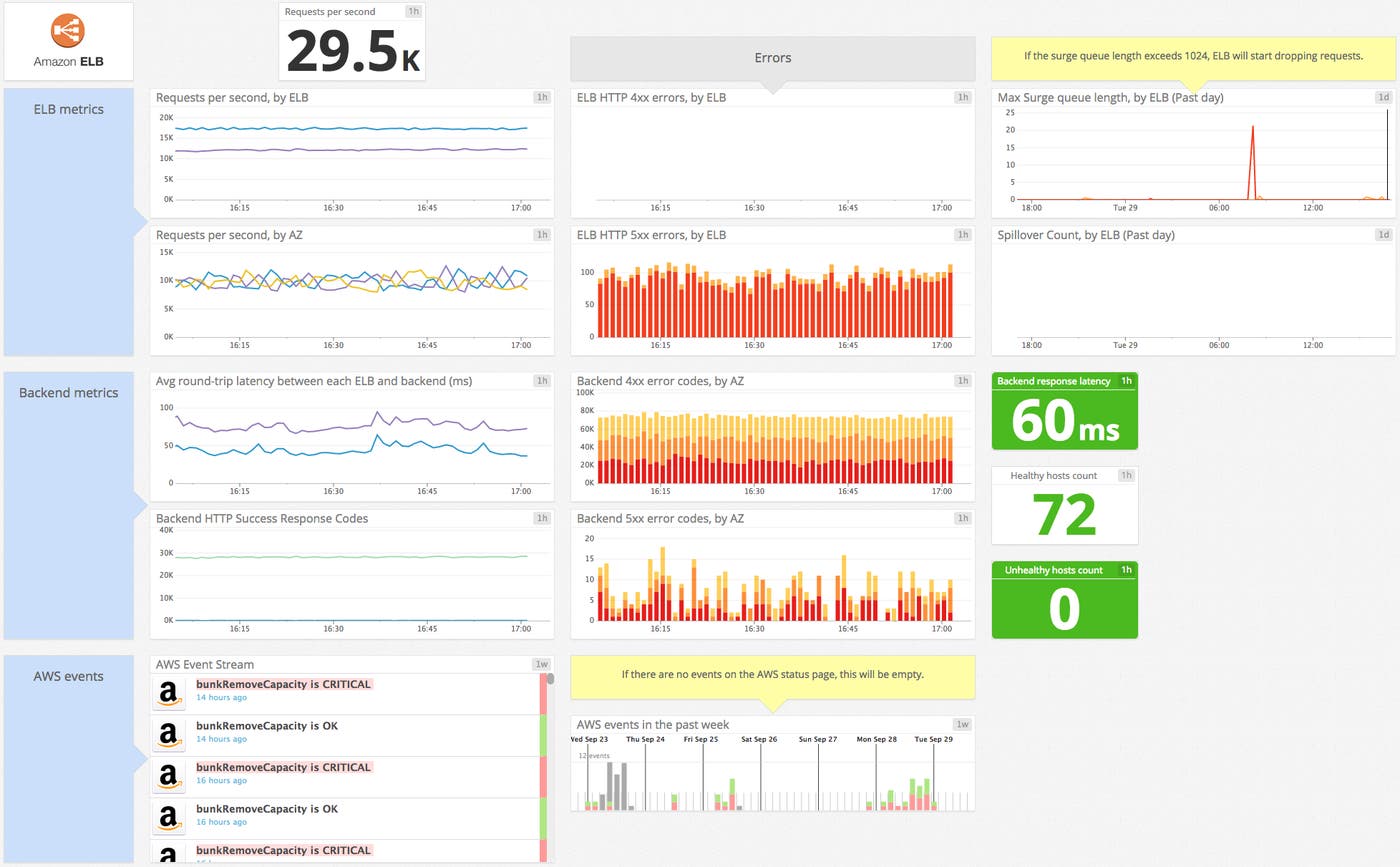
As the first gateway between your users and your application, load balancers are a critical piece of any scalable infrastructure. If it is not working properly, your users can experience much slower application response times or even outright errors, which can lead to lost transactions for example. That’s why ELB needs to be continuously monitored and its key metrics well understood to ensure that the load balancer itself and the EC2 instances behind it remain healthy. There are two broad categories of ELB metrics to monitor:
Load balancer metrics
Backend-related metrics
This article references metric terminology introduced in our Monitoring 101 series, which provides a framework for metric collection and alerting.

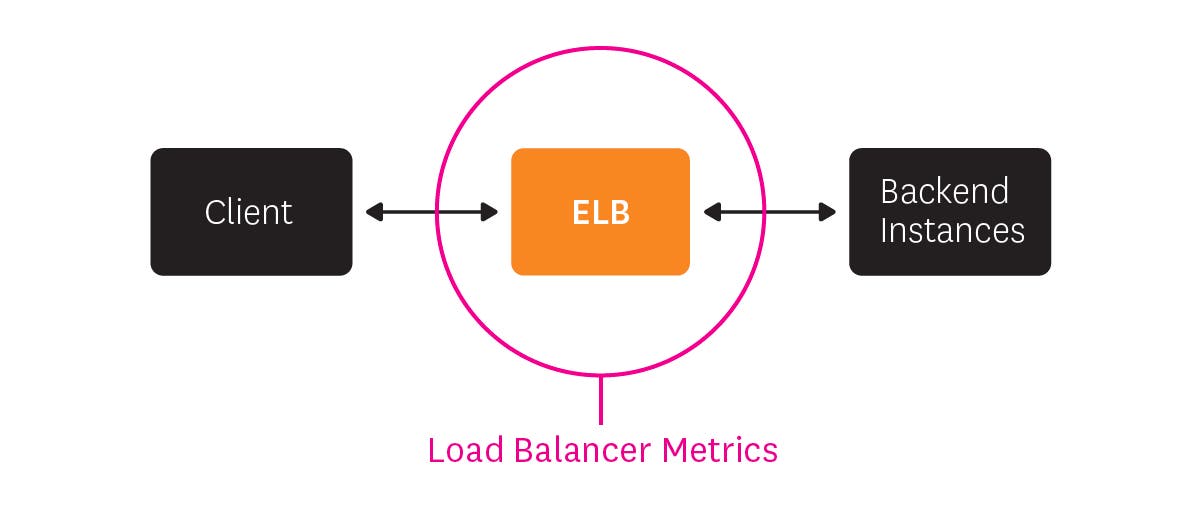
The first category of metrics to consider comes from the load balancer itself, as opposed to the backend instances registered with the load balancer. For each metric we noted the most relevant and useful statistic to monitor (sum, avg, min, or max) since they are usually all available.
| Name | Description | Metric Type |
|---|---|---|
| RequestCount | Number of requests ELB received and sent to the registered EC2 instances during the selected time period (sum). | Work: Throughput |
| SurgeQueueLength | Number of inbound requests currently queued by the load balancer waiting to be accepted and processed by a backend instance (max). | Resource: Saturation |
| SpilloverCount | Number of requests that have been rejected due to a full surge queue during the selected time period (sum). | Work: Error (due to resource saturation) |
| HTTPCodeELB4XX* | Number of HTTP 4xx errors (client error) returned by the load balancer during the selected time period (sum). | Work: Error |
| HTTPCodeELB5XX* | Number of HTTP 5xx errors (server error) returned by the load balancer during the selected time period (sum). | Work: Error |
Elastic Load Balancing configuration requires one or more listeners, which are ELB processes that check for connection requests. The HTTPCode_ELB metrics named above will be available only if the listener is configured with HTTP or HTTPS protocol for both front- and back-end connections.
RequestCount: This metric measures the amount of traffic your load balancer is handling. Keeping an eye on peaks and drops allows you to alert on drastic changes which might indicate a problem with AWS or upstream issues like DNS. If you are not using Auto Scaling, then knowing when your request count changes significantly can also help you know when to adjust the number of instances backing your load balancer.
SurgeQueueLength: When your backend instances are fully loaded and can’t process any more requests, incoming requests are queued, which can increase latency (see below) leading to slow user navigation or timeout errors. That’s why this metric should remain as low as possible, ideally at zero. Backend instances may refuse new requests for many reasons, but it’s often due to too many open connections. In that case you should consider tuning your backend or adding more backend capacity. The “max” statistic is the most relevant view of this metric so that peaks of queued requests are visible. Crucially, make sure the queue length always remains substantially smaller than the maximum queue capacity, currently capped to 1,024 requests, so you can avoid dropped requests.
SpilloverCount: When the SurgeQueueLength reaches the maximum of 1,024 queued requests, new requests are dropped, the user receives a 503 error, and the spillover count metric is incremented. In a healthy system, this metric is always equal to zero.
HTTPCode_ELB_5XX: This metric counts the number of requests that could not be properly handled. It can have different root causes:
If the error code is 502 (Bad Gateway), the backend instance returned a response, but the load balancer couldn’t parse it because the load balancer was not working properly or the response was malformed.
If it’s 503 (Service Unavailable), the error comes from your backend instances or the load balancer, which may not have had enough capacity to handle the request. Make sure your instances are healthy and registered with your load balancer.
If a 504 error (Gateway Timeout) is returned, the response time exceeded ELB’s idle timeout. You can confirm it by checking if latency (see table below) is high and 5xx errors are returned by ELB. In that case, consider scaling up your backend, tuning it, or increasing the idle timeout to support slow operations such as file uploads. If your instances are closing connections with ELB, you should enable keep-alive with a timeout higher than the ELB idle timeout.

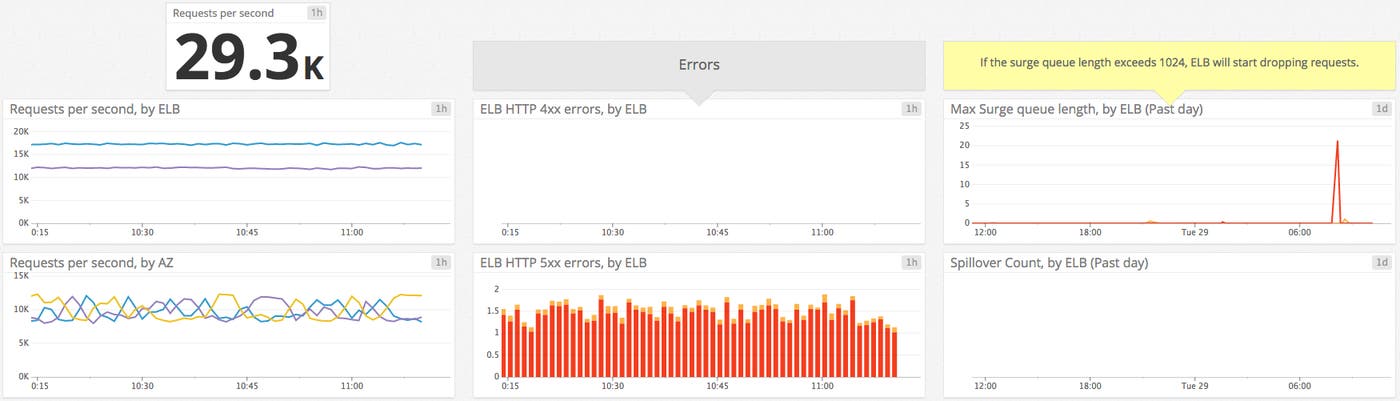
There is usually not much you can do about 4xx errors, since this metric basically measures the number of erroneous requests sent to ELB (which returns a 4xx code). If you want to investigate, you can check in the ELB access logs (see Part 2) to determine which code has been returned.

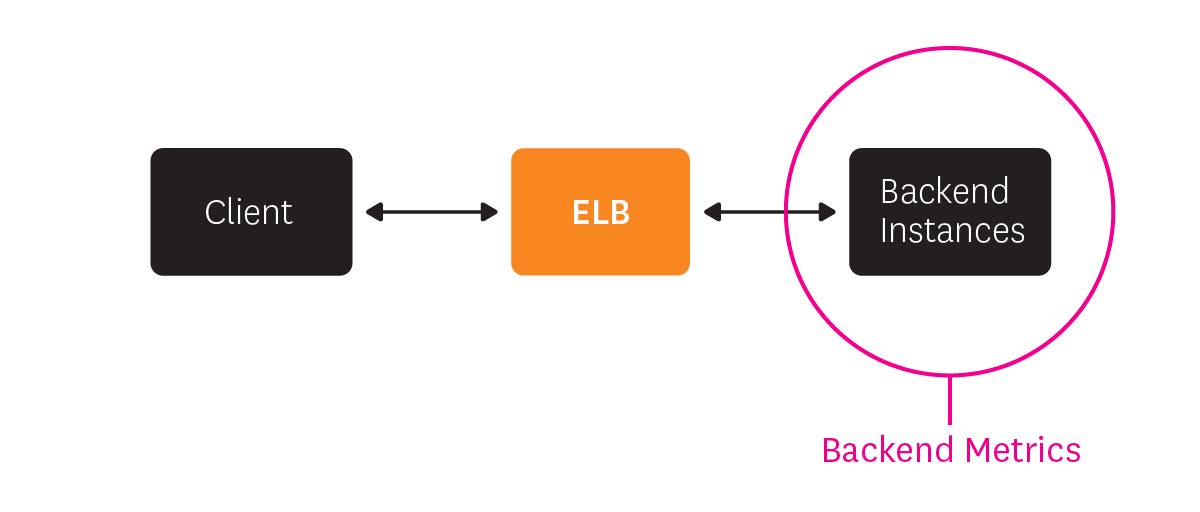
CloudWatch also provides metrics about the status and performance of your backend instances, for example response latency or the results of ELB health checks. Health checks are the mechanism ELB uses to identify unhealthy instances so it can send requests elsewhere. You can use the default health checks or configure them to use different protocols, ports, or healthy/unhealthy thresholds. The frequency of health checks is 30 seconds by default but you can set this interval to anywhere between 5–300 seconds.
| Name | Description | Metric Type |
|---|---|---|
| HealthyHostCount * | Current number of healthy instances in each availability zone. | Resource: Availability |
| UnHealthyHostCount * | Current number of unhealthy instances in each availability zone. | Resource: Availability |
| Latency | Round-trip request-processing time between load balancer and backend | Work: Performance |
| HTTPCodeBackend2XXHTTPCodeBackend3XX | Number of HTTP 2xx (success) / 3xx (redirection) codes returned by the registered backend instances during the selected time period. | Work: Success |
| HTTPCodeBackend4XXHTTPCodeBackend5XX | Number of HTTP 4xx (client error) / 5xx (server error) codes returned by the registered backend instances during the selected time period. | Work: Error |
| BackendConnectionErrors | Number of attempted but failed connections between the load balancer and a seemingly-healthy backend instance. | Resource: Error |
These counts can be tricky to interpret in CloudWatch in some cases. Indeed, when Cross-Zone Balancing is enabled on an ELB (to make sure traffic is evenly spread across the different availability zones), all the instances attached to this load balancer are considered part of all AZs by CloudWatch (see Part 2 for more about metrics collection). So if you have for example two healthy instances in one zone and three in the other, ELB will display five healthy hosts per AZ, which can be counter-intuitive.
HealthyHostCount and UnHealthyHostCount: If an instance exceeds the unhealthy threshold defined for the health checks, ELB flags it and stops sending requests to that instance. The most common cause is the health check exceeding the load balancer’s timeout (see note below about timeouts). Make sure to always have enough healthy backend instances in each availability zone to ensure good performance. You should also correlate this metric with Latency and SurgeQueueLength to make sure you have enough instances to support the volume of incoming requests without substantially slowing down the response time.
Latency: This metric measures your application latency due to request processing by your backend instances, not latency from the load balancer itself. Tracking backend latency gives you good insight on your application performance. If it’s high, requests might be dropped due to timeouts, which can lead to frustrated users. High latency can be caused by network issues, overloaded backend hosts, or non-optimized configuration (enabling keep-alive can help reduce latency for example). Here are a few tips provided by AWS to troubleshoot high latency.
BackendConnectionErrors: Connection errors between ELB and your servers occur when ELB attempts to connect to a backend, but cannot successfully do so. This type of error is usually due to network issues or backend instances that are not running properly. If you are already alerting on ELB performance errors and latency, you may not want to be alerted about connection errors that are not directly impacting users.
NOTE: If a connection with the backend fails, ELB will retry it, so this count can be higher than the request rate.

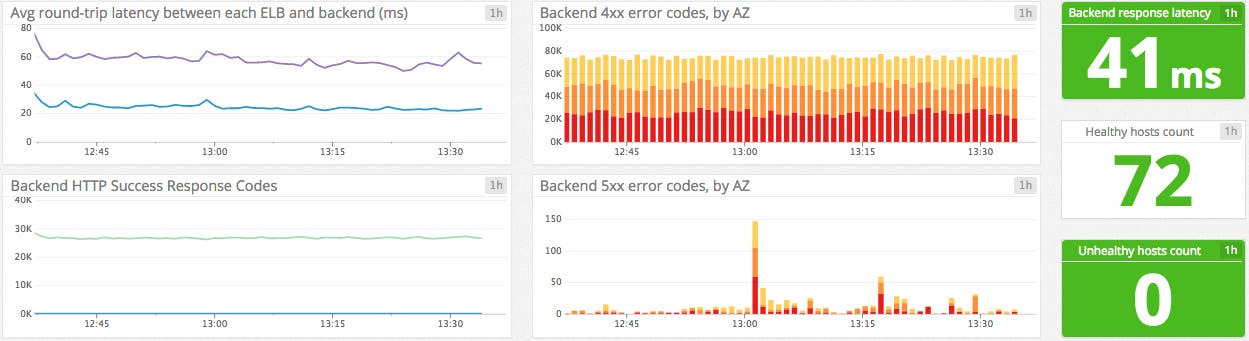
You might want to monitor the HTTP codes returned by your backend for a high-level view of your servers. But for more granularity and better insight about your servers, you should monitor them directly or by collecting native metrics from your instances (see Part 3), or also analyze their logs (see Part 2).
For each request, there is one connection between the client and load balancer, and one connection between the load balancer and backend. And for each request, ELB has an overall idle timeout which is by default 60 seconds. If a request is not completed within these 60 seconds, the connection is closed. If necessary you can increase this idle timeout to make sure long operations like file transfers can be completed.
You might want to consider enabling keep-alive in your EC2 backend instances settings so your load balancer can reuse connections with your backend hosts, which decreases their resource utilization. Make sure the keep-alive time is set to more than the ELB’s idle timeout so the backend instances won’t close a connection before the load balancer does—otherwise ELB might incorrectly flag your backend host as unhealthy.
Backend instances’ health and load balancers’ performance are directly related. For example, high CPU utilization on your backend instances can lead to queued requests. These queues can eventually exceed their maximum length and start dropping requests. So keeping an eye on your backend hosts’ resources is a very good idea. For these reasons, a complete picture of ELB’s performance and health includes EC2 metrics. We will detail in Part 3 how correlating ELB metrics with EC2 metrics will help you gain better insights.
In this post we have explored the most important Amazon ELB performance metrics. If you are just getting started with Elastic Load Balancing, monitoring the metrics listed below will give you great insight into your load balancers, as well as your backend servers’ health and performance:
Request count
Surge queue length and spillover count
ELB 5xx errors
Backend instances health status
Backend latency
Part 2 of this series provides instructions for collecting all the metrics you need from ELB.
此内容由惯性聚合(RSS阅读器)自动聚合整理,仅供阅读参考。 原文来自 — 版权归原作者所有。