












Large-scale data processing jobs that run on Apache Spark engines, including Databricks, can take hours or days to complete and cost thousands of dollars per month. When a job exceeds its expected duration or cost, data engineers need to understand whether the problem comes from infrastructure sizing, Spark configuration, query design, code, or a combination of these factors. The Spark UI and Spark History Server contain valuable execution details, but finding the right bottleneck and mapping it back to the right fix can take hours of manual investigation.
Datadog Data Observability’s Jobs Monitoring feature now helps data engineering teams identify high-impact optimization opportunities across Spark and Databricks jobs, then turn those findings into targeted fixes. Recommendations use job execution context from Jobs Monitoring to proactively surface changes at the code, query, configuration, and infrastructure layers. With Datadog MCP Server tools, Bits Code, and source code context, engineers can apply optimizations directly in the Datadog UI or bring production job performance data into their existing AI-assisted development workflows—without loading large and noisy Spark history data into an agent’s context window.
In this post, we’ll show you how to:
Proactively identify optimization opportunities across jobs in your data pipelines
Quickly generate and merge code fixes with Bits Code
Chat with Bits while investigating slow jobs to troubleshoot faster
Optimize jobs within your coding agent workflows using Datadog MCP Server
Data Observability’s Jobs Monitoring recommendations (now available in a public Preview) help you find the Spark and Databricks jobs that have the largest potential impact on cost and duration. Instead of starting with an individual failed run or manually combing through Spark execution details, you can review recommendations across teams, pipelines, and workloads from a centralized page in Data Observability. This gives platform and data engineering teams a prioritized way to focus optimization work where it can have the most effect.
Datadog uses execution context from Jobs Monitoring to identify changes that can improve performance or reduce cost. These recommendations include:
Spark configuration changes, such as right-sizing spark.sql.shuffle.partitions or adjusting spark.executor.memory
Code and query changes, such as applying predicate pushdown, changing join types, salting join keys to address data skew, or removing redundant aggregations
Infrastructure changes, such as selecting more appropriate node instance types
By tying these recommendations to real production execution data, Datadog helps you move from broad optimization advice to actionable changes for specific jobs.
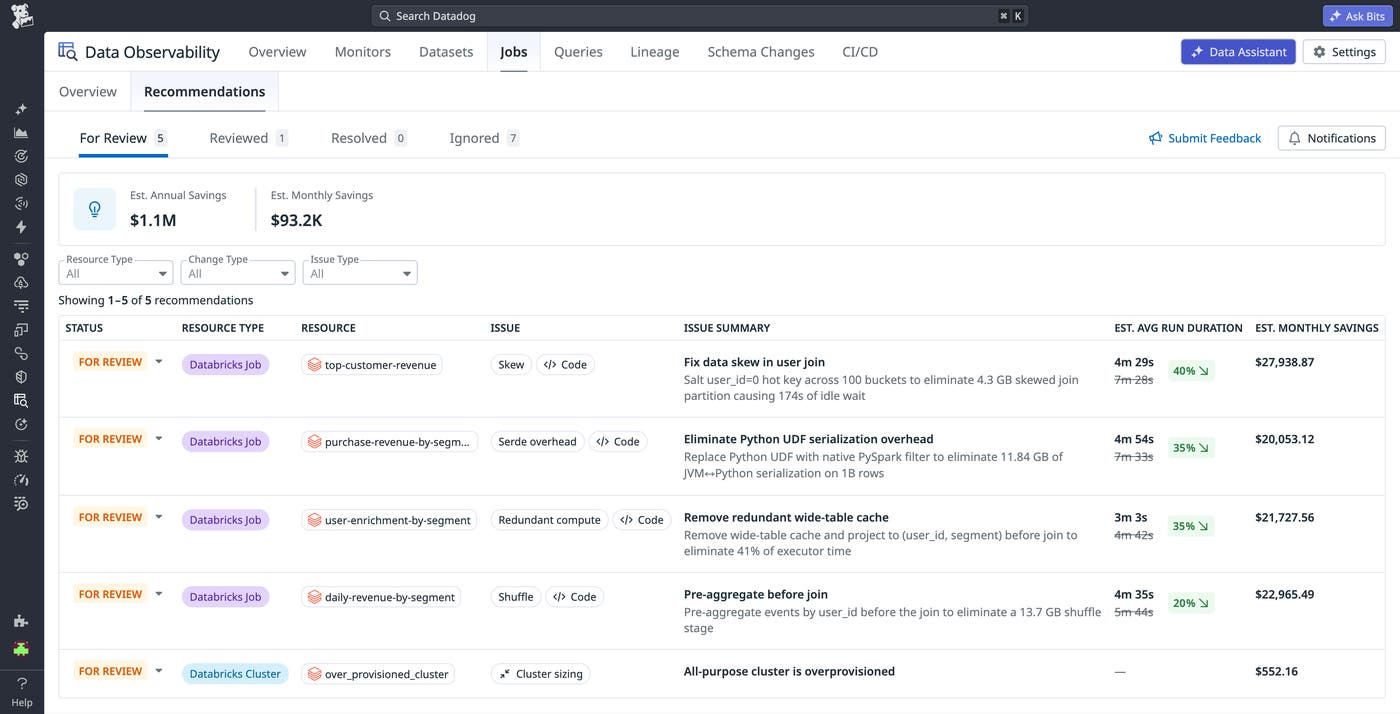
Each recommendation includes a savings estimate that is based on resource consumption or DBU usage data for Databricks jobs. If you also use Cloud Cost Management to collect Databricks and cloud provider costs from AWS, Microsoft Azure, or Google Cloud, Datadog can provide more accurate savings estimates that reflect your actual cost data.
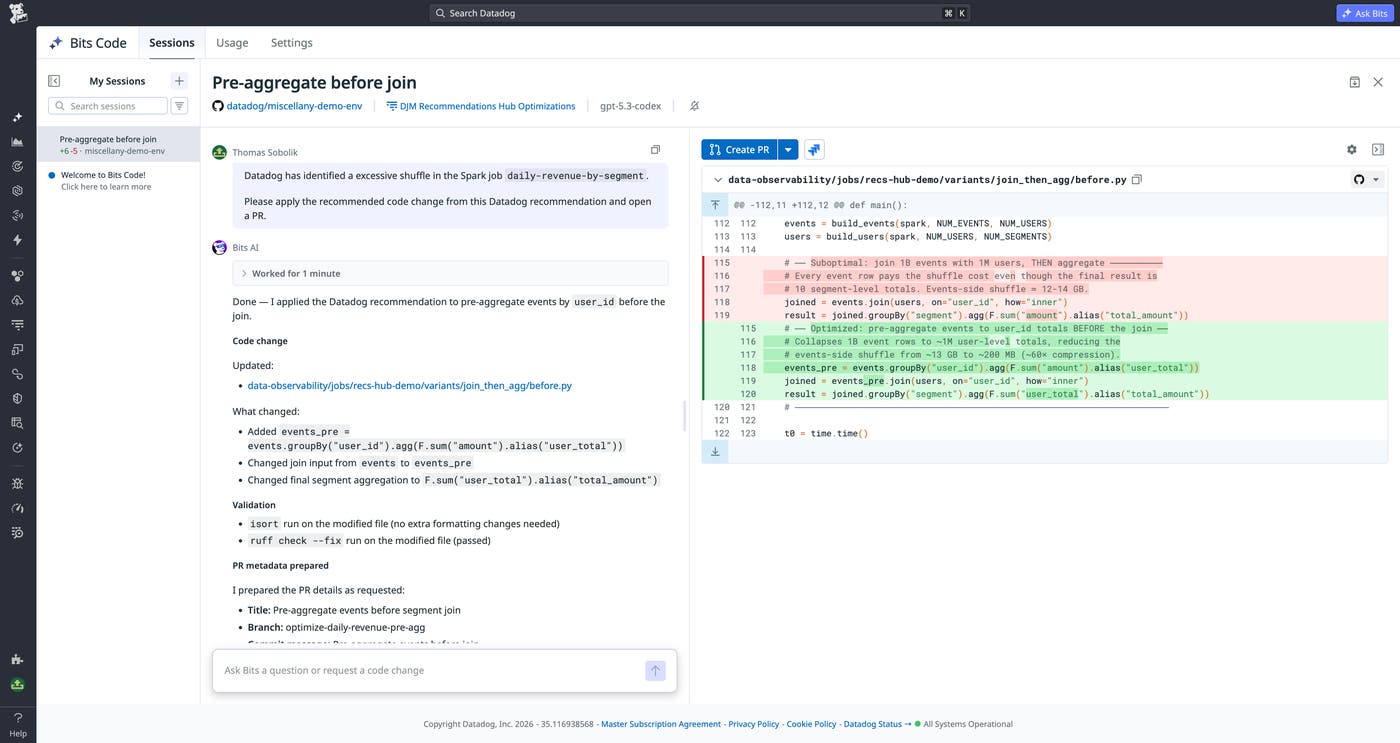
When you select a recommendation, Datadog shows the specific issue, the expected impact, and the proposed change. For example, a recommendation might show a code change for a job that can reduce cost and duration by preaggregating events before joining two tables, which decreases the amount of data shuffled. From there, you can review the diagnosis and suggested fix before deciding whether to make the change.
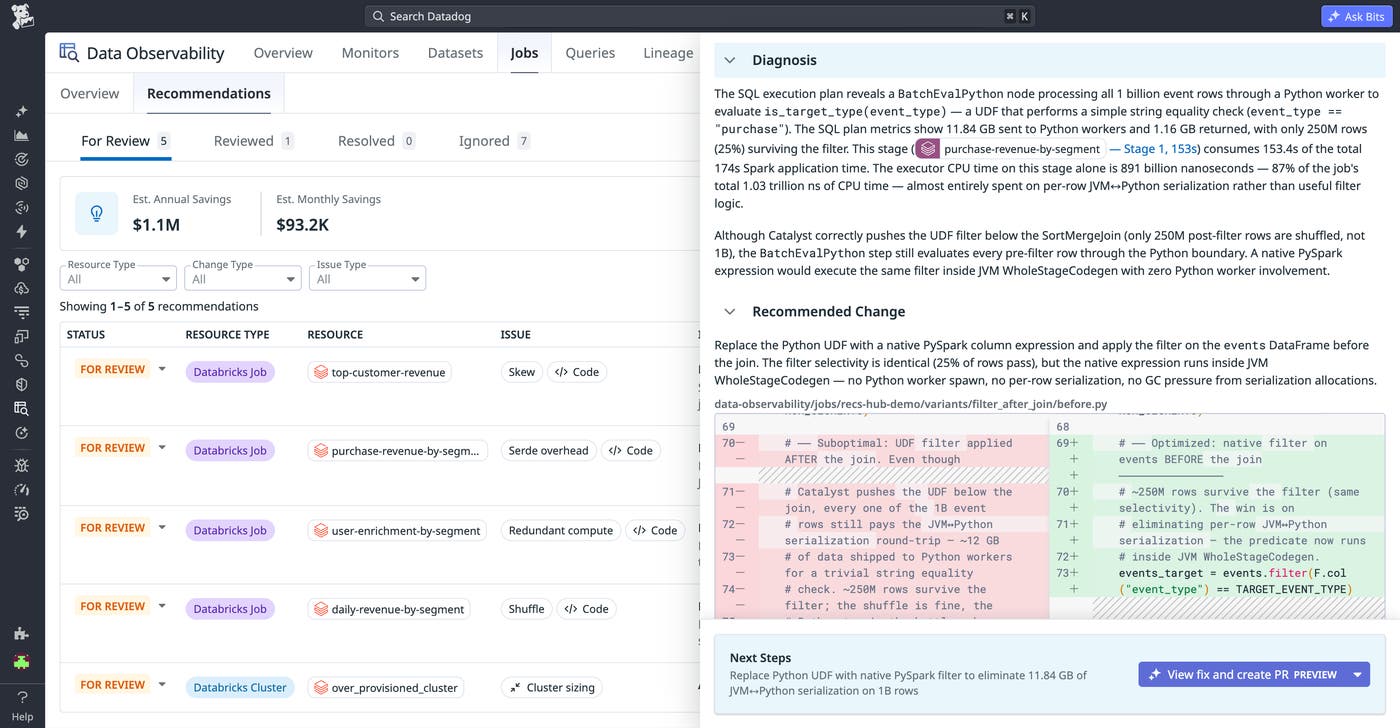
After reviewing a recommendation, you can start remediation directly from Datadog by selecting “View fix and create PR.” This workflow can use Bits Code to create a pull request with a proposed change for review.
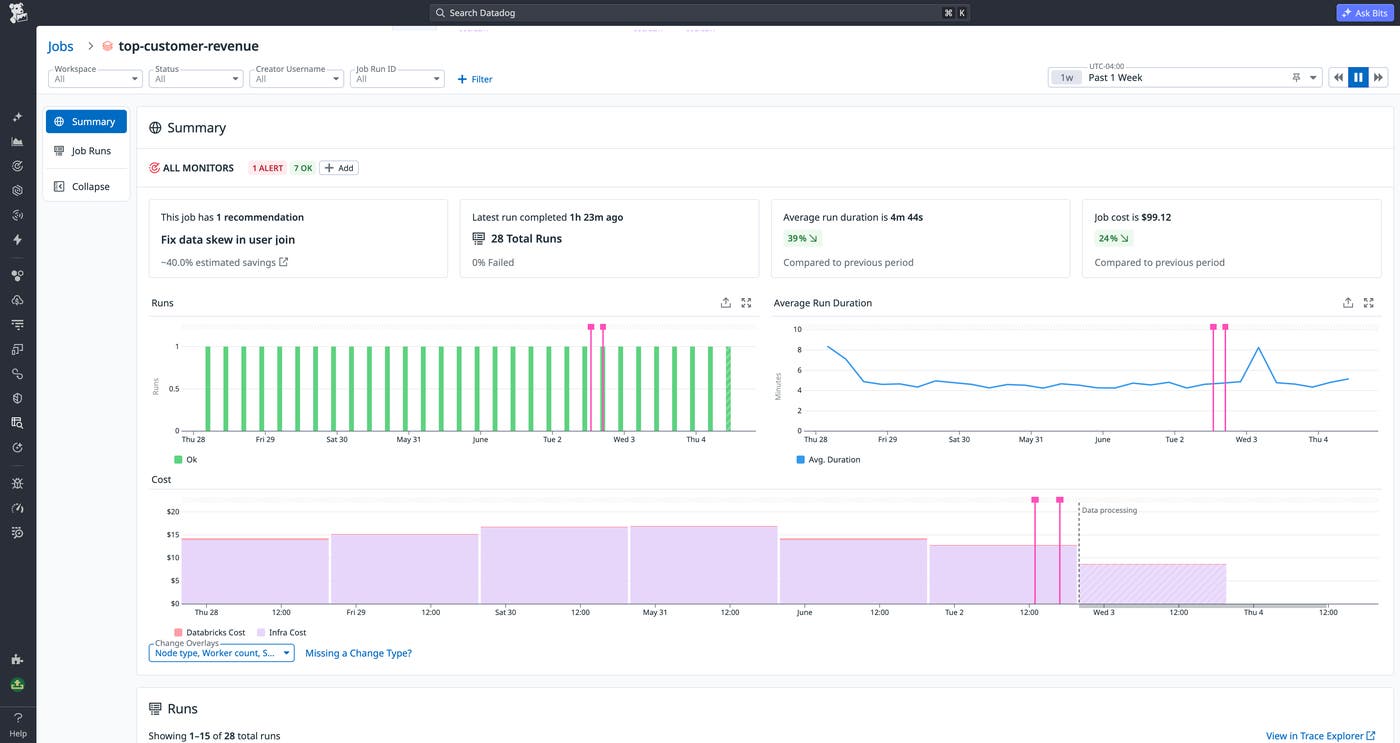
Once the change is merged and the job runs again, you can return to the job page to validate whether the run duration, cost, and related Spark metrics improved as expected.
You can also configure notifications for optimization recommendations. For example, you can notify a team only when a recommendation crosses a savings threshold or applies to a specific type of optimization. This helps teams learn about meaningful opportunities without creating noise for every minor recommendation.
Often, optimization work starts reactively—when a job fails, misses a service level agreement (SLA), or runs longer than expected. In those cases, the job page in Jobs Monitoring gives you the context you need to investigate the affected run before you decide on a fix. You can review recent runs, compare the problematic run against historical behavior, and inspect Spark execution details from the same workflow you use to monitor your data pipelines.
When you identify a run that needs deeper analysis, you can select “Optimize with Bits” from the job investigation workflow. Bits can review detailed Spark query and stage execution data, and, if you have source code integration configured, use repository context to recommend a code change. This can help you move from “this job is slower than normal” to a specific hypothesis, such as an expensive join, a skewed key, a redundant aggregation, or a configuration value that no longer matches the job’s data volume.
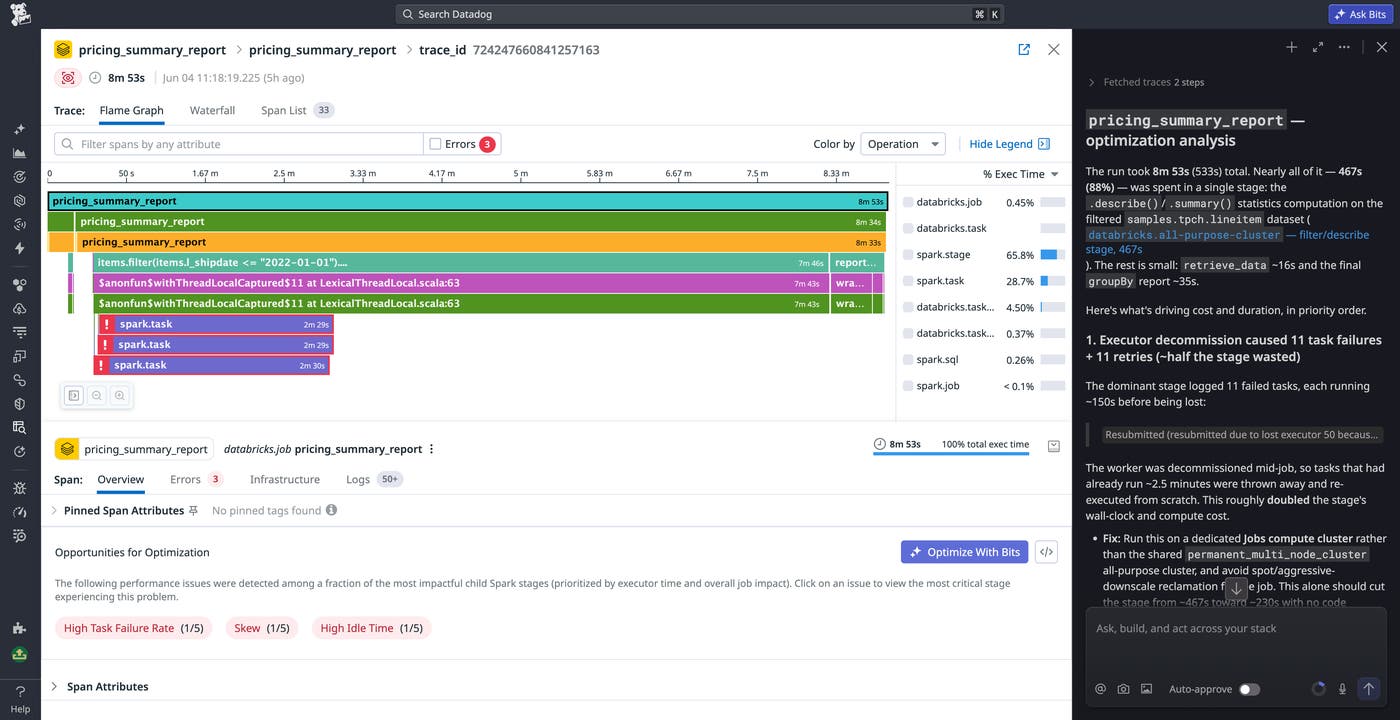
Just like with the proactive recommendations workflow described in the previous section, you can close the loop by asking Bits to create a PR implementing the fixes it created. This reactive workflow complements proactive recommendations. Proactive recommendations help teams continuously find large opportunities across pipelines, while investigation-time guidance helps engineers diagnose a specific job when it affects data delivery expectations. Together, these workflows give data teams multiple entry points for improving Spark performance and cost efficiency.
When data engineers investigate performance issues, they often spend most of their time jumping between performance data in the Datadog UI or Spark UI and code in their editor. By bringing production Spark execution context directly into agentic coding workflows, Datadog MCP Server removes the need for this context switching. With Datadog MCP Server, engineers can ask their coding agent to inspect the health of a Spark job, focus on the worst-performing stages, and connect that runtime behavior to the code that generated it.
Spark tools for Datadog MCP Server are designed to give AI agents focused context instead of overwhelming them with full Spark History Server logs. The get_spark_health tool returns the overall health of a Spark job and its worst-performing stages, giving the agent a ranked starting point for analysis. The get_spark_sql_plan tool retrieves the low-level execution plan and stage metrics for a specific trace, so the agent can go deeper after it identifies the most relevant stage.
For example, you might prompt your coding agent with a request such as:
Help me optimize the <job name> job. Evaluate its performance over the past day using get_spark_health. Look at the worst stages, correlate them with the code at <repo path>, and retrieve the associated execution plans using get_spark_sql_plan. For the worst stage, create hypotheses for the root cause and discuss them with me.
This workflow gives the agent enough context to reason about production performance without requiring you to paste noisy Spark logs into the prompt that might dilute response quality.
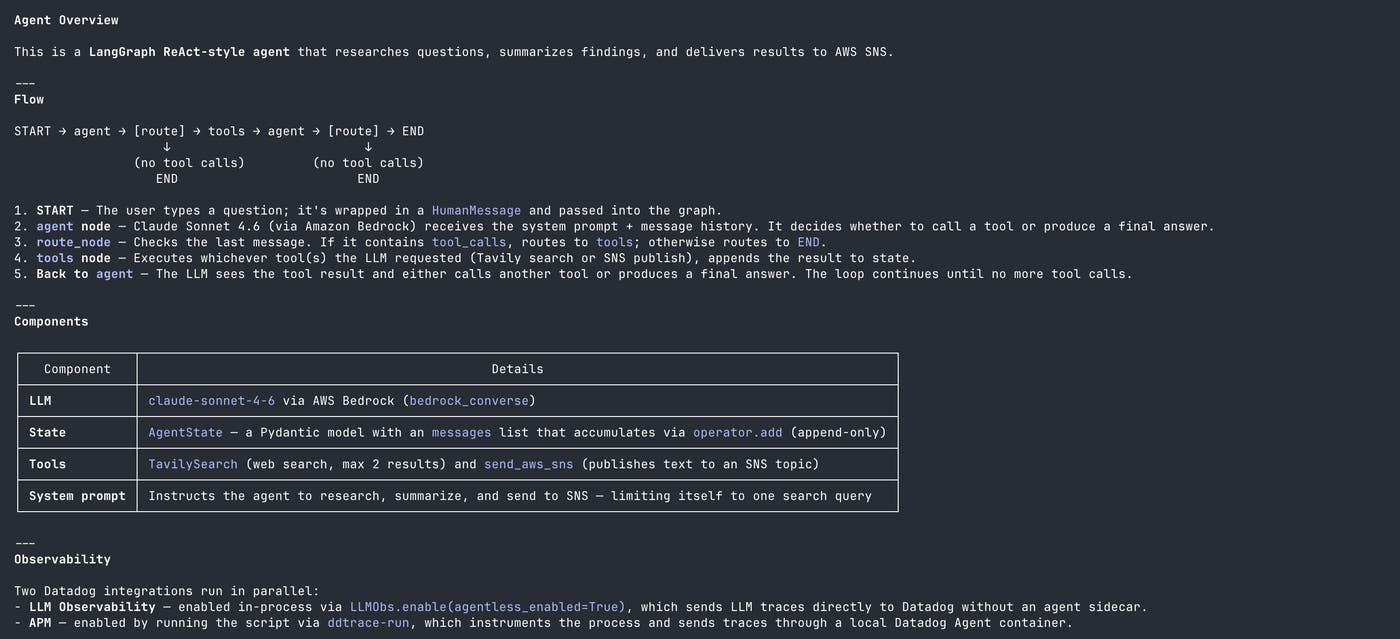
You can also include a Markdown file that describes your team’s known Spark patterns and standards, such as preferred join strategies, partitioning rules, or limits on specific configuration changes. The agent can then compare its proposed fixes against your team’s guidance before you review and apply them.
This approach is especially useful when the best fix requires both runtime and code context. A Spark stage may appear slow because of skew, excessive shuffle, inefficient serialization, or an overprovisioned cluster. By combining Datadog execution data with repository context, your coding agent can help generate more relevant hypotheses and proposed changes than it could from code alone.
Datadog engineers have used this workflow to find changes that cut our daily compute costs by 44% and reduced run duration by 60% in US1, our largest data center. For a deeper dive into this process, read our blog post.
Datadog helps data engineering teams identify high-value Spark and Databricks optimization opportunities, understand the underlying execution bottlenecks, and apply fixes using production context. With Jobs Monitoring recommendations, Datadog MCP Server Spark optimization tools, and Bits, teams can reduce the time they spend correlating Spark performance data with code and focus on changes that can improve job duration and cost.
Spark optimization analysis with Datadog MCP Server and Bits is now generally available. Proactive Job Recommendations in Datadog Jobs Monitoring is currently available in Public Preview. You can also see the Jobs Monitoring documentation, read more about Datadog Data Observability and Jobs Monitoring, and learn how to monitor Databricks serverless jobs with Datadog. If you don’t already have a Datadog account, you can sign up for a 14-day free trial.
此内容由惯性聚合(RSS阅读器)自动聚合整理,仅供阅读参考。 原文来自 — 版权归原作者所有。