


This year’s DASH keynote marked a new chapter in Datadog’s platform evolution, where AI-driven insights enhance observability and power more efficient, resilient workflows. The keynote introduced dozens of new capabilities that help teams break down silos, reduce infrastructure complexity, and accelerate remediation for performance and security issues.
Whether you’re debugging AI workloads, building custom Datadog apps, securing multi-cloud environments, or improving test reliability, Datadog gives teams the tools to move faster without sacrificing control.
Review all the major keynote announcements below, including major updates to Datadog’s infrastructure monitoring, software delivery, and governance capabilities. And read our other roundup posts to see how Datadog enables you to:
Multi-agentic systems are difficult to debug due to their non-deterministic behavior, where agents may make different decisions or take varying paths even when given the same inputs. Datadog LLM Observability’s new execution flow chart visualizes the execution run and decision path of your AI agents. In addition to highlighting how agents interact with one another, this new visualization also shows you what tools agents used, as well as any retrieval steps they needed to take. Easy to setup, LLM Observability SDK automatically tracks AI agent operations built with frameworks like OpenAI Agent SDK, LangGraph, CrewAI, and Bedrock Agent SDK. For more information, read our blog post. To request early access to this feature, fill out this interest form.
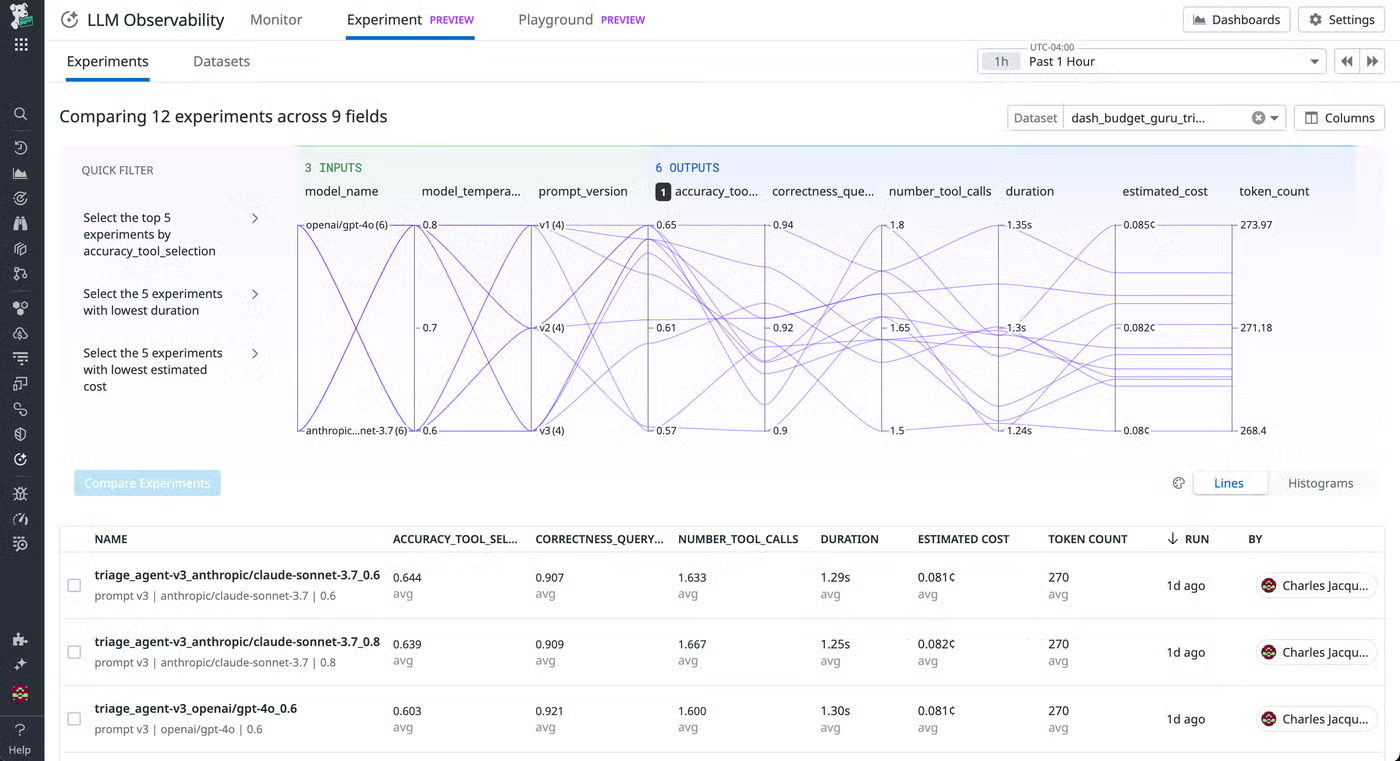
LLM Experiments is a new feature in our LLM product suite that supports the entire lifecycle of building LLM applications and agents. You can create and version datasets from scratch or by using production traces. Run experiments, log and compare results using powerful visualizations, and understand how changes to prompts, models, providers, or architecture influence performance. LLM Experiments helps you confidently identify and deploy the most effective version to production. To help you iterate quickly, we’re also introducing Prompt Playground, a dedicated environment to test, tweak, and refine prompts across different model providers.
Read more in our blog post, or sign up for the Preview here to try these new capabilities.
With AI Agents Console, you can monitor the behavior and interactions of any AI agent that’s a part of your enterprise stack, whether that’s a computer use agent like OpenAI’s Operator, IDE agent like Cursor, DevOps agent like Github Copilot, enterprise business agent like Agentforce, or your internally built agents. You’ll have full visibility into every agent’s actions, insights into the security and performance of your agents, analytics on user engagement, and measurable business value from every agent, all in a centralized location. AI Agents Console is currently in Preview. Request access here.
As organizations scale AI and LLM workloads, inefficient GPU usage and underutilized infrastructure can drive up costs and slow performance. With Datadog GPU Monitoring, engineering and ML teams can monitor GPU fleet health across cloud, on-prem, and GPU-as-a-Service platforms like Coreweave and Lambda Labs. Real-time insights into allocation, utilization, and failure patterns make it easy to spot bottlenecks, eliminate idle GPU spend, and resolve provisioning gaps. By tying usage metrics directly to cost and surfacing hardware and networking issues impacting performance, Datadog helps teams make fast, cost-efficient decisions to keep AI workloads running reliably at scale. Read more in our blog post. Fill out this form to request access to the Preview.
Data observability is key to ensuring reliability across the entire data life cycle—from ingestion to transformation to downstream use. But without adequate data observability solutions, users often have to rely on manual checks, ad hoc SQL queries, or reactive alerts to catch data quality issues—often after stakeholders have noticed something has gone wrong. Datadog Data Observability provides a complete solution with quality checks (e.g., volume, row changes, freshness), custom SQL-based monitors, anomaly detection, column-level lineage across systems like Snowflake and Tableau, full pipeline visibility, and targeted alerts when data issues arise. Learn more in our dedicated blog post, or sign up for the Preview to get started.
With its new Frozen Tier, Flex Logs for Datadog Log Management helps organizations cost-effectively centralize all of their logs in one platform, eliminating the overhead of maintaining external storage solutions as well as the need for disruptive context-switching. With Flex Frozen, you can keep your logs in fully managed storage for up to seven years while reining in costs and maintaining in-place searchability—without rehydration—so you can make quick work of audits and long-range analytics. This makes Flex Frozen an ideal solution for logs held long-term for compliance or forensic investigation purposes. To learn more about Flex Logs, read our dedicated blog post and documentation.
Archive Search enables teams to query archived logs directly in cloud storage (such as Amazon S3) or Datadog’s Flex Frozen Tier, without rehydrating data or exporting it to external tools. This makes it easier to investigate incidents, support compliance audits, and analyze long-term trends using the same Datadog interface and query language already in use. Integrated with Log Workspaces and Datadog Sheets, Archive Search helps you correlate logs with infrastructure metrics and traces, accelerating investigations and reducing tool switching. You can preview logs in place, explore full context, and maintain visibility across your entire log lifecycle, all within the Datadog platform. Read our blog post, or sign up for the Preview here.
With Bits AI Data Analyst you can use natural language and AI-driven guidance directly in Datadog Notebooks, enabling you to explore data, generate visualizations, investigate issues, and generate reports conversationally. Instead of writing complex queries or stitching together SQL and transformations, users can ask rich analytical questions like:
Bits AI interprets the prompt and builds a logical sequence of notebook cells—including queries, transformations, joins, and visualizations—that together form a complete, step-by-step analysis. Each cell builds on the previous one, helping users dig deeper into the problem, refine their investigation, and understand the results in context. Data Analyst inside Notebooks is in Preview. Please request access here.
Datadog Sheets provides a spreadsheet-style interface for analyzing your telemetry data, including logs, RUM events, cloud cost data, and infrastructure metrics. You can perform lookups, build pivot tables, and create calculated columns using familiar spreadsheet functionality. This enables teams to join datasets, aggregate results, and explore trends without writing code. Results can be visualized, shared with colleagues, or added to dashboards for ongoing monitoring and collaboration. Read more in our blog post and documentation.
Datadog now supports advanced analysis features directly within Notebooks. You can perform multi-step queries, apply transformations, and chain results together in a flexible, visual interface. These features make it easier to extract insights from complex logs, correlate across datasets, and document investigations, all without leaving Datadog. In addition to parity with Log Workspaces, Notebooks offer enhanced capabilities like inline explanations and integration with other analysis tools. Read more in our blog post.
Datadog Internal Developer Portal (IDP) helps developers quickly track down shared engineering knowledge, execute common production tasks in self-service manner, and evaluate the production-readiness of new service code. Datadog IDP includes three core features:
To learn more about how Datadog IDP helps accelerate software delivery, check out our blog post or our documentation.
Incident response can be disorienting. The first few minutes mean switching between different devices and platforms to triage the issue, then regularly pivoting to other tools to update stakeholders as the incident continues. New features in Datadog On-Call and Incident Response help you seamlessly manage these tasks. With our AI voice agent, you can quickly get up to speed on the issue and start taking action directly from your phone. Handoff notifications make it easy to jump straight to the relevant context and quickly communicate with other responders. Finally, our status pages enable you to automatically update users on your remediation progress. To learn more about these features, check out our blog post.
Pinpointing the origin of increased response times in distributed systems often requires manually stitching together data from traces, metrics, logs, and profiling while also validating multiple hypotheses about downstream bottlenecks, deployment changes, or database slowdowns. Datadog’s Latency Investigator for APM—now in Preview—automatically investigates hypotheses in the background, comparing historical traces and correlating change tracking, DBM, and profiling signals. This helps teams quickly isolate root causes and understand impact without combing through raw telemetry data. Fill out this form to request access.
As your systems grow in complexity, performance and reliability issues become harder to catch and even harder to act on. Proactive App Recommendations helps you stay ahead by analyzing telemetry from APM, Real User Monitoring (RUM), Continuous Profiler, and Database Monitoring (DBM) to automatically detect issues and propose actionable fixes. You can go from detection to resolution in a single workflow, using context such as trace data, session replays, and profiling insights to understand the impact. Then you can quickly generate a pull request to apply a recommended fix, all without leaving Datadog. Whether you’re addressing latency from sequential API calls, resolving frontend frustration signals, or optimizing inefficient code paths, Proactive App Recommendations enables you to turn observability into action. Learn more in our blog post.
You can now build Datadog apps by submitting natural-language requests to Bits AI. Describe a need—for example, “Build me an app to revert deployments in GitLab”—and Bits AI auto-generates UI components, actions, and logic, all mapped to your existing data and permissions. Iterate by chat to tweak fields, flows, or styling without touching code, accelerating delivery while preserving the ability to dive into the underlying definition at any time. Fill out this interest form, or reach out to your Customer Success Manager to get access.
Bits AI SRE is your AI on-call teammate, built to autonomously investigate alerts and coordinate incident response. Integrated with Datadog, Slack, GitHub, Confluence, and more, Bits analyzes telemetry, reads documentation, and reviews recent deployments to determine the root cause of alerts—often before you’ve even opened your laptop. In fact, if you’re using Datadog On-Call, you can view Bits’s findings right from your phone—so you’re always one step ahead, no matter where you are. When an alert turns into an incident, Bits steps in to coordinate the response: keeping stakeholders informed, surfacing related issues, and generating post-incident reviews. It works like a teammate inside the tools your team already uses, collaborates via chat, and learns from every investigation. Read our blog post to learn more.
The Bits Dev Agent is an AI-powered coding assistant in Datadog designed to reclaim developer productivity by autonomously monitoring telemetry data, identifying key issues, and generating production-ready pull requests. Fully integrated within the Datadog platform, the Dev Agent uses real-time logs, metrics, security signals, and runtime context to provide targeted, test-backed fixes aligned with team standards. Developers receive asynchronous, context-rich PRs with clear explanations, allowing them to shift their focus from troubleshooting to reviewing solutions and building better code.
Check out our blog post to learn more about the Bits AI Dev Agent, or sign up for the Preview to get started. You can also read more about other exciting new Bits AI SRE and Bits AI Security Analyst features.
Datadog’s Bits AI Security Analyst transforms the way security teams handle investigations by autonomously triaging Datadog Cloud SIEM signals. Built natively in Datadog, it conducts in-depth investigations of potential threats and delivers clear, actionable recommendations. With context-rich guidance for mitigation, security teams can stay ahead of evolving threats with greater efficiency and precision.
Bits AI Security Analyst is currently available in Preview. You can request access and learn more in our blog post.
With the Action Interface, teams can trigger safe, audited actions on their infrastructure directly from chat using Bits AI—no workflows or apps required. Reliability (SRE), on-call, platform, and security engineers can restart services, reboot servers, flush caches, quarantine user accounts, and more in seconds in a safe and controlled way. Every action is validated against role-based policies and logged to Datadog Audit Trail, ensuring accountability. For more information, see our documentation.
The Datadog Cursor Extension uses the Datadog remote MCP Server to give developers access to Datadog tools and observability data directly from within the Cursor IDE. This means that when you interface with the Cursor chat, the Cursor Agent is able to use Datadog Error Tracking and Live Debugging to add logpoints in your application code that help you troubleshoot errors and generate unit tests based on live production data. The Cursor Extension enables you to view live variable values that your logpoints capture during execution, and you can use the Cursor Agent to identify the lines of code responsible for the issue at hand.
The Datadog Cursor Extension is now available in Preview. You can read our blog post to see how the Cursor Extension can be used to troubleshoot a real-world business problem, or check out our documentation to learn more.
The remote Datadog MCP Server enables AI agents to access telemetry from Datadog. This helps address logistical challenges with using AI agents, such as authentication, HTTP request handling, and ensuring that responses provide highly relevant context. The MCP Server derives the intent of natural language prompts and makes subsequent calls to corresponding Datadog endpoints to address the intent of the query. For example, you’re now able to ask any other MCP-compliant agent—which includes Cursor, Claude, or Codex—to search for Redis errors. The agent will then use the Datadog MCP Server to retrieve Redis logs from your Datadog environment and surface any errors.
The Datadog remote MCP Server is now available in Preview. To learn more about this feature, check out our documentation or read our blog post, where we walk through the full example where we surface Redis errors and correlate them with an ongoing incident.
此内容由惯性聚合(RSS阅读器)自动聚合整理,仅供阅读参考。 原文来自 — 版权归原作者所有。