







Ingress NGINX has been a key Kubernetes component for many organizations, helping them manage external traffic to services within their clusters. But in March 2026, Ingress NGINX reached end-of-life (EOL), and migrating away from it became an urgent security imperative. IngressNightmare, and more recently CVE-2026-24512 and CVE-2026-3288, show how ingress vulnerabilities can have cluster-wide impact. And now that the controller is EOL, future vulnerabilities will have no supported fixes.
Ingress NGINX implements the Kubernetes Ingress API, which is still supported but feature-frozen. The Kubernetes project recommends migrating away from Ingress NGINX to its designated successor, Kubernetes Gateway API, which is supported by multiple controller implementations.
In this post, we’ll show you the steps you can follow to migrate to Gateway API. Then we’ll provide guidelines for monitoring your migration, and we’ll look at how resources and roles shape Gateway API’s routing behavior.
Migrating successfully from Ingress NGINX to Gateway API requires a structured, incremental approach. This section walks you through each of the following steps at a high level to help ensure that your migration is careful and complete:
Choose a Gateway API controller.
Capture a performance baseline.
Install the Gateway API controller.
Translate Ingress configuration into Gateway and Route resources.
Verify that your Gateway and Routes were accepted.
Validate routing behavior before shifting traffic.
Gradually shift production traffic.
Gateway API is a specification and set of API resources only. It’s implemented by a range of controllers, including open source projects and cloud-provider-managed offerings. Unlike Ingress NGINX, which often relies on controller-specific annotations for advanced routing, Gateway API builds these capabilities directly into the API resources.
By moving configuration out of custom annotations and into core resources, Gateway API makes traffic management portable across implementations. This minimizes lock-in and enables you to choose (or switch) controllers based on your requirements, though you should note that conformance levels and routing behavior can vary among controllers.
Controllers that are commonly used in production include:
NGINX Gateway Fabric, which will seem familiar to teams coming from Ingress NGINX.
Istio, which is a natural fit for teams already running Istio for service mesh and ingress traffic.
Envoy Gateway, which is a strong fit for teams standardizing on Envoy-based infrastructure.
Cloud-provider implementations such as GKE Gateway, AWS Load Balancer Controller, and Azure Application Gateway for Containers, which can reduce the operational overhead of running and upgrading a controller yourself.
If you’re planning to use Gateway API as the foundation for LLM inference workloads, your controller choice matters: The Gateway API Inference Extension, which enables model-aware and KV cache-aware routing, currently relies on the ext_proc protocol supported by Envoy Gateway and Istio.
Before you begin the migration, choose a controller that meets your requirements and fits your operational model. A key decision factor is the type of traffic you need to support. While all Gateway API controllers support HTTP, support for non-HTTP protocols (such as TCP or UDP) varies by implementation. If your workloads rely on these protocols, you’ll need a controller that can handle them. To understand your current usage, identify any non-HTTP traffic that your services handle. Ingress NGINX configures these protocols using ConfigMaps, and you can inventory the Layer 4 traffic it handles by using commands like these:
kubectl get configmap tcp-services -n ingress-nginx
kubectl get configmap udp-services -n ingress-nginx
Once you’ve selected an appropriate Gateway API controller, you’re ready to migrate.
Before you begin the migration, capture a performance baseline so you can compare Gateway API behavior against your cluster’s historical performance. During the migration, you should track Ingress NGINX metrics like request rate, request latency, and error rate alongside Gateway API performance data. You can collect this same data in advance to set a pre-migration baseline. Centralize it so your team can use it collaboratively throughout the migration to determine whether things are on track or whether you need to roll back your migration to investigate.
You can create a Datadog Notebook to use as a dynamic record of your migration and use it to compare baseline NGINX telemetry data against real-time Gateway API metrics. Notebooks let you share graphs, queries, and notes across teams to track your migration progress.
The Ingress API and NGINX controller can coexist with your Gateway API implementation throughout the migration. Start by installing your chosen controller and the Gateway API CustomResourceDefinitions (CRDs). You will primarily work with the following core resources:
GatewayClass: Defines the controller and the specific type of infrastructure being used.
Gateway: Defines the listeners (ports and protocols) and TLS configuration for inbound traffic. Also sets attachment constraints, which are security guardrails that define which namespaces or Route resources are permitted to attach to this entry point.
Route resources (for example, HTTPRoute and GRPCRoute): Attach to a Gateway to define how requests are matched and routed to backend services.
ReferenceGrant: Enables cross-namespace references, such as allowing a Route to target a service in a different namespace.
Once you’ve added your chosen controller and the Gateway API CRDs to your cluster, you need to validate the installation. You can use the following command to confirm that these core resources are present:
kubectl get crd | grep gateway.networking.k8s.io
The output should list the standard resources defined by the Gateway API specification, including the GatewayClass, Gateway, one or more Routes, and a ReferenceGrant. An example output is shown below:
gatewayclasses.gateway.networking.k8s.io
gateways.gateway.networking.k8s.io
httproutes.gateway.networking.k8s.io
referencegrants.gateway.networking.k8s.io
Next, check the status of the GatewayClass resource to verify that your controller has successfully registered itself and is recognized by the API server as the implementation for that GatewayClass:
You should see output similar to the following:
NAME CONTROLLER ACCEPTED AGE
nginx k8s.nginx.org/gateway True 5m
In the ACCEPTED column, you should see a status of True, confirming that a controller has accepted the GatewayClass. If this column is empty or False, inspect the controller logs to ensure that the controller has the correct permissions to watch the Gateway API resources.
Take note of the NAME value in this output; you’ll reference it as gatewayClassName when you create your Gateway in the next step.
Now you can begin modernizing your cluster’s networking by translating the intent of your existing Ingress NGINX configuration into Gateway API resources. The goal in this step is to replicate your current externally visible behavior by configuring the ports, protocols, hostnames, and TLS details that shape how requests are accepted and routed to backend services. This enables you to validate the new configuration in parallel before shifting production traffic.
The Kubernetes project’s Ingress2Gateway tool can translate Ingress manifests and many Ingress-NGINX annotations into Gateway API resources, so that you don’t need to start from a blank YAML file. This migration assistant can also warn you about configuration that can’t be translated automatically. Use it to generate a first draft of your Gateway and Route manifests. Then review the output, make any controller-specific adjustments, and validate the result in a development cluster before deploying Gateway API resources in production.
To create your Gateway resource (or finalize the initial draft generated by Ingress2Gateway), start by confirming the GatewayClass NAME that you identified in the previous step. Use that name in your Gateway’s gatewayClassName field to indicate which controller should manage the Gateway and what type of underlying infrastructure it provisions or configures. Then provide the details of the Gateway’s listeners. The following YAML shows a high-level example of a Gateway manifest:
apiVersion: gateway.networking.k8s.io/v1
kind: Gateway
metadata:
name: prod-gateway
namespace: infra-ingress
spec:
gatewayClassName: nginx # Use the Name from your GatewayClass
listeners:
- name: http
port: 80
protocol: HTTP
allowedRoutes:
namespaces:
from: All
Create your gateway by using the kubectl apply -f command.
Next, review or create the appropriate Route resources (such as HTTPRoute or GRPCRoute) to define how requests are matched (for example, by hostname and path) and forwarded to backend services. These Routes typically reference the same services your Ingress rules route to today. An HTTPRoute that translates common Ingress routing intent might look like the YAML shown here:
apiVersion: gateway.networking.k8s.io/v1
kind: HTTPRoute
metadata:
name: api-route
namespace: dev-team-a
spec:
parentRefs:
- name: prod-gateway
namespace: infra-ingress
sectionName: http
hostnames:
- api.example.com
rules:
- matches:
- path:
type: PathPrefix
value: /api
backendRefs:
- name: api-service
port: 8080
If your Route and service are in different namespaces, you must also deploy a ReferenceGrant in the service’s namespace. Whereas Ingress NGINX often allowed cross-namespace backends by default, Gateway API requires this explicit handshake to authorize the connection. If this resource is missing, your Route will fail to reconcile and show a ResolvedRefs: False status. Building on the previous YAML, the following example defines the corresponding ReferenceGrant if the api-service were located in a separate prod-services namespace:
apiVersion: gateway.networking.k8s.io/v1
kind: ReferenceGrant
metadata:
name: allow-api-route
namespace: prod-services # The namespace where the Service lives
spec:
from:
- group: gateway.networking.k8s.io
kind: HTTPRoute
namespace: dev-team-a # The namespace where the Route lives
to:
- group: "" # Core API group (empty string)
kind: Service
After you apply your manifests, confirm that the resources exist and are visible to the API server:
kubectl get gateway -n <namespace>
kubectl get httproute -n <namespace>
kubectl get grpcroute -n <namespace>
You can also inspect the resources to confirm the controller is reconciling them and populating status:
kubectl describe gateway <gateway-name> -n <namespace>
kubectl describe httproute <route-name> -n <namespace>
At this point, your Gateway API configuration exists in parallel with your current Ingress configuration. Later, you’ll use a DNS cutover to send traffic to your Gateway API infrastructure. Before that, you’ll verify that the controller has accepted the Routes and validate that requests would be routed as expected before you shift any production traffic.
After you deploy your Route resources, you need to verify that they were successfully accepted by the Gateway.
Review your Route’s status conditions (for example, by fetching the resource as YAML or JSON). Look under .status.parents[].conditions[] for entries with type: Accepted and type: ResolvedRefs. A Route that the Gateway has attached will typically show Accepted with status: "True". This confirms that the Gateway recognized the Route and that any attachment constraints (such as allowedRoutes, including namespace and kind checks) were satisfied.
To confirm that the controller has everything it needs to configure routing for that Route, check that ResolvedRefs also shows status: "True". This indicates that referenced objects—such as backend services (and other dependencies like Secrets)—were found and are valid.
If either Accepted or ResolvedRefs is False, look for details in the reason and message fields to understand what’s blocking progress. Fix the reported issue—for example, an attachment constraint that prevents the Route from being accepted, or an invalid reference to a backend service or secret—and then recheck the status conditions before proceeding with your migration.
You can use synthetic or shadow requests to validate your Gateway API configuration before you shift any production traffic. Send the same requests through your Gateway and through Ingress NGINX, then compare the outcomes across the two entrypoints. On the client side, verify that you get the same status codes, response headers, and payload behavior (and, for HTTPS, that TLS termination and hostname/SNI behave as expected). On the backend, check logs or traces to confirm that requests reached the intended service and arrived with the expected attributes (for example, the Host header, path, and forwarded headers).
If your Gateway API controller has assigned an address to the Gateway (for example, a LoadBalancer hostname), you can run this validation by sending test traffic directly to that assigned address before making any DNS changes, while using the production hostname for Host/SNI. You can see the entrypoint address using a command like the following:
kubectl get gateway <gateway-name> -n <namespace> -o jsonpath='{.status.addresses[*].value}{"\n"}'
If no external address is available yet, the output of the command will be empty. In that case, you can still validate from within the cluster by sending test requests to an in-cluster address for the Gateway dataplane (such as a service created by your implementation).
Once you’ve validated your Gateway and Routes, you’re ready to shift production traffic to your new Gateway API data plane. The most common way to do this is by performing a DNS cutover—shifting traffic by updating your DNS to point to your Gateway API entrypoint. Follow standard DNS changeover best practices: Lower your DNS TTL ahead of time so changes propagate quickly; update the relevant A, AAAA, and CNAME records for the production hostname; and monitor incoming traffic and application performance closely during and after the change.
DNS cutover is rarely instantaneous. Even with a reduced TTL, clients and resolvers may continue using cached records, so you should expect a transition period in which traffic is split between the legacy Ingress NGINX entrypoint and the new Gateway API entrypoint. During that window, monitor closely for regressions against your baseline—especially TLS failures and unexpected spikes in 4xx or 5xx errors—and be prepared to revert DNS if needed. You can keep your Gateway API resources deployed so that you can continue investigating and iterating without losing the configuration you’ve built.
To track the progress and success of your migration, you can visualize and alert on key signals in Datadog. By building a custom, migration-specific dashboard, you can place legacy Ingress NGINX performance metrics—such as request rate (nginx_ingress_controller_requests), request latency (nginx_ingress_controller_request_duration_seconds), and error rate—alongside the corresponding signals from your Gateway API implementation.
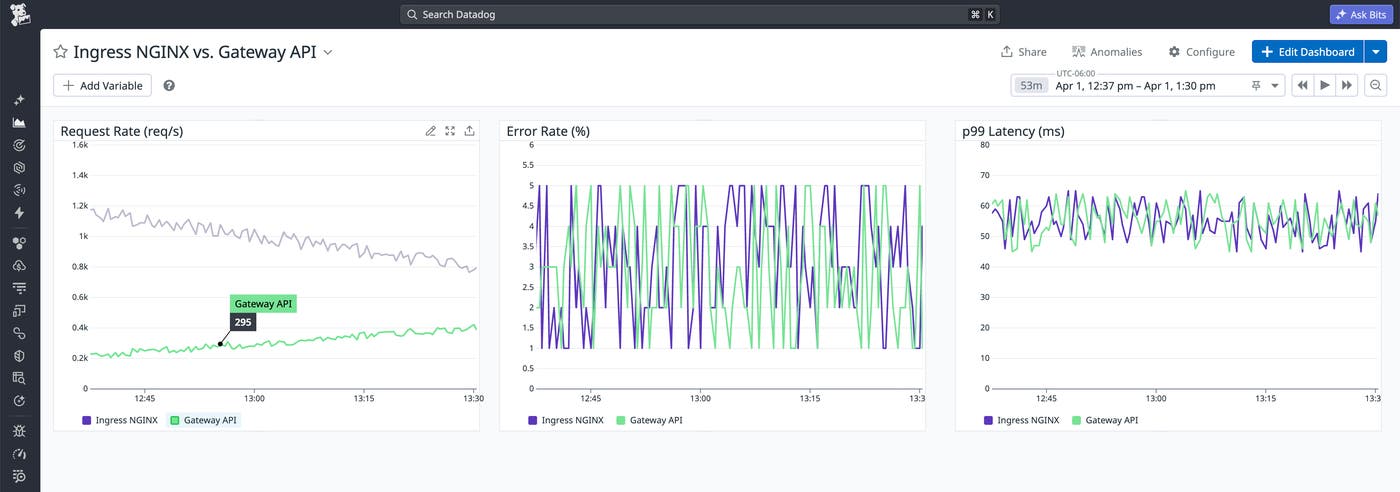
This side-by-side view makes it easy to confirm that the Gateway configuration is tracking your baseline. It also enables you to spot regressions quickly so you can roll back if necessary to correct any issues before finalizing the shift.
Many Gateway API controllers expose Prometheus-formatted metrics. You can use the Datadog OpenMetrics check to ingest and visualize Gateway metrics such as request volume and latency in the same dashboard as your Ingress NGINX data. Datadog also offers integrations for Gateway API-compliant controllers including Envoy, NGINX, and Istio. You can use these integrations to collect standard traffic and performance metrics and then supplement them with OpenMetrics for Gateway-specific signals.
If dashboard metrics indicate that traffic is behaving differently under the new Gateway API architecture, Datadog APM can help you pinpoint the source. By comparing end-to-end traces before and after a rollout step, you can determine whether latency is increasing at the edge or within backend services, such as from slower downstream calls or resource saturation.
To keep the transition safe, pair your dashboard and trace-based monitoring with guardrails like service level objectives (SLOs), anomaly detection, and topology views. Datadog SLOs let you express your performance targets in terms of the baseline you captured from Ingress NGINX. If performance degrades relative to that baseline, SLO alerts provide an immediate signal to pause or halt the rollout rather than waiting for users to report symptoms.
Watchdog complements this by surfacing anomalies in error rates and response codes during the shift. This includes silent regressions, such as a subtle spike in 4xx errors, that can indicate a mismatch in hostname or path-matching rules (for example, due to an unexpected host/path condition or routing default).
Finally, migrations often fail in ways that look like application bugs but are actually traffic-flow problems. Topology views such as the Network Map can surface these issues and help you verify that traffic is flowing where you think it is. By visualizing traffic across the Gateway API layer, you can confirm that requests are reaching the intended backend services and quickly surface any misroutes that arise during the cutover.
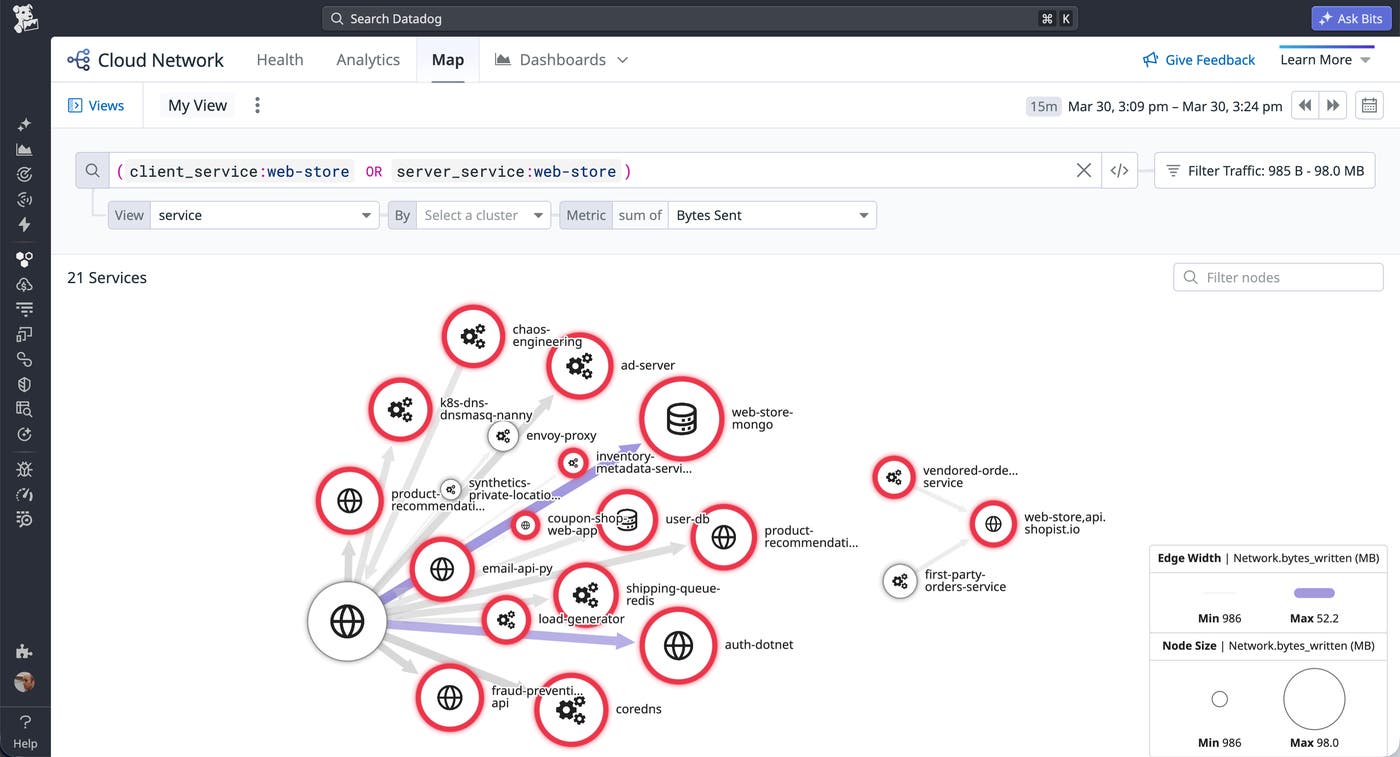
Using the Network Map is also a practical way to validate complex routing configurations, such as traffic flows that use BackendRefs to route across namespace boundaries. By linking the affected services to entries in the Software Catalog, you can use Universal Service Monitoring (USM) to visualize service and infrastructure health and connect those signals to the teams that own those services. This makes it easier to route downstream symptoms from a networking change to the right owners quickly.
Operating and managing your Gateway API setup requires a clear understanding of how routing, policies, and ownership are structured. In this section, we’ll look at some of the advanced routing capabilities that Gateway API enables, the resources that shape that behavior, and the organizational roles that manage those resources.
Gateway API moves beyond the legacy API’s simple HTTP path matching to provide flexible support for advanced routing behaviors. Each controller’s exact behavior depends on its level of conformance and feature support, but common capabilities include:
Traffic splitting: Enables canary and blue/green deployments for controllers that implement weighted BackendRefs.
Hostname matching: Lets you specify hostnames directly in Route resources, making hostname management explicit and application-oriented (subject to any constraints enforced by the Gateway and controller).
Header-based routing: Supports matching requests on headers (such as cookies, user agents, or custom headers) to route traffic based on application-specific signals.
Multi-protocol routing: Includes Route types beyond HTTP, including gRPC, and can support long-lived connections used by workloads like AI inference and data streaming, depending on the controller and environment.
Layer 4 and Layer 7 control: Supports L7 behaviors (such as URL rewrites via filters) and L4 routing (for example, TCP and UDP), though availability varies by controller and Route type.
Cross-namespace sharing: Provides explicit controls for attaching Routes and referencing backends across namespaces, enabling a single entry point to serve multiple application namespaces.
Beyond these core routing mechanics, Gateway API is extensible. Cluster operators can enhance the behavior of their controller by attaching policies to the routing logic to define operational requirements such as audit logging, rate limiting, retries, web application firewalls (WAFs), and timeouts. Guardrails like these enact cluster-level constraints that are automatically inherited by each application to ensure cluster-wide governance and security.
Gateway API’s routing capabilities are shaped by its role-oriented design. Ingress NGINX used a single object to express both infrastructure and application concerns. This forced cluster administrators and application developers to share responsibility for the same resource, which frequently led to conflicting priorities. But Gateway core resources are each owned and managed separately by relevant teams:
GatewayClass: Infrastructure providers (such as your cloud provider) create and maintain GatewayClass resources, each of which represents a supported Gateway implementation for the cluster. Application developers typically consume a GatewayClass indirectly through the Gateways built on it.
Gateway: Cluster operators create and manage these resources to configure shared entry points for traffic and define attachment constraints that control which Routes can bind. This makes the Gateway the boundary between platform control and application routing.
Route: Application developers create and manage these resources to define routing rules that shape the behavior of their applications. Route resources such as HTTPRoute and GRPCRoute let app teams independently control canary rollouts, blue/green deployments, and other routing behaviors.
The following YAML shows a Gateway that a cluster operator can use to define a shared entry point and limit Route attachment to namespaces labeled shared-gateway-access: "true":
apiVersion: gateway.networking.k8s.io/v1
kind: Gateway
metadata:
name: shared-web
namespace: infra-ingress
spec:
gatewayClassName: nginx
listeners:
- name: http
port: 80
protocol: HTTP
allowedRoutes:
namespaces:
from: Selector # Limit which namespaces can attach Routes
selector:
matchLabels:
shared-gateway-access: "true"
The next code sample shows an HTTPRoute that an application developer can attach to that Gateway to define hostname-, path-, and backend-specific routing for one application.
apiVersion: gateway.networking.k8s.io/v1
kind: HTTPRoute
metadata:
name: api-route
namespace: dev-team-a
spec:
parentRefs:
- name: shared-web
namespace: infra-ingress
sectionName: http
hostnames:
- api.example.com
rules:
- matches:
- path:
type: PathPrefix
value: /api
backendRefs:
- name: api-service
port: 8080
Because the Route is created in an application namespace, it can attach only if that namespace satisfies the Gateway’s attachment policy.
An effect of Gateway API’s role-orientation is the need to implement these roles organizationally. When you migrate, cluster operators and application development teams take on distinct new responsibilities for managing routing. While this shift requires thoughtful coordination as teams navigate the transition, it ultimately replaces the shared responsibility model of Ingress NGINX with clear operational boundaries. The migration is more than an infrastructure swap because it comes with organizational change, RBAC updates, and explicit coordination with multiple teams.
Migrating from Ingress NGINX to Kubernetes Gateway API is necessary to ensure the security of your clusters. It is also a chance to replace a feature-frozen ingress model with one built for modern, multi-team Kubernetes environments. A structured approach reduces the risk of regressions and gives your team a clear path to a working state by combining incremental configuration, pre-shift validation, and continuous monitoring.
Datadog Notebooks, dashboards, SLOs, Watchdog, and the Network Map give you the visibility to confirm that performance holds as traffic shifts and to roll back quickly if it doesn’t. For next steps, see the Kubernetes Gateway API documentation and the Ingress2Gateway migration tool.
To monitor your Gateway API migration in real time, sign up for a 14-day free trial.
此内容由惯性聚合(RSS阅读器)自动聚合整理,仅供阅读参考。 原文来自 — 版权归原作者所有。