


Jason Moiron @jmoiron is a Datadog Software Engineer and runs his own blog where this blog was originally posted. We’re thrilled that Jason gave us the opportunity to share his post with the Datadog community.
The last few months I’ve had the pleasure of working on a new bit of intake processing at Datadog. It was our first production service written in Go, and I wanted to nail the performance of a few vital consumer, processing, and scheduling idioms that would form the basis for future projects. I wrote a lot of benchmarks and spent a lot of time examining profile output, learning new things about Go, and relearning old things about programming. Although using intuition can be a flawed approach to achieving good performance, learning why you get certain behaviors usually proves valuable. I wanted to share a few of the things I’ve learned.
Our new service was designed to manage indexes which track how recently metrics, hosts, and tags have been used by a customer. These indexes are used on the front-end for overview pages and auto-completion. By taking this burden off of the main intake processor, we could free it up for its other tasks, and add more indexes to speed up other parts of the site.
This stateful processor would keep a history of all the metrics we’ve seen recently. If a data point coming off the queue was not in the history, it’d be flushed to the indexes quickly to ensure that new hosts and metrics would appear on site as soon as possible. If it was in the history, then it was likely already in the indexes, and it could be put in a cache to be flushed much less frequently. This approach would maintain low latency for new data points while drastically reducing the number of duplicate writes.
We started out using a map[string]struct{} to implement these histories and caches. Although our metric names are generally hierarchical, and patricia tries/radix trees seemed a perfect fit, I couldn’t find nor build one that could compete with Go’s map implementation, even for sets on the order of tens of millions of elements. Comparing lots of substrings as you traverse the tree kills its lookup performance compared to the hash, and memory-wise, 8-byte pointers mean you need pretty large matching substrings to save space over a map. It was also trickier to expire entries to keep memory usage bounded.
Even with maps, we were still not seeing the types of throughput I thought we could achieve with Go. Map operations were prominent in our profiles. Could we get any more performance out of them? All of our existing indexes were based on string data which had associated integer IDs in our backend, so I benchmarked the insert/hashing performance for maps with integer keys and maps with string keys:
BenchmarkTypedSetStrings 1000000 1393 ns/op
BenchmarkTypedSetInts 10000000 275 ns/op
This looked pretty promising. Since the data points coming from the queue were already normalized to their IDs, we had the integers available for use as map keys without having to do extra work. Using a map[int]*Metric instead of a map[string]struct{} would give us that integer key we knew would be faster while keeping access to the strings we needed for the indexes. Indeed, it was much faster: the overall throughput doubled.
Eventually, we wanted to add new indexes which track recently seen “apps”. This concept is based on some ad-hoc structure in the metric names themselves, which generally looked like “app.throughput” or “app.latency”. We had associated backend IDs for apps, so we restored the string-keyed map for them, and overall throughput dropped like a stone. Predictably, the string map assignment in the app history, which we already knew to be slow, was to blame:
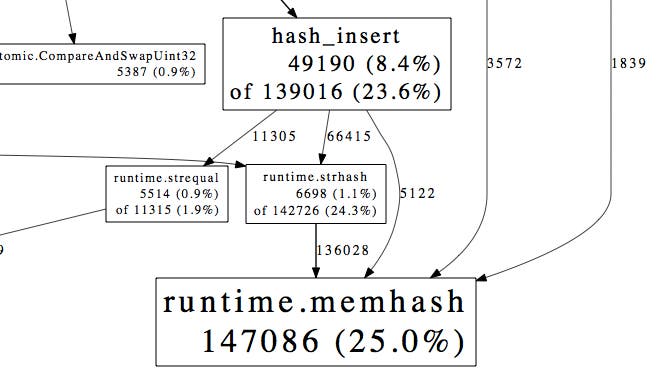
In fact, the runtime ·strhash → runtime ·memhash path dominated the output, using more time than all other integer hashing and all of our channel communication. This is illustrated proof, if proof were needed, that one should prefer structs to maps wherever a simple collection of named values is required.
Still, the strhash performance here seemed pretty bad. How did hashing take up so much more time under heavy insertion than all other map overhead? These were not large keys. When I asked about improving string hash performance in \#go-nuts, someone tipped me off to the fact that since Go 1.1, runtime ·memhash has a fast-path that uses the AES-NI processor extensions.
A quick grep aes /proc/cpuinfo showed that the aws c1.xlarge box I was on lacked these. After finding another machine in the same class with them, throughput increased by 50-65% and strhash’s prominence was drastically reduced in the profiles.
Note that the string vs int profiles on sets above was done on a machine without the AES-NI support. It goes without saying that these extensions would bring those results closer together.
The queue we read from sends messages which contain many individual metrics; in Go terms you can think of a message like type Message []Metric, where the length is fairly variable. I made the decision early on to standardize our unit of channel communication on the single metric, as they are all the same size on the wire. This allowed for much more predictable memory usage and simple, stateless processing code. As the program started to come together, I gave it a test run on the production firehose, and the performance wasn’t satisfactory. Profiling showed a lot of time spent in the atomic ASM wrapper runtime ·xchg (shown below) and runtime ·futex.
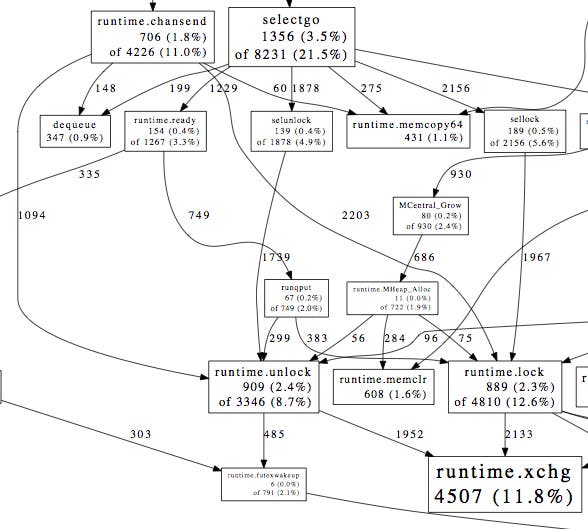
These atomics are used in various places by the runtime: the memory allocator, GC, scheduler, locks, semaphores, et al. In our profile, they were mostly descendent from runtime ·chansend and selectgo, which are part of Go’s channel implementation. The performance problem was due to lots of locking and unlocking in the buffered channel implementation.
While channels provide powerful concurrency semantics, their parallelized implementation is not magic. Most paths for sending, receiving, and selecting on async channels currently involve locking; though their semantics combined with goroutines change the game, as a data structure they’re exactly like many other implementations of synchronized queues/ring buffers. There is an ongoing effort to improve channel performance, but this isn’t going to result in an entirely lock free implementation.
Today, sending or receiving calls runtime ·lock on that channel shortly after establishing that it isn’t nil. Though the channel performance overhaul work being done by Dmitry looks promising, even more exciting for future Go performance improvements is his proposal for atomic intrinsics, which could reduce some overhead to all of these atomic locking primitives throughout the runtime. At this time, it looks likely to miss 1.3, but will hopefully be revisited for 1.4.
My decision to send metrics one by one meant that we were sending, receiving, and selecting more often than necessary, locking and unlocking many times per message. Although it added some extra complexity in the form of looping in our metric processing code, re-standardizing on passing messages instead reduced the amount of these locking sends and reads so much that they virtually dropped off our subsequent profiles. Throughput improved by nearly 6x.
One of the sources of slowness that I expected before joining the project was Go’s implementation of zlib. I’d done some testing in the past that showed it was significantly slower than Python’s for a number of file sizes that covered the typical sizes of our messages. The zlib C implementation has a reputation for being well optimized, and when I discovered that Intel had contributed a number of patches to it quite recently, I was interested to see how it would measure up.
Luckily, the vitess project from YouTube had already implemented a really nice Go wrapper named cgzip, which performed quite a bit better than Go’s gzip in my testing. Still, it was outperformed by Python’s gzip, which puzzled me. I dove into the code of both Python’s zlibmodule.c and cgzip’s reader.go, and noticed that cgzip was managing its buffers from Go while Python was managing them entirely in C.
I’d vaguely remembered some experiments that showed there was a bit of overhead to cgo calls. Further research revealed some reasons for this overhead:
Similar to communicating via channels above, the communication between Go function calls and C function calls was taxed. If I wanted to find more performance, I’d have to reduce the amount of communication by increasing the amount of work done per call. Because of the channel changes, entire messages were now the smallest processable unit in my pipeline, so the undoubtable benefits of a streaming gzip reader were relatively diminished. I used Python’s zlibmodule.c as a template to do all of the buffer handling in C, returning a raw char * I could copy into a []byte on the Go side, and did some profiling:
452 byte test payload (1071 orig)
BenchmarkUnsafeDecompress 200000 9509 ns/op
BenchmarkFzlibDecompress 200000 10302 ns/op
BenchmarkCzlibDecompress 100000 26893 ns/op
BenchmarkZlibDecompress 50000 46063 ns/op
7327 byte test payload (99963 orig)
BenchmarkUnsafeDecompress 10000 198391 ns/op
BenchmarkFzlibDecompress 10000 244449 ns/op
BenchmarkCzlibDecompress 10000 276357 ns/op
BenchmarkZlibDecompress 5000 495731 ns/op
359925 byte test payload (410523 orig)
BenchmarkUnsafeDecompress 1000 1527395 ns/op
BenchmarkFzlibDecompress 1000 1583300 ns/op
BenchmarkCzlibDecompress 1000 1885128 ns/op
BenchmarkZlibDecompress 200 7779899 ns/op
Above, “Fzlib” is my “pure-C” implementation of zlib for Go, “Unsafe” is a version of this where the final copy to []byte is skipped but the underlying memory of the result must be manually freed, “Czlib” is vitess’ cgzip library modified to handle zlib instead of gzip, and “Zlib” is Go’s built-in library.
In the end, the differences for fzlib and czlib were only notable on small messages. This was one of the few times I optimized prior to profiling, and it produced some of the least important performance gains. As you can see below, when at full capacity, the message processing code cannot keep up with the intake and parsing code, and the post-parsed queue stays full while the post-processed channel maintains some capacity.
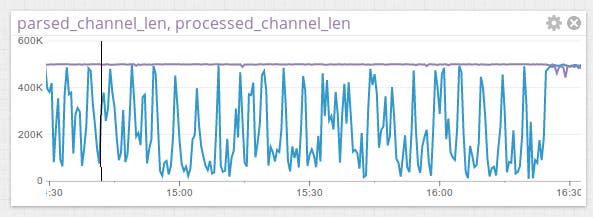
You might think the obvious lesson to learn from this is that age old nut about premature optimization, but this chart taught me something far more interesting. The concurrency and communication primitives you get in Go allow you to build single-process programs in the same style you’d use when building distributed systems, with goroutines as your processes, channels your sockets, and select completing the picture. You can then measure ongoing performance using the same well understood techniques, tracking throughput and latency incredibly easily.
Seeing this pattern of expensive boundary crossing twice in quick succession impressed upon me the importance of identifying it quickly when investigating performance problems. I also learned quite a lot about cgo and its performance characteristics, which might save me from ill-fated adventures later on. I also learned quite a lot about Python’s zlib module, including some pathological memory allocation in its compression buffer handling.
The tools you have at your disposal to get the most performance out of Go are very good. The included benchmarking facilities in the testing library are simple but effective. The sampling profiler is low impact enough to be turned on in production and its associated tools (like the chart output above) highlight issues in your code with great clarity. The architectural idioms that feel natural in Go lend themselves to easy measurement. The source for the runtime is available, clean, and straightforward, and when you finally understand your performance issues, the language itself is amenable to fixing them.
If you’re interested in learning about how Datadog can turn the massive amounts of data produced by your apps, tools and services into actionable insight, you can try it for free.
We’ll be at GopherCon 2014 next week so swing by our booth and say hello!
此内容由惯性聚合(RSS阅读器)自动聚合整理,仅供阅读参考。 原文来自 — 版权归原作者所有。