


As your IT environment scales, a proactive approach to monitoring becomes increasingly critical. If your infrastructure environment contains multiple service dependencies, disparate systems, or a busy CI/CD application delivery pipeline, overlooked anomalies can result in a domino effect that leads to unplanned downtime and an adverse impact on users.
Datadog applies the principles of AIOps to our products to help you optimize your IT operations. AIOps is a discipline that combines big data and machine learning to automate IT operations processes, including event correlation, anomaly detection, and causality determination. By incorporating AIOps into our monitoring solutions, Datadog enables you to proactively detect issues across your entire technology stack, reduce time spent on investigating and resolving issues, consolidate related alerts to minimize noise, build automated troubleshooting workflows, and more.
In this post, we’ll focus on a core component of AIOps at Datadog, proactive anomaly detection. Proactive anomaly detection enables you to pinpoint issues early, before they become full-blown incidents. Datadog AIOps helps you:
Use machine learning algorithms that allow you to scale anomaly detection
Automate anomaly detection, outlier detection, and forecasting across your infrastructure with Watchdog
Customize anomaly detection, outlier detection, and forecasting alerts that are uniquely tailored to your environment with Datadog monitors
Preventing incidents is the most efficient way to consistently meet SLOs, improve reliability, prioritize security, and reinforce organizational trust. Datadog’s integrated AIOps approach includes built-in machine learning (ML) algorithms that enable you to proactively address issues before they become incidents with early anomaly detection, early outlier detection, and forecasting capabilities.
In essence, anomaly detection involves examining a set of data points to identify if and when a data point deviates significantly from the established baseline of typical behavior. Anomalies can indicate that severe issues—such as security breaches, infrastructure failures, or fraudulent activity—are threatening your production environment, potentially leading to revenue loss and sensitive data leaks.
As your IT environment generates more and more data, it quickly becomes inefficient to detect anomalies manually. Manual anomaly detection is a tedious and laborious process, requiring you to review large datasets and analyze any data points that deviate from normal behavior. Relying on ML algorithms can help you scale proactive anomaly detection effectively. Datadog’s three ML algorithms—Basic, Agile, and Robust—enable you to identify anomalies early so you can take action to prevent incidents.
When configuring custom alerts with Datadog monitors, you can choose which algorithm you want to use. We’ll discuss each algorithm in detail below to help you determine which best suits your use case.
The Basic algorithm is the simplest form of anomaly detection. It quickly adjusts to changing trends but doesn’t account for seasonal or recurring patterns, like day-of-week or time-of-day effects. Instead, it relies on a rolling window to calculate the quantiles of historical data. The Basic algorithm works best with unpredictable metrics where trends don’t align with time or day cycles. If your system experiences sudden spikes or drops in application latency, error rates, or resource usage, the Basic algorithm will detect the change as an anomaly. The Basic algorithm is also helpful for metrics with limited historical data, like a new service you’ve just deployed.
Since the Basic algorithm can handle rapid changes, it can alert on new patterns that emerge early in a service’s lifecycle. For example, let’s say you’re monitoring the error rate of a new microservice, where there is no established history to indicate seasonal trends. The Basic algorithm would adjust quickly if error rates suddenly spiked, even without long-term historical context.
The Agile algorithm is best suited for metrics with seasonal patterns that may shift over time. It uses a version of the seasonal autoregressive integrated moving average algorithm, known as SARIMA. The Agile algorithm is sensitive to seasonality, such as daily or weekly fluctuations, but also responds quickly to unexpected shifts or trends, like a step change or baseline level shift in traffic or activity. For example, if a news website experiences traffic spikes during major events, the Agile algorithm will quickly adapt to these new traffic levels as the baseline. It will still identify any significant deviations from this updated baseline, such as sudden dips or peaks, as anomalies.
The Robust algorithm is designed for metrics with stable, recurring seasonal patterns. It adjusts slowly to sudden changes, which reduces the false-positive alerts that can occur from short-term spikes or noise. It uses seasonal-trend decomposition to identify underlying patterns and anomalies, focusing on long-term stability.
If you have a metric with well-established daily or weekly patterns and expect it to remain stable, the Robust algorithm is the ideal choice. It will filter out short-term noise and only flag true anomalies that deviate from the longer-term pattern. For example, let’s say you’re monitoring database query times, where load typically follows a strong weekly pattern with minimal variability. The Robust algorithm won’t be affected by brief anomalies, such as temporary network issues, but will alert you if there’s a sustained deviation from expected query performance.
Datadog already enables you to proactively address issues before they become incidents with Watchdog. Watchdog is an AI-powered engine that uses our ML algorithms to automatically flag anomalies and outliers, forecast potential bottlenecks, conduct automated business impact analysis and root cause analysis (RCA), and detect faulty code deployments.
Now, Watchdog goes even further, notifying you when your third-party services are experiencing an outage or degradation that might be affecting your environment. Watchdog’s new feature informs you of the outage’s details and provides you with troubleshooting context directly in the Datadog app. Being notified promptly and understanding the extent of an outage helps you determine whether your services are experiencing performance issues due to an external dependency.
For example, let’s say that you’re using Argo Workflows, a Kubernetes workflow engine, to orchestrate and automate infrastructure processes across your organization. Argo Workflows executes parallel jobs on your behalf, creating cloud accounts, reallocating workloads, and provisioning new Kubernetes resources whenever necessary. When you receive a notification that your Kubernetes containers are nearing capacity, you begin to investigate to see why Argo Workflows hasn’t automatically provisioned additional resources.
Because you monitor your infrastructure with Datadog, the notification’s embedded links lead you to the Watchdog Alerts page in the Datadog application. Watchdog displays a banner at the top of the alert that informs you of a cloud service provider outage. This cloud service provider hosts all of your Kubernetes resources, including Argo Workflows. Instead of wasting time troubleshooting Argo Workflows, you pivot directly from the Datadog app to the cloud service provider’s status page so you can follow the latest updates.
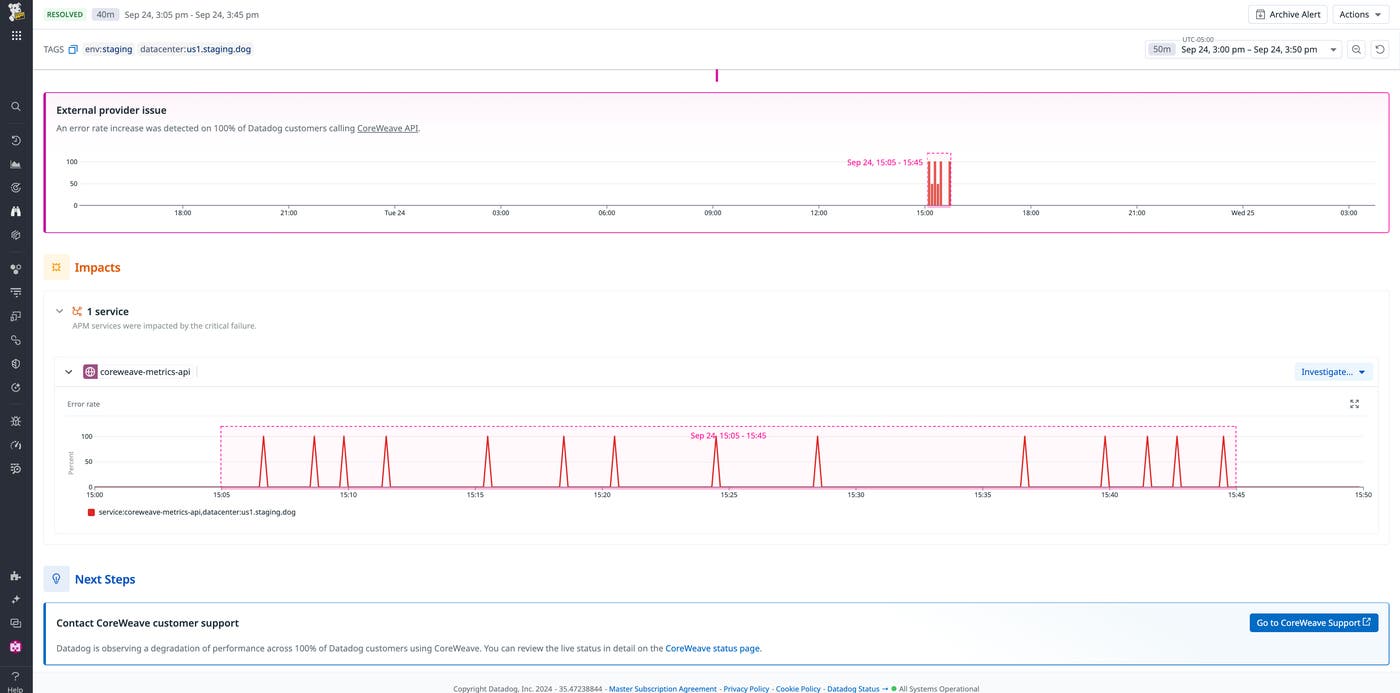
Watchdog requires no configuration or setup, and conveniently allows you to convert any Watchdog Alert into a monitor so you can add tags, specify which stakeholders receive notifications, and more. Each Watchdog monitor notification contains insightful information derived from Watchdog’s continuous monitoring of your environment, prompting you to take actionable steps that reduce the risk of “firefighting” or learning about issues from your customers.
Datadog enables you to customize anomaly, forecast, and outlier alerts that use our ML algorithms. Unlike monitoring systems that operate in a black box, Datadog monitors allow you to configure custom alerts based on your chosen metrics. Monitors can trigger based on severity, anomaly type, impact, or other specified conditions.
For example, let’s say you work for a financial services company that handles sensitive customer data. Because of the significant adverse impact that customers would experience in the case of a security breach, you create a custom anomaly monitor that notifies you if there is an abnormal amount of logins on the system that stores restricted and high-risk datasets, allowing you to intervene quickly and take appropriate action before a security breach or data leak.
Before you configure a custom alert, or if you’re reviewing an existing alert, you must evaluate whether your chosen query metric is suitable for anomaly detection and whether the alerting window is accurate. There are a few considerations that can help you determine the query metric’s suitability and the alerting window’s accuracy, including:
Regularity, which describes whether the metric’s behavior is predictable.
Historical data, in the case of seasonality, ensures that the metric has enough historical data to form an accurate baseline.
Density, which verifies that there are at least five data points in the alerting window.
Bounds, which are the upper and lower limits of the metric’s predicted range, should reasonably follow the query metric’s actual value over the duration of the alerting window.
We’ll dive into each of these considerations next.
If a metric repeats itself at some daily or weekly cadence (e.g., it looks similar every Tuesday) or experiences a drift (such as a linear increase with slight fluctuations), it is a viable candidate for anomaly detection. If the metric’s pattern changes often (e.g., every 3-4 seasons, there is a new “normal”), then the metric is likely not a good candidate for anomaly detection. Essentially, if a human has trouble drawing what they expect the query metric’s near future to look like, then anomaly detection won’t be able to do so either.
If the metric experiences seasonality, the algorithm needs enough historical data to learn what’s normal and establish a baseline. If enough metric values deviate from the baseline, the monitor triggers an alert or warning. In the case of seasonality, we recommend having at least three seasons of data available, so for “weekly seasonality,” this equates to three weeks of data. The anomaly detection quality will improve as the number of seasons gets closer to the maximum of six seasons.
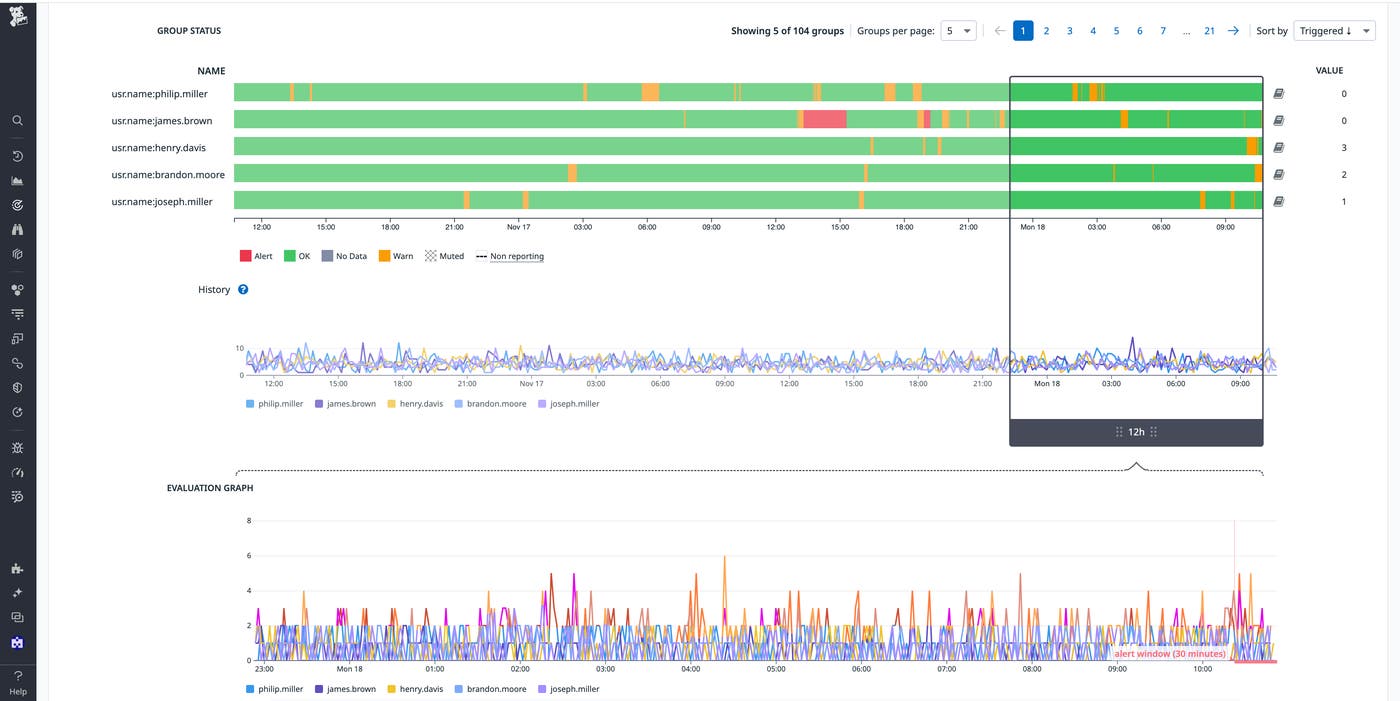
Density ensures that enough data points are available in the alerting window to establish a baseline. The “alerting window” is the part of the evaluation window used to trigger the alert, like if you set the alert to trigger when the metric has been above or below the bounds for a certain amount of time. For some monitors, the alerting window can be the entire evaluation window.
Anomaly detection looks at the alerting window and compares the observed metric values to the expected values based on the algorithmic model, and if the deviation is big enough, reports an anomaly. If the algorithm doesn’t have enough data in the alerting window, the monitor can be strongly impacted by only one or two data points, making results unstable and leading to false-positive alerts. Therefore, we recommend that you have at least five data points in the alerting window.
A common misconception is that to be alerted early enough to prevent an incident, you have to change the alerting window from the default of 15 minutes to 10 or 5 minutes. For sparse metrics (particularly count metrics), this can result in insufficient data points in the alerting window, leading to inaccurate alerting.
The bounds shape indicates whether the algorithm can model the metric pattern correctly. It should follow the metric values and highlight points that are considered abnormal.
In the case of sparse count metrics, the bound parameters may be large enough to include zero. Since users often want to detect sudden drops, this suggests that the metric is too sparse for the current interval selection and alerting window, necessitating an increase in both.
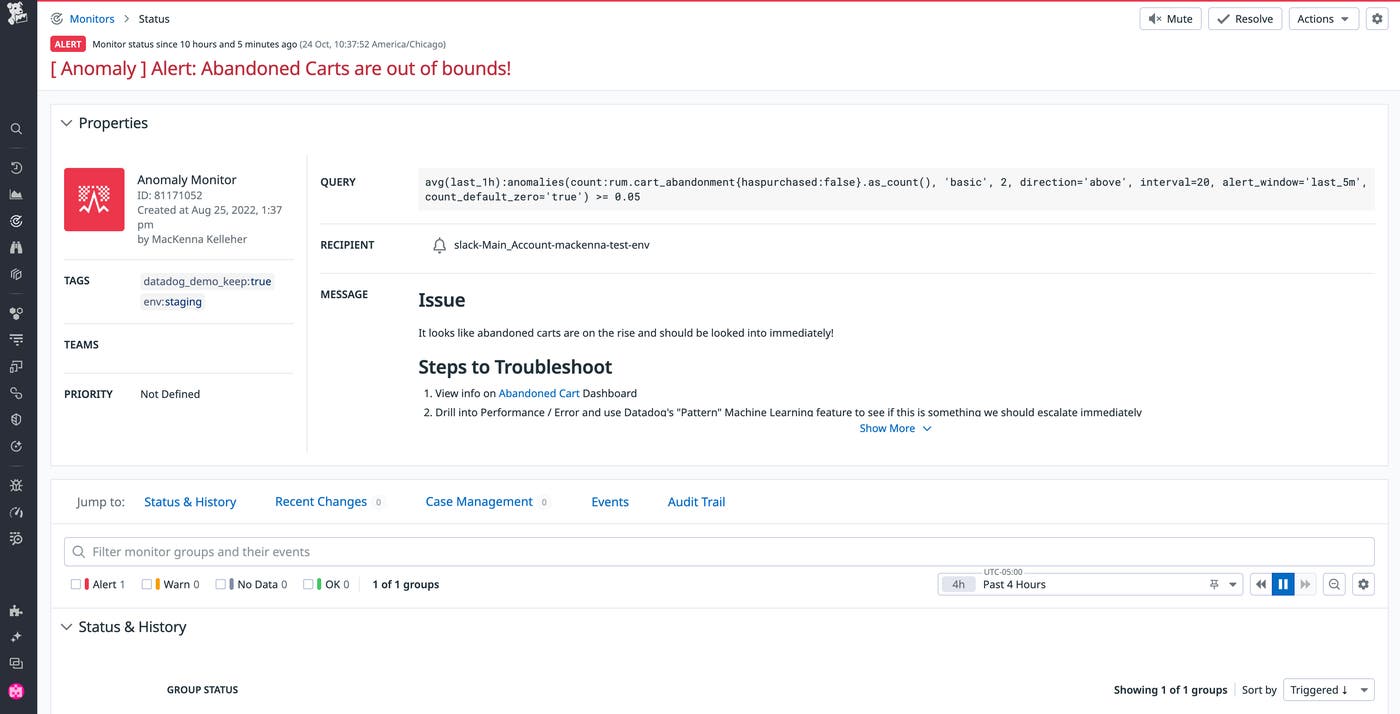
When reviewing the bounds, a helpful question to ask is: “What percentage would I allow the metric to deviate from the normal baseline before considering it an anomaly?” For example, if you are comfortable with a 20 percent deviation, ensure that the values in the bounds remain within +/- 20 percent of the baseline value.
If you’re conducting a periodic review of your monitoring system, receiving false positive alarms or redundant alerts, or experiencing alert fatigue, you may need to fine-tune your alert settings to strengthen the alert. You can take preventative measures to minimize the opportunity for alert fatigue and reduce the occurrence of alert storms.
Datadog AIOps enables you to proactively detect anomalies using Watchdog and custom alerts so that you can address issues before they become incidents, prevent unplanned downtime, and protect your environment. In this post, we’ve discussed the machine learning algorithms that Datadog uses for proactive anomaly detection, outlier detection, and forecasting, and how you can use the technology embedded in these algorithms with Watchdog out-of-the-box or by customizing your own alerts with Datadog monitors. To learn more, visit our Watchdog or Datadog monitors documentation.
If you’re new to Datadog and want us to be a part of your monitoring strategy, you can get started now with a free trial.
此内容由惯性聚合(RSS阅读器)自动聚合整理,仅供阅读参考。 原文来自 — 版权归原作者所有。