
惯性聚合 高效追踪和阅读你感兴趣的博客、新闻、科技资讯
阅读原文 在惯性聚合中打开

推荐订阅源

Y
Y Combinator Blog
The GitHub Blog
The GitHub Blog
Vercel News
Vercel News
D
DataBreaches.Net
MongoDB | Blog
MongoDB | Blog
H
Help Net Security
小众软件
小众软件
美团技术团队
T
The Blog of Author Tim Ferriss
爱范儿
爱范儿
D
Docker
Martin Fowler
Martin Fowler
大猫的无限游戏
大猫的无限游戏
博客园 - 聂微东
Blog — PlanetScale
Blog — PlanetScale
H
Hackread – Cybersecurity News, Data Breaches, AI and More
罗磊的独立博客
OSCHINA 社区最新新闻
OSCHINA 社区最新新闻
V
V2EX
S
SegmentFault 最新的问题
云风的 BLOG
云风的 BLOG
B
Blog
雷峰网
雷峰网
The Cloudflare Blog

Datadog | The Monitor blog

Introducing our open source AI-native SAST Instrument and monitor Boomi integration flows with OpenTelemetry and Datadog Not all index scans are equal: How we cut query latency by over 99% Platform engineering metrics: What to measure and what to ignore Integrate Recorded Future threat intelligence with Datadog Cloud SIEM CI/CD security: threat modeling using a MITRE-style threat matrix CI/CD security: How to secure your GitHub ecosystem Ingress NGINX is EOL: A practical guide for migrating to Kubernetes Gateway API Operating agentic AI with Amazon Bedrock AgentCore and Datadog LLM Observability: Lessons from NTT DATA Introducing the Datadog Code Security MCP Capture and analyze custom heatmaps in Session Replay Understand session replays faster with AI summaries and smart chapters Monitor ClickHouse query performance with Datadog Database Monitoring How we designed empathetic alert sounds for on-call engineers Search and act across Datadog to resolve issues faster with Bits Assistant Measure the business impact of every product change with Datadog Experiments Analyzing round trip query latency Configuring JavaScript caches for better performance Introducing Bits AI Dev Agent for Code Security Datadog achieves ISO 42001 certification for responsible AI Monitor Nutanix clusters, hosts, and VMs with Datadog Monitor Juniper Mist in Datadog A new Host Map for modern infrastructure Annotate traces to improve LLM quality with Datadog LLM Observability What’s new in Cloud SIEM: AI-powered investigations, enhanced threat intelligence, and scalable security operations Explore Kubernetes with native OpenTelemetry data Monitor Oracle Fusion Cloud Applications with Datadog Announcing the Datadog Terraform provider v4.0.0 Scaling Kubernetes workloads on custom metrics How to design cloud environments for AI-powered threat analysis
Introducing availability monitoring for Windows Services
Remi Hakim · 2015-03-02 · via Datadog | The Monitor blog

Today we’re pleased to announce that we’ve added Windows Service checks to Datadog, available in Datadog Agent 5.2. Services are a core component of Windows and are responsible for spawning processes required for the OS and third-party applications to operate. By configuring checks for your Windows Services you’ll have full visibility into their availability status (up or down) and can get notifications when a service stops running. The Datadog Windows Service integration supports both native services such as Windows Remote Management and Windows Task Scheduler along with applications like MS Exchange, MS SQL, or third-party services.

Monitor your Windows Services

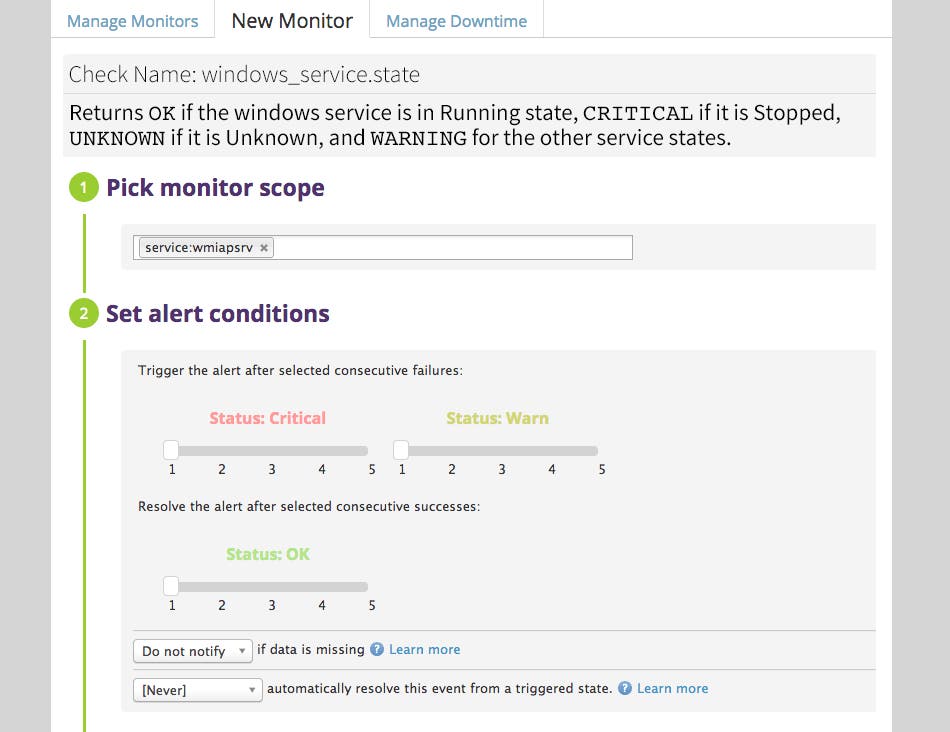
Once Windows Service checks have been configured in the Datadog Agent, they can be used to build Monitors for notification purposes. You can create Monitors that fire only after a certain number of service checks fail, if a service is in a specific state after a certain number of checks, or based on a simple up/down check.

Monitor Availability of Windows Services

Avoid noisy alerts

For example, consider a service that sometimes reports transient failures but usually recovers on its own. You might only want to be notified if the service is shown as down for three consecutive checks.
Monitor Availability of Windows Services

Notify your team

Alerts related to Windows Service checks, like others generated by Datadog, can be emailed directly to your team, forwarded through one of our many third-party integrations such as PagerDuty, or posted to chat services such as Slack.

Unified monitoring for windows applications

With the addition of this new Datadog integration, users gain a holistic view of their servers and applications for all critical Windows components:

If you’re already a Datadog customer, get started with the integration here. To try out Windows Service checks for your own environment, sign up for a 14-day free trial of Datadog.