


When an application in a Docker container emits logs, they are sent to the application’s stdout and stderr output streams. The container’s logging driver can access these streams and send the logs to a file, a log collector running on the host, or a log management service endpoint. In this post, we’ll explain how the driver you choose—and how you configure it—influences the performance of your containerized application and the reliability of your Docker logging. We’ll show you how to configure your containers to use your desired logging driver. Finally, we’ll recommend driver configurations that are most likely to meet your performance and logging requirements.
Docker comes with several built-in logging drivers. The driver you choose determines how your containers format their logs and where they send them. You can apply any one of the available drivers to each container you create.
By default, Docker uses the json-file driver, which writes JSON-formatted logs to a container-specific file on the host where the container is running. The example below shows JSON logs created by the hello-world Docker image using the json-file driver:
{"log":"Hello from Docker!\n","stream":"stdout","time":"2020-01-09T22:51:31.549390877Z"}
{"log":"This message shows that your installation appears to be working correctly.\n","stream":"stdout","time":"2020-01-09T22:51:31.549396749Z"}
The local logging driver also writes logs to a local file, compressing them to save space on the disk.
Docker also provides built-in drivers for forwarding logs to various endpoints. This includes sending them to a logging service like syslog or journald, a log shipper like fluentd, or to a centralized log management service.
Additionally, Docker supports logging driver plugins. This allows you to create your own logging drivers and distribute them via Docker Hub or a private container registry. You can also implement any of the community-provided plugins available on Docker Hub.
If you need to review a container’s logs from the command line, you can use the docker logs <CONTAINER_ID> command. Using this command, the log shown above is displayed this way:
Hello from Docker!
This message shows that your installation appears to be working correctly.
Note that depending on the version of Docker you are using, the logging driver you select can affect your ability to spot check container logs using the docker logs command. If you’re using Docker CE, docker logs can only read logs created by the json-file, local, and journald drivers. If you’re using Docker Enterprise, docker logs can read logs created by any logging driver.
Docker containers use the json-file logging driver by default, and it’s also the driver we recommend for most cases. If your use case requires a different driver, you can override the default by adding the --log-driver option to the docker run command that creates a container. For example, the following command creates an Apache httpd container, overriding the default logging driver to use the fluentd driver instead.
docker run --log-driver fluentd httpd
You can also change the default driver by modifying Docker’s daemon.json file. The code snippet below shows the JSON to add if you want to use fluentd as your default logging driver. We use the log-opts item to pass the address of the fluentd host to the driver:
{
"log-driver": "fluentd",
"log-opts": {
"fluentd-address": "172.31.0.100:24224"
}
}
Once you restart Docker to apply this change, any new containers you create will use the fluentd driver on the cluster node with the address 172.31.0.100.
Regardless of which logging driver you choose, you can configure your container’s logging in either blocking or non-blocking delivery mode. The mode you choose determines how the container prioritizes logging operations relative to its other tasks.
A container in blocking mode—Docker’s default mode—will interrupt the application each time it needs to deliver a message to the driver. This guarantees that all messages will be sent to the driver, but it can have the side effect of introducing latency in the performance of your application: if the logging driver is busy, the container delays the application’s other tasks until it has delivered the message.
The potential effect of blocking mode on the performance of your application depends on which logging driver you choose. For example, the json-file driver writes logs very quickly since it writes to the local file system, so it’s unlikely to block and cause latency. On the other hand, drivers that need to open a connection to a remote server—such as gcplogs and awslogs—are more likely to block for longer periods and could cause noticeable latency.
In non-blocking mode, a container first writes its logs to an in-memory ring buffer, where they’re stored until the logging driver is available to process them. Even if the driver is busy, the container can immediately hand off application output to the ring buffer and resume executing the application. This ensures that a high volume of logging activity won’t affect the performance of the application running in the container.
Non-blocking mode does not guarantee that the logging driver will log all the events, in contrast to blocking mode. If the application emits messages faster than the driver can process them, the ring buffer can run out of space. If this happens, buffered logs will be deleted before they can be handed off to the logging driver. You can use the max-buffer-size option to set the amount of RAM used by the ring buffer. The default value for max-buffer-size is 1 MB, but if you have RAM available, increasing the buffer size can increase the reliability of your container’s logging.
Although blocking mode is Docker’s default for new containers, you can set this to non-blocking mode by adding a log-opts item to Docker’s daemon.json file. The example below extends the previous example, keeping fluentd as the default driver and changing the default mode to non-blocking:
{
"log-driver": "fluentd",
"log-opts": {
"fluentd-address": "172.31.0.100:24224",
"mode": "non-blocking"
}
}
Alternatively, you can set non-blocking mode on an individual container by using the --log-opt option in the command that creates the container:
docker run --log-opt mode=non-blocking httpd
We recommend the json-file logging driver in blocking mode for most use cases. Because it writes to a local file, this driver is fast, so it’s generally safe to use in blocking mode. In this configuration, Docker will be able to capture all of your logs with little risk of degrading the performance of your application.
You can use an agent-based log collector (such as the Datadog Agent) to tail your local log files and forward them to a centralized log management solution. JSON-formatted logs are easy for log management platforms to parse, so you can filter your logs by attribute, detect and alert on log patterns and trends, and analyze the performance of your containerized application.
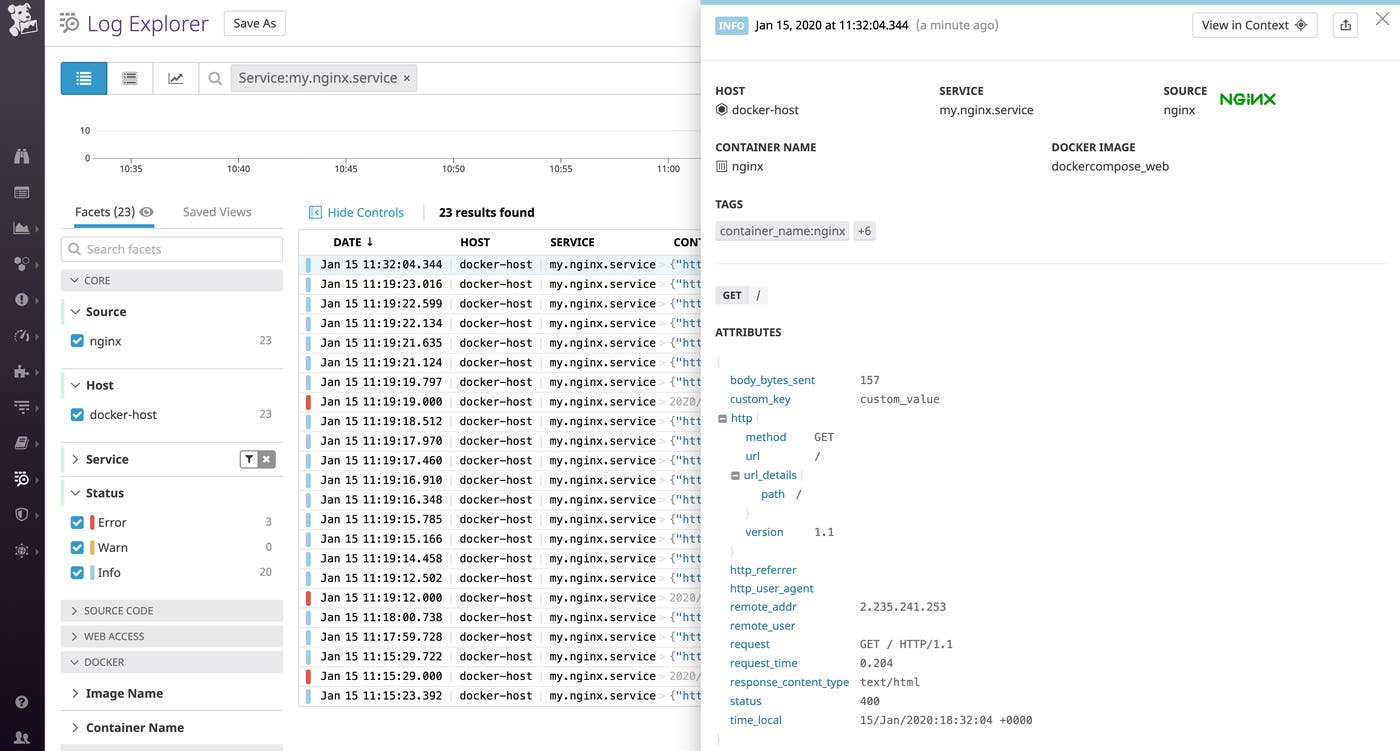
This driver also lets you control each container’s log rotation behavior, which can affect the performance of the containerized application. Setting a small value on the max-size option will cap the growth of the log files, but it also means Docker will rotate logs more often. If activity spikes, Docker may need to dedicate more resources to log rotation when it also needs to serve increasing traffic. If your application has bursts of logging activity due to inconsistent traffic patterns, you should consider increasing max-size to ensure good performance.
Finally, when logging with the json-log driver, you can view these logs using the docker logs command whether you’re using Docker Enterprise or Docker CE.
The json-file driver in blocking mode provides the best combination of application performance and logging reliability for most users. However, there are cases where you may need to consider a different combination of logging driver and delivery mode.
If your application emits a large amount of logs and performs high I/O workloads, consider using the json-file logging driver in non-blocking mode. This configuration maintains the performance of your container’s applications while still giving you reliable structured logging. Writing logs to local storage is quick, so it’s unlikely that the ring buffer will fill up. If your application doesn’t need to support spikes in logging activity (which could fill up the ring buffer), this configuration can capture all of your logs without interrupting your application.
If you can’t create logs locally, you’ll need to use a non-default driver like gcplogs or awslogs to log to a remote destination. For very memory-hungry applications that require the majority of the RAM available to your containers, you should generally use blocking mode. This is because there may not be enough memory available for the ring buffer if the driver cannot deliver logs to its endpoint, for example because of a network problem.
Although using blocking mode will ensure that you capture every log, we generally don’t recommend using a non-default driver in blocking mode because your application’s performance could deteriorate if logging is interrupted. For mission-critical applications that can’t log to the local file system, but where performance is a higher priority than logging reliability, provision enough RAM for a reliable ring buffer and use non-blocking mode. This configuration ensures that your application’s performance does not suffer from a problem with logging, while also providing room to capture the majority of log data.
The Docker logging driver and log delivery mode you choose can have a noticeable effect on the performance of your containerized applications. We recommend using the json-file driver for reliable logging, consistent performance, and better visibility via a centralized logging platform like Datadog. Datadog allows you to filter, analyze, and alert on logs from all your applications. If you’re not already using Datadog, you can start with a free, full-featured 14-day trial.
此内容由惯性聚合(RSS阅读器)自动聚合整理,仅供阅读参考。 原文来自 — 版权归原作者所有。