




Boomi is an Integration Platform as a Service (iPaaS) used by thousands of organizations to connect applications, data, and workflows across cloud and on-premises environments. Business-critical processes, from order fulfillment pipelines to customer data synchronization, depend on Boomi Atoms and Molecules running reliably. Yet until Boomi introduced native OpenTelemetry (OTel) support for its integration runtimes in September 2025, gaining deep Boomi observability and understanding how runtimes perform in production was a significant challenge for operations and business teams.
Adding native OTel support to Boomi was a welcome step forward. Teams can now export traces, logs, and metrics from their Boomi Atoms by using the industry-standard OpenTelemetry Protocol (OTLP), without installing third-party agents or custom plugins. However, one hurdle remains: OTel provides collection and transport but does not provide a platform to store data and run analysis. Turning that telemetry data into actionable insights requires a backend that can store, correlate, and query the data.
In this post, we’ll show how you can instrument and monitor Boomi Atoms and Molecules with OTel and Datadog to gain end-to-end visibility into your integration processes, including distributed traces, natively correlated logs, inferred service dependencies, and database query insights. Specifically, we’ll cover:
Why Boomi observability is challenging without the right tooling
What Boomi’s native OTel support provides
Connecting Boomi to Datadog by using the Datadog Distribution of the OpenTelemetry Collector (DDOT)
Gaining additional visibility from Boomi integration flows with the Datadog Java tracer
Correlating Boomi processes with downstream services and database queries
Correlating logs through OTel
Building operational dashboards
Boomi provides built-in monitoring capabilities for analyzing clear-cut issues like document failures, but it offers more limited observability capabilities when it comes to spotting issues that require multiple lenses. If a process that synchronizes customer records between a CRM and a database starts failing intermittently, the platform can tell you that it failed but not necessarily why. Was it due to a slow database query? A timeout calling a downstream API? A Java Virtual Machine (JVM) memory pressure issue on the Atom itself?
Without runtime-level observability, teams are left correlating timestamps across logs, manually checking database performance, and guessing at root causes. This is especially difficult in Molecule deployments, where processes are distributed across multiple nodes. The gap between “a process failed” and “here’s what happened across every component involved” is exactly what observability is meant to close.
Boomi’s OpenTelemetry integration operates as a plugin within the Atom runtime. Once enabled through the platform UI or API, it can export three types of telemetry data:
Traces: Execution paths of integration processes, including individual step timing
Logs: Container and process-level events
Metrics: Runtime statistics exposed through Java Management Extensions (JMX)
Data is transmitted over the OpenTelemetry Protocol (OTLP) and can be sent directly to any compatible backend or routed through an OpenTelemetry Collector for buffering, filtering, and enrichment.
This is a meaningful improvement over the pre-OTel era, where gaining visibility into Boomi runtime behavior required workarounds such as custom logging connectors or third-party tracing libraries. But the OTel signals alone only get you halfway; you still need a backend that can ingest them at scale, correlate traces with logs and infrastructure metrics, and surface the insights that matter.
To bridge Boomi’s OTel telemetry data into Datadog, you can use the Datadog Distribution of the OpenTelemetry Collector (DDOT). Built on the upstream OpenTelemetry Collector, DDOT includes Datadog-optimized exporters and connectors out of the box, so you get a fully OTel-native pipeline without having to assemble components yourself. But DDOT is more than just a preconfigured Collector; it ships as part of the Datadog Agent and brings several key benefits:
Comprehensive observability beyond OTel: Because DDOT runs alongside the Datadog Agent, you automatically gain access to over 1,000 Datadog integrations, Live Container Monitoring, Cloud Network Monitoring, and Universal Service Monitoring with eBPF.
Wherever your Boomi Atoms run, whether in a VM or a container in the cloud, infrastructure metrics (CPU, memory, disk, network) are correlated with your Boomi process telemetry data out of the box. This directly addresses the “was it JVM memory pressure on the Atom itself?” question without any extra setup.
Built-in OTel processing and routing: DDOT includes OTel processors such as resourcedetectionprocessor, attributesprocessor, and transformprocessor. For Boomi Molecule deployments, you can use these to automatically enrich telemetry data with the node hostname, cloud region, or custom resource attributes so that you can pinpoint which Molecule node a failing process ran on.
Datadog APM stats from OTel traces: The included Datadog Connector computes APM stats (error rates, latency percentiles, throughput) directly from your OTel traces. This powers the Service Map, service-level objectives (SLOs), and error tracking in Datadog—even before you add the Datadog Java tracer.
Fleet management at scale: DDOT Collectors can be remotely managed through Datadog Fleet Automation, giving you visibility into the configuration, dependencies, and runtime environment of every Collector across your Boomi estate.
Install the Datadog Agent with DDOT enabled on the host where your Boomi Atom runs:
DD_API_KEY=<YOUR_DD_API_KEY> DD_SITE=<"YOUR_DD_SITE"> \
DD_OTELCOLLECTOR_ENABLED=true \
bash -c "$(curl -L https://install.datadoghq.com/scripts/install_script_agent7.sh)"
The script automatically enables the OTel Collector in /etc/datadog-agent/datadog.yaml:
api_key: <YOUR_DD_API_KEY>
site: <YOUR_DD_SITE>
otelcollector:
enabled: true
apm_config:
enabled: true
If you’re running a Boomi Molecule, repeat the process for every host that makes up your Molecule.
DDOT exposes standard OTLP endpoints (gRPC on port 4317, HTTP on port 4318) by default. Point Boomi’s OTel export to the local endpoint (http://localhost:4318 for HTTP or localhost:4317 for gRPC), and traces, logs, and metrics from your Boomi processes will start flowing into Datadog.
Because DDOT is a full OpenTelemetry Collector, it can also aggregate telemetry data from other OTel-instrumented services and infrastructure components running alongside your Boomi Atoms. This makes it a natural fit for environments where Boomi is one part of a larger, OTel-native observability strategy.
While Boomi’s native OpenTelemetry support provides valuable process-level insights, adding the Datadog Java tracer enables deeper, JVM-level visibility into how your integration flows actually execute. Let’s take the following simple process as an example:
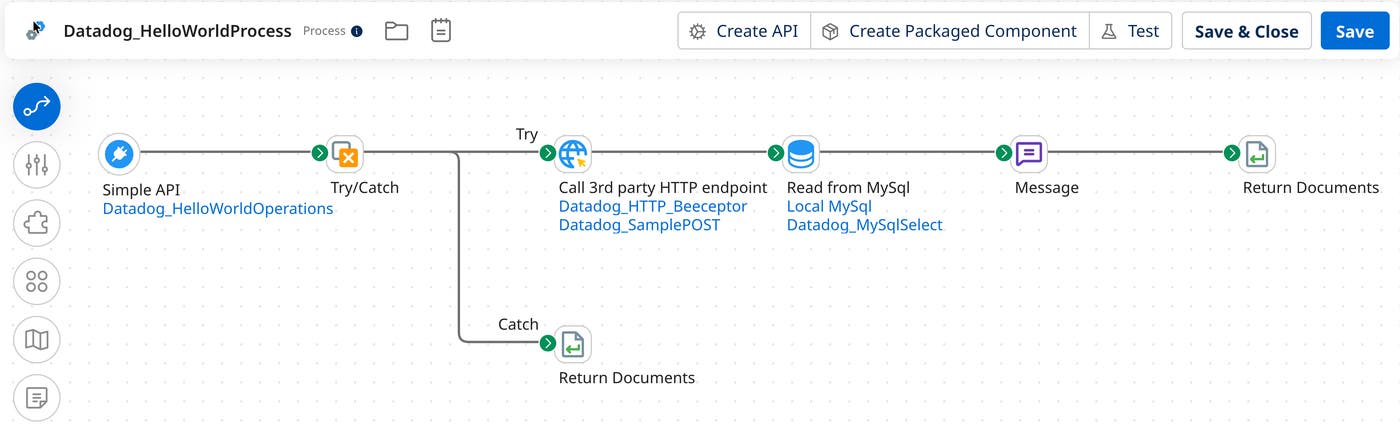
This process exposes an HTTPS endpoint that, when called, will call a third-party service through an HTTP call, query a MySQL database, and respond to the HTTPS call.
Boomi’s native OTel plugin already provides solid process-level visibility, including how long processes last, which connector failed, and various other important metadata, as shown in the following image:
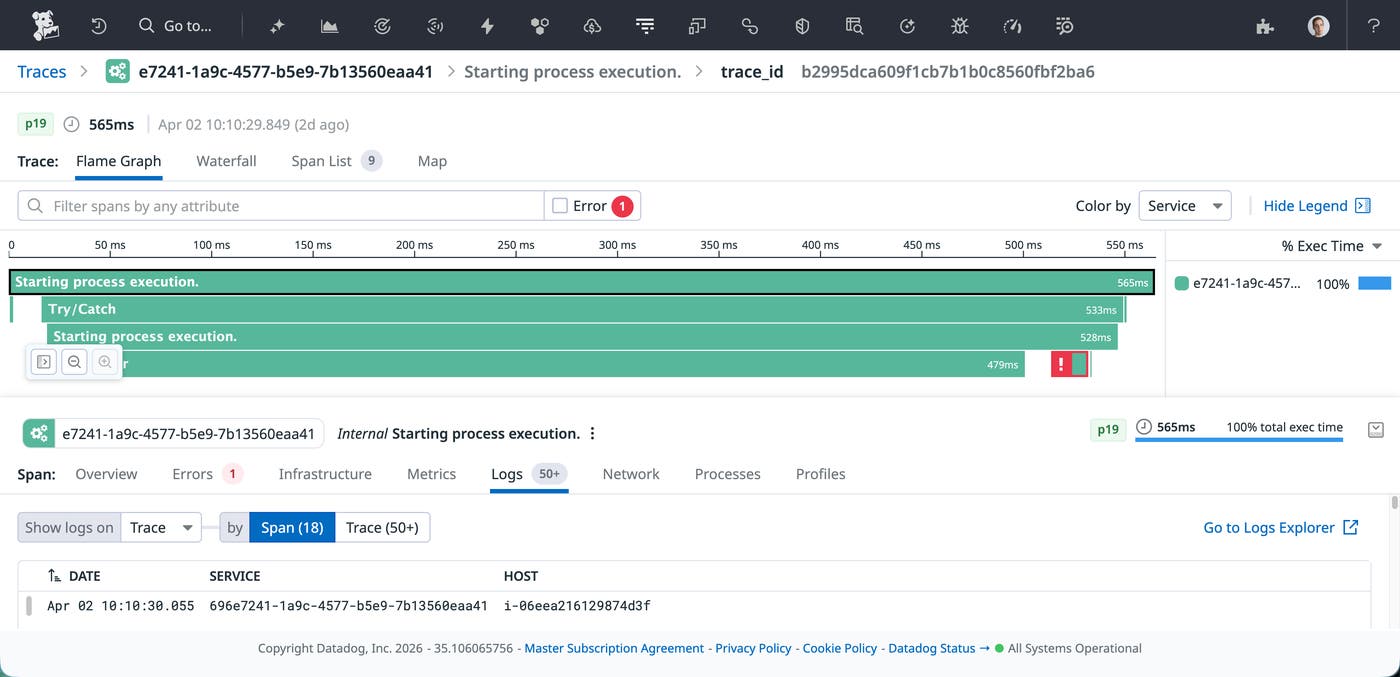
Using Datadog’s Java tracer (dd-java-agent) provides additional capabilities, such as:
Continuous Profiler: See CPU and memory hotspots within the Atom’s JVM, identifying exactly which code paths are consuming resources.
Dynamic Instrumentation: Enables you to add instrumentation to your integrations without any restarts and at any location in your application’s code, including third-party libraries.
Database Monitoring (DBM) correlation: When your Boomi process executes a database query, the tracer can correlate the trace span with the actual query plan and execution statistics in Datadog DBM.
A critical advantage of this approach is that your existing Boomi integration processes don’t need to change at all. The tracer attaches at the JVM level, which means every process deployed on the Atom, whether it’s a simple API call or a complex multi-step orchestration, is automatically instrumented without modifying a single shape in the flow.
To set it up, download dd-java-agent.jar to the Atom’s userlib directory, then add the tracer configuration through Boomi’s own management console. Navigate to Manage > Atom Management > Properties > Custom**, and add the following system properties:
-javaagent:/home/ubuntu/Boomi_AtomSphere/Atom/<ATOM_NAME>/userlib/dd-java-agent.jar
-Ddd.service=boomi-atom
-Ddd.env=sandbox
-Ddd.version=1.0
-Ddd.trace.agent.port=8126
-Ddd.trace.otel.enabled=true
-Ddd.trace.propagation.style.extract=tracecontext,datadog
-Ddd.trace.propagation.style.inject=tracecontext,datadog
Configuring through the Boomi UI means that operations teams can enable Datadog tracing without using SSH to log in to the Atom host or editing files on disk. It also means that the configuration is managed centrally and survives Atom restarts and updates.
After saving and restarting the Atom, the Datadog tracer runs alongside Boomi’s native OTel plugin. The two complement each other: OTel provides process-level execution traces from Boomi’s perspective, while the Datadog tracer and DDOT provide JVM-level insight including profiling data, dynamic instrumentation, database correlation, and more. And because the tracer works at the JVM level, it picks up every deployed process automatically; you don’t need to modify any existing flow.
The real power of this combination becomes apparent when you correlate signals across layers. Consider a scenario where a Boomi process that writes customer records to a MySQL database starts timing out intermittently.
With the OTel traces, you can see which process step is slow. With the Datadog tracer’s inferred services, you can see that the process is calling an external HTTPS service and a MySQL database—even if they are not instrumented directly. If you also have DBM correlation, you could click through from the slow trace span directly to the query execution plan in Datadog DBM, revealing that a missing index might be causing the issue.
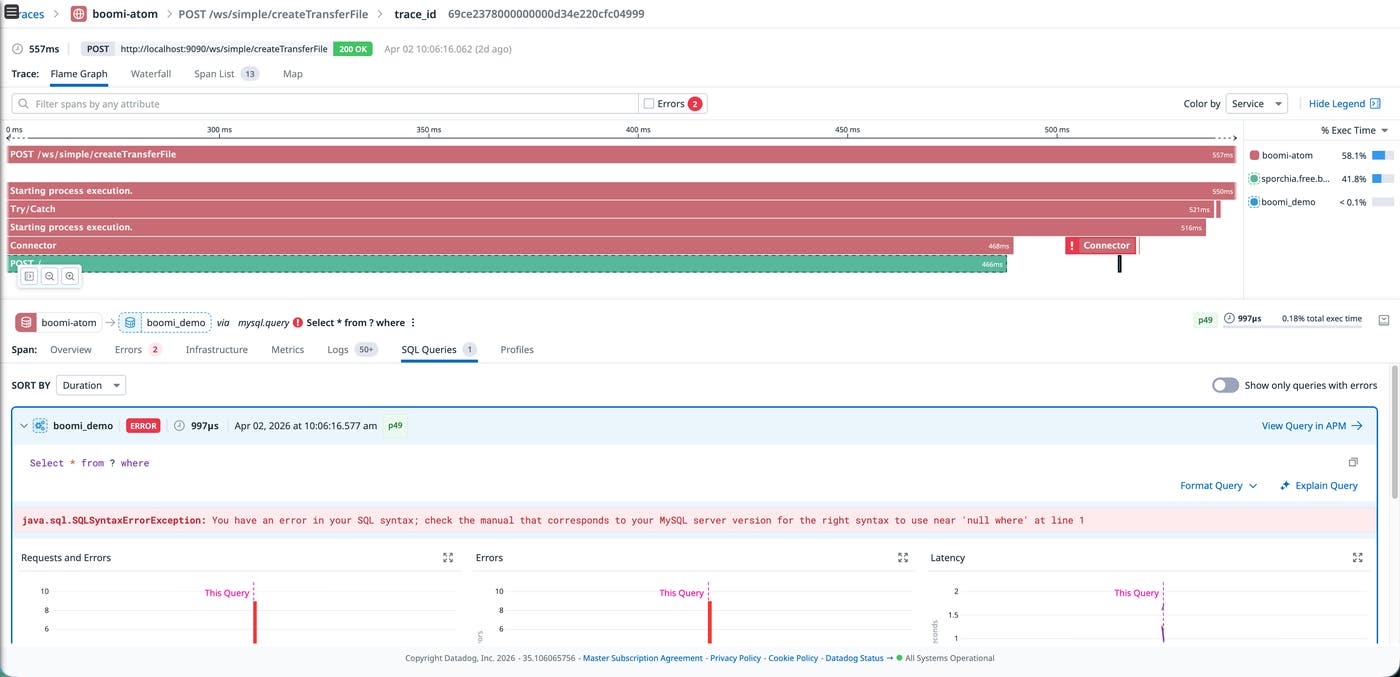
This level of end-to-end correlation, from Boomi process execution to JVM performance to database query analysis, is what makes the combination of OTel and Datadog more powerful than either one alone. It turns a “the process is slow” alert into a “this specific query on this specific table needs an index” diagnosis.
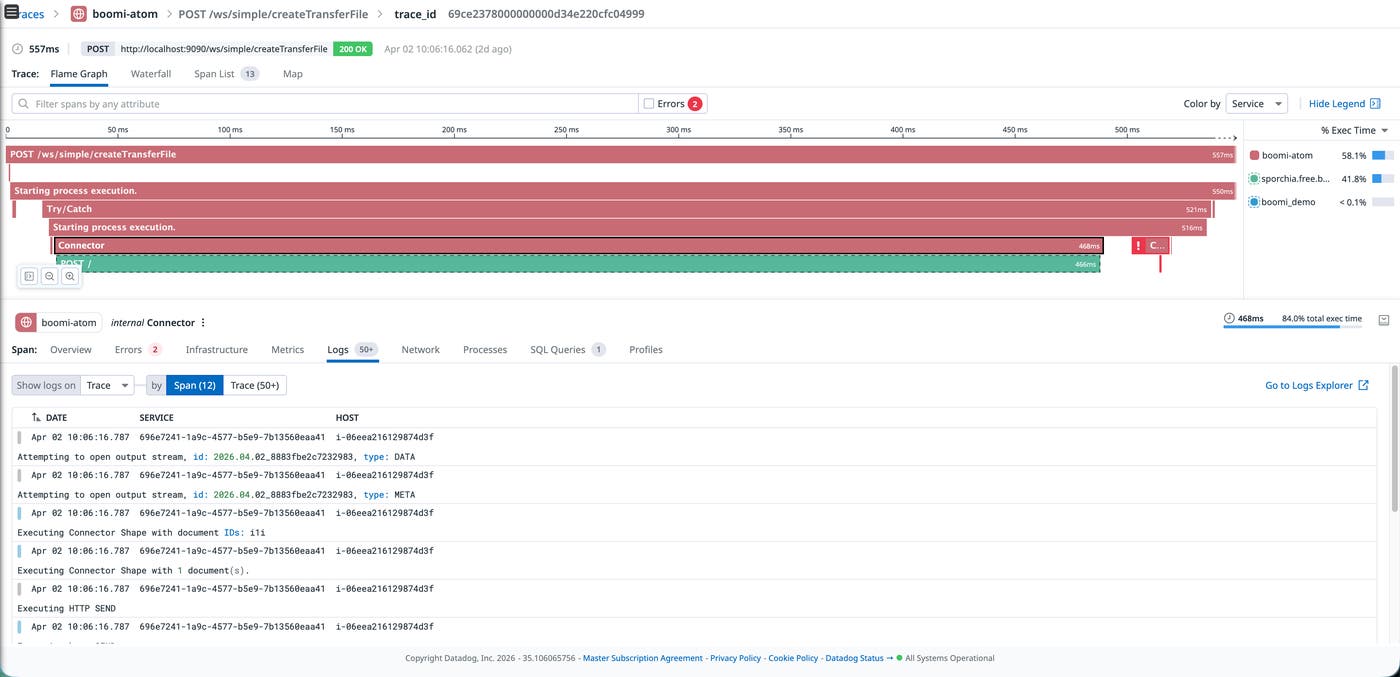
A key benefit of Boomi’s native OTel implementation is that the OpenTelemetry APIs automatically embed trace and span context into log records. This means that when traces and logs are exported through the same OTel pipeline, they arrive in Datadog already correlated; no additional configuration or proprietary log injection is required.
DDOT receives and forwards these correlated logs into Datadog Log Management and, because DDOT includes OTel processors like filterprocessor and transformprocessor, you can shape the log pipeline before data leaves the host. For example, you can drop noisy container health-check logs or enrich records with custom attributes.
When you’re investigating a failed process in APM, you can pivot directly to the correlated log lines because the OTel SDK has already done the work of linking them together. Sending logs to Datadog also enables your team to selectively decide which logs to store for longer periods of time to adhere to compliance regulations using Flex Logs, whether it is days or years.
Once traces, logs, and metrics are flowing into Datadog, you can build dashboards that give operations teams a single view for Boomi process health. The following example dashboard shows average process execution times broken down by Boomi’s process name, execution volume trends over time, error counts by process, and a log pattern analysis that surfaces recurring failure messages and their root causes in a single dashboard.
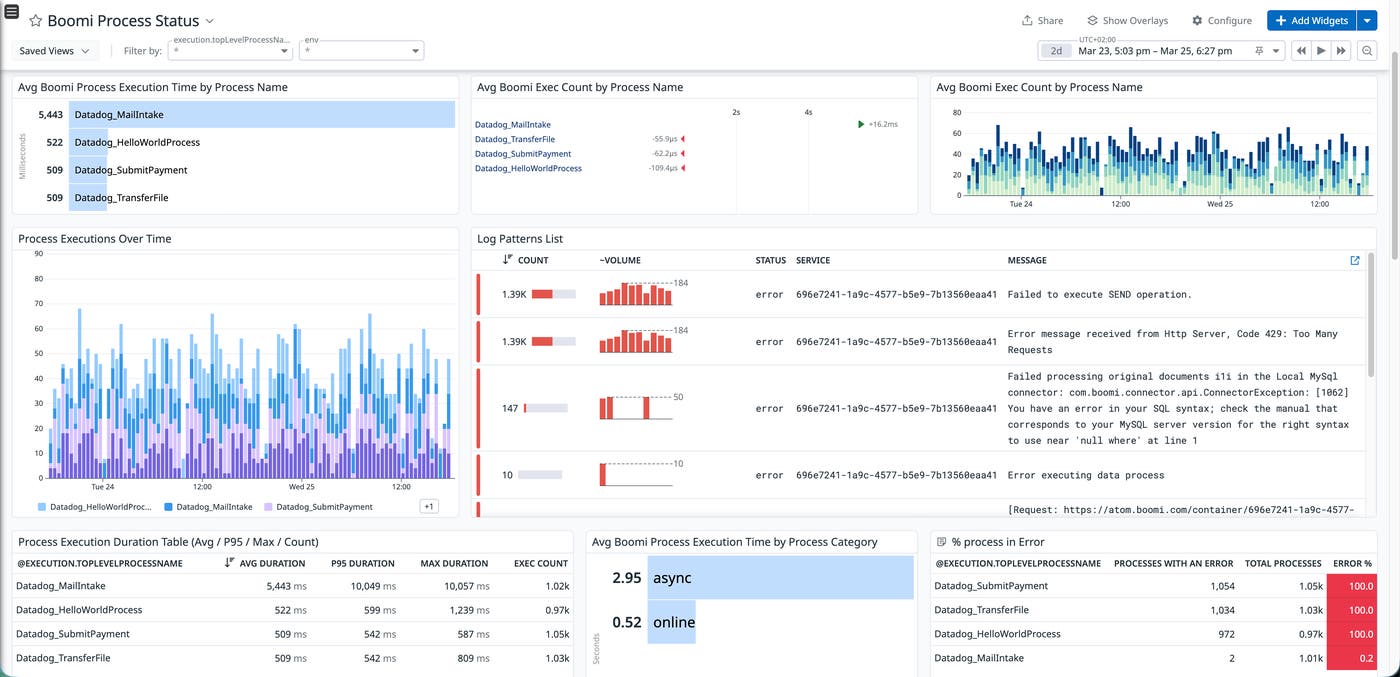
This type of dashboard turns what would normally require cross-referencing Boomi’s execution history, log files, and database monitoring into a single, real-time view. Teams can spot degradation trends before they become outages, identify which processes are the noisiest error sources, and drill into log patterns to understand failure modes without leaving Datadog.
Boomi’s native OpenTelemetry support provides a standard way to collect telemetry data from your integration runtimes. When combined with DDOT and the Datadog Java tracer, this data can be correlated across multiple layers, including Boomi process execution, JVM performance, and downstream services. This approach improves Boomi observability by connecting process-level traces with service dependencies and database queries, turning Boomi from an operational blind spot into a more visible part of your application stack.
To get started, enable OpenTelemetry on your Boomi runtime, then install DDOT to receive the data in Datadog. If you’re not yet a Datadog customer, you can sign up for a 14-day free trial.
此内容由惯性聚合(RSS阅读器)自动聚合整理,仅供阅读参考。 原文来自 — 版权归原作者所有。