


Over the past few years, the Datadog Agent’s artifact size has grown significantly, from 428 MiB in version 7.16.0 to a peak of 1.22 GiB in version 7.60.0 on Linux. That growth reflected years of new capabilities, broader integrations, and support for more environments. But it also introduced real constraints in size-sensitive contexts like serverless platforms, Edge devices, and containerized workloads.
We didn’t want to stop adding functionality. Instead, we set out to bend the curve.
Between versions 7.60.0 (December 2024) and 7.68.0 (July 2025), over the course of roughly 6 months, we reduced the size of our Go binaries by up to 77%, bringing artifacts close to where they were 5 years ago without removing features. In this post, we’ll explain how we achieved those reductions through systematic dependency auditing, targeted refactors, and re-enabling powerful linker optimizations. Along the way, we uncovered subtle behaviors in the Go compiler and linker and contributed improvements that are now helping other large Go projects, including Kubernetes, unlock similar gains.
The Datadog Agent is a complex piece of software. Although it appears as a single product to most users, behind the scenes we maintain dozens of builds that vary based on operating system (OS), architecture, and specific distribution targets. These builds include a different set of features to support a wide range of environments: Docker, Kubernetes, Heroku, edge devices, and various Linux distributions and cloud providers.
On most platforms, the Datadog Agent is composed from a set of binaries that run and interact together. These binaries are built from a single codebase, with extensive code overlap for common features and hundreds of dependencies, ranging from cloud SDKs to container runtimes and security scanners. We then rely heavily on Go build tags and dependency injection to pick which features and dependencies are included in a given binary.
Over time, as we added features, dependencies, and even entire binaries, our artifacts started to grow significantly. This growth impacted both us and our users: network costs and resource usage increased, perception of the Agent worsened, and it became harder to use the Agent on resource-constrained platforms.
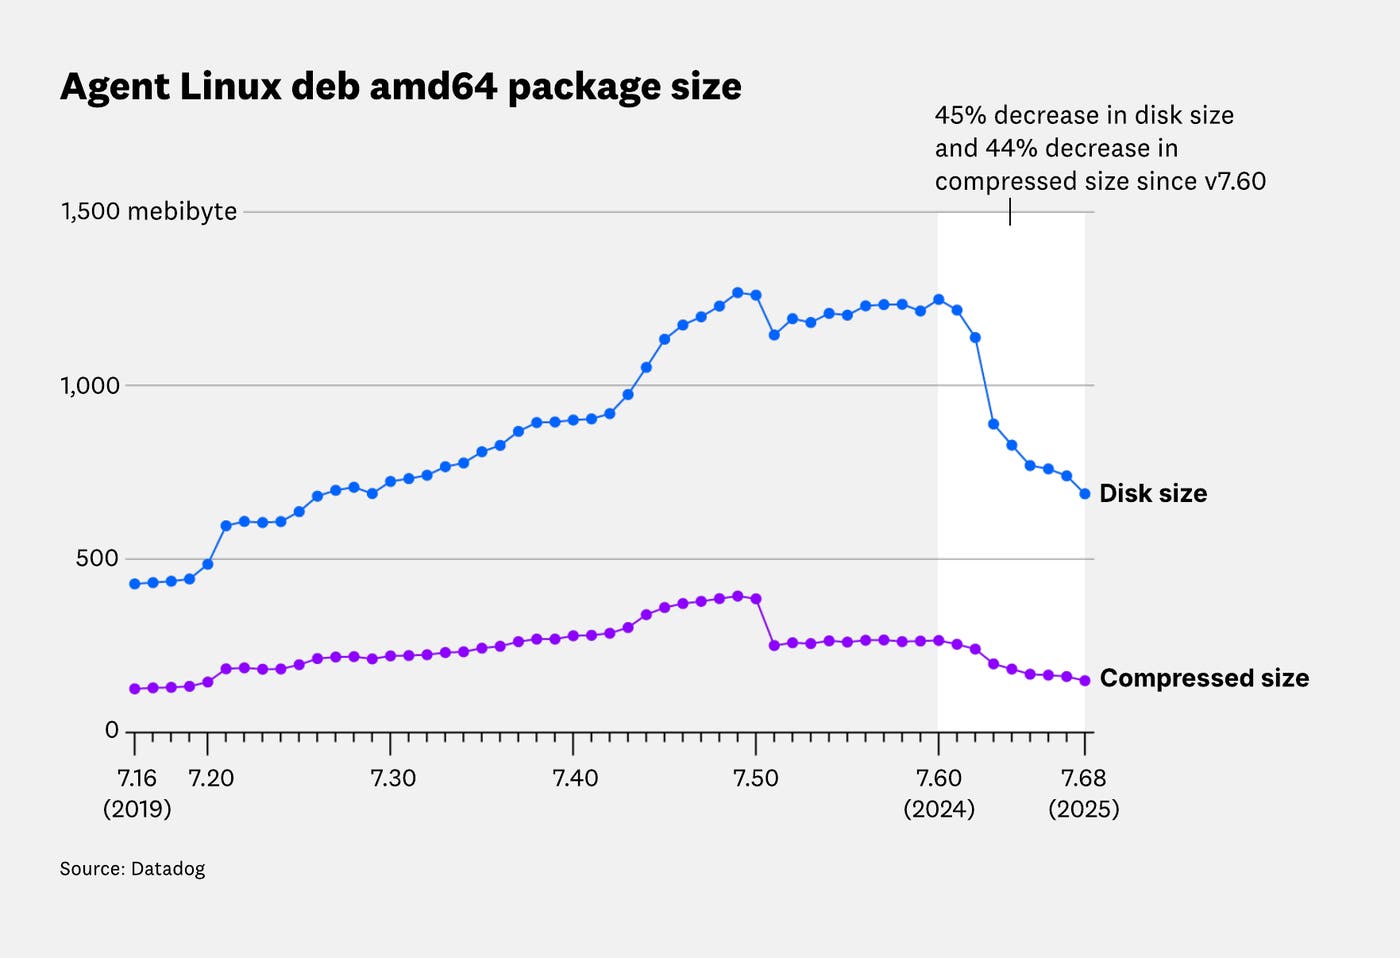
For example, from version 7.16.0 to 7.60.0 (a 5-year span), the compressed size of our Linux amd64 deb package more than doubled, from 126MiB to 265MiB, while the uncompressed size jumped from 428MiB to 1248MiB, a 192% increase.
While not all of this growth came from Go binaries, they account for a large share of each artifact, making them a prime target for investigating.
We started by looking into how the Go compiler selects which dependencies to include when building a binary, and which symbols to keep. The process is less obvious than it might seem at first glance.
The Go compiler works at the package level: It compiles each required package into its own intermediate artifact that the linker later joins into a single binary, only keeping the symbols that are needed—or, in compiler terms, reachable. For a given package, the compiler includes its files that aren’t tests—files not ending in _test.go—and that match the build constraints. In our case, those constraints mostly depend on the operating system, target architecture, and the build tags passed to the go build command. In less common cases, they can also depend on the compiler, the Go version, whether CGO is enabled, or even architecture-specific features. Refer to the Go documentation on build constraints for more detail.
To determine whether a package is needed to compile your binary, the compiler starts from the main package, transitively adding every import it encounters in files that aren’t excluded by build constraints. It also includes the standard library’s runtime package as well as its internal dependencies, which are needed to run any Go binary. For a deeper explanation of how the runtime works and why it’s unavoidable, watch Understanding the Go runtime by Jesús Espino (Mattermost).
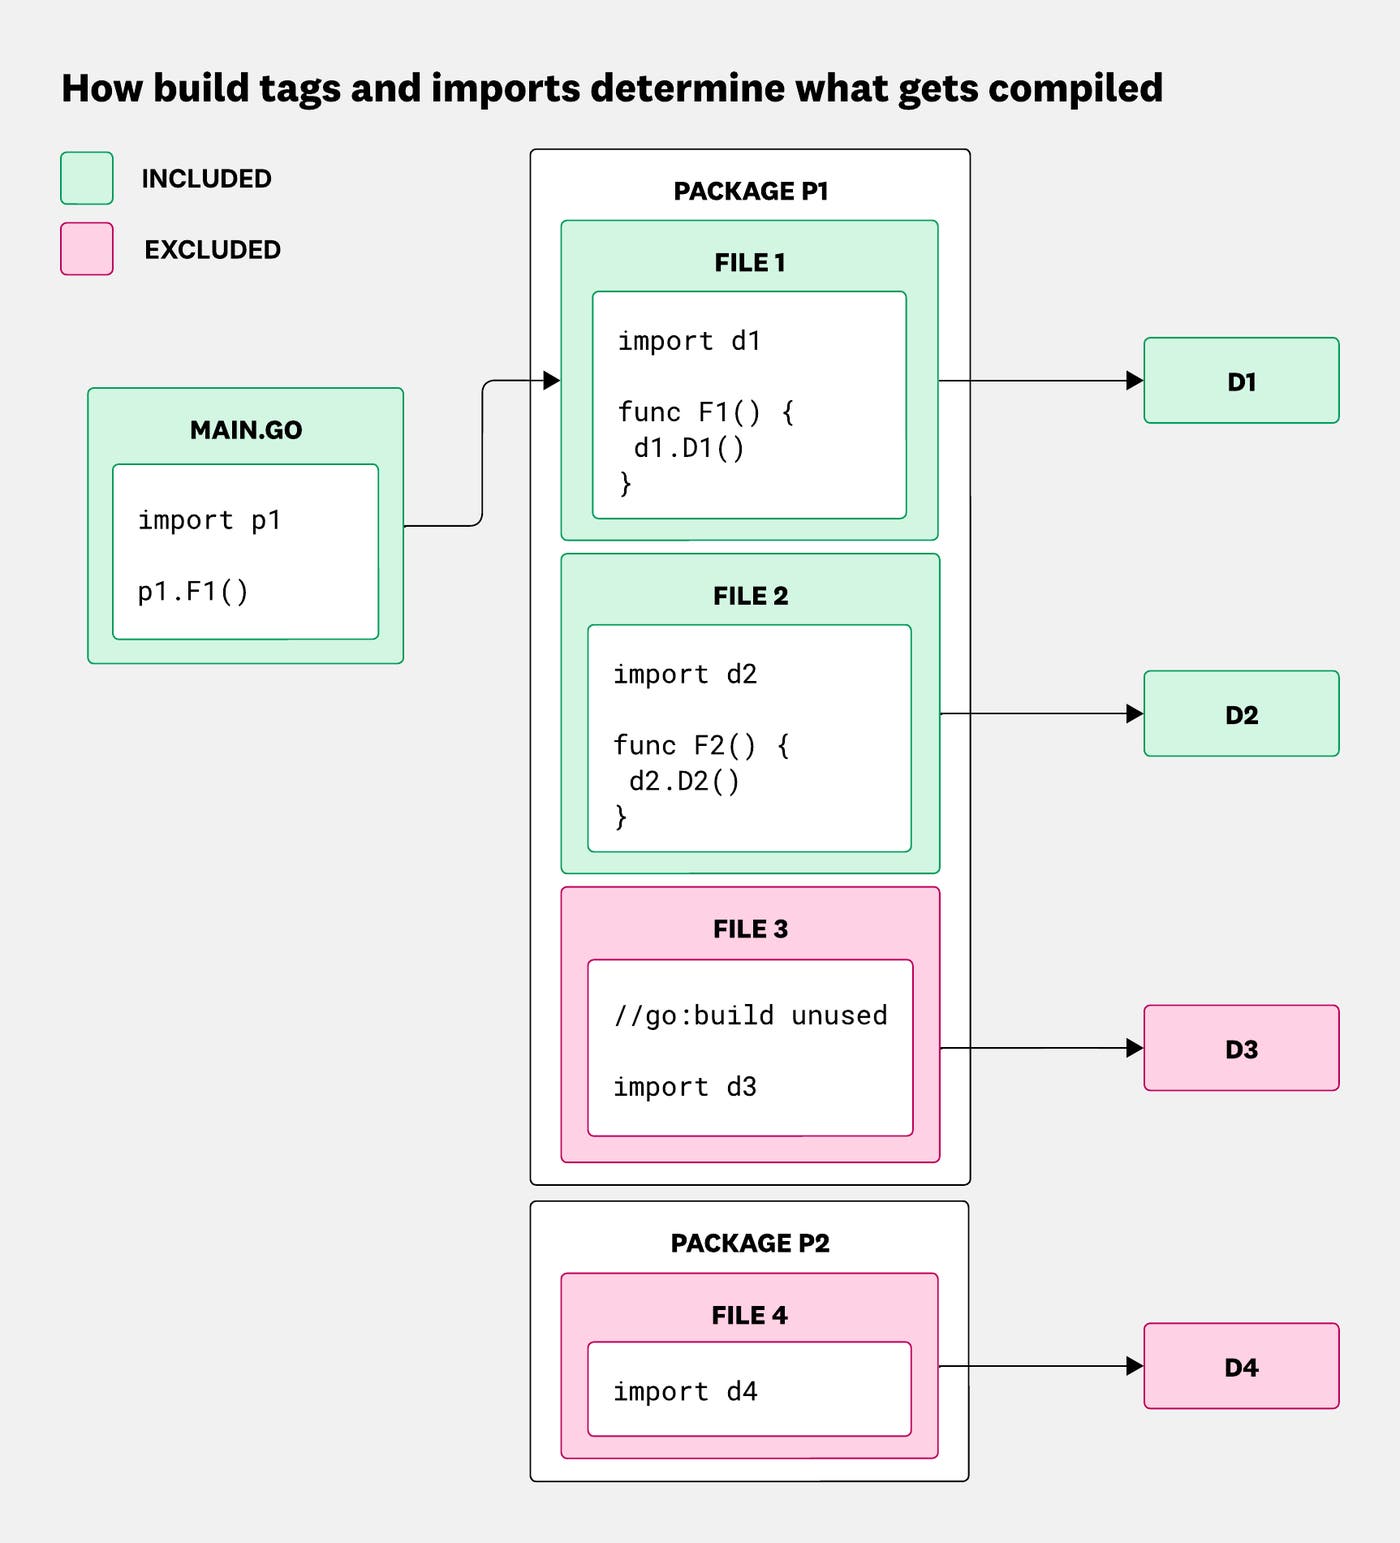
This means that there are two main ways to prevent an unwanted dependency from ending up in your binary:
Add a build tag to the file that imports it, so that the import only happens if the build tag is used.
Move the symbols that use that dependency into a different package, which can then be imported only when needed.
The following diagrams show these two strategies in action.
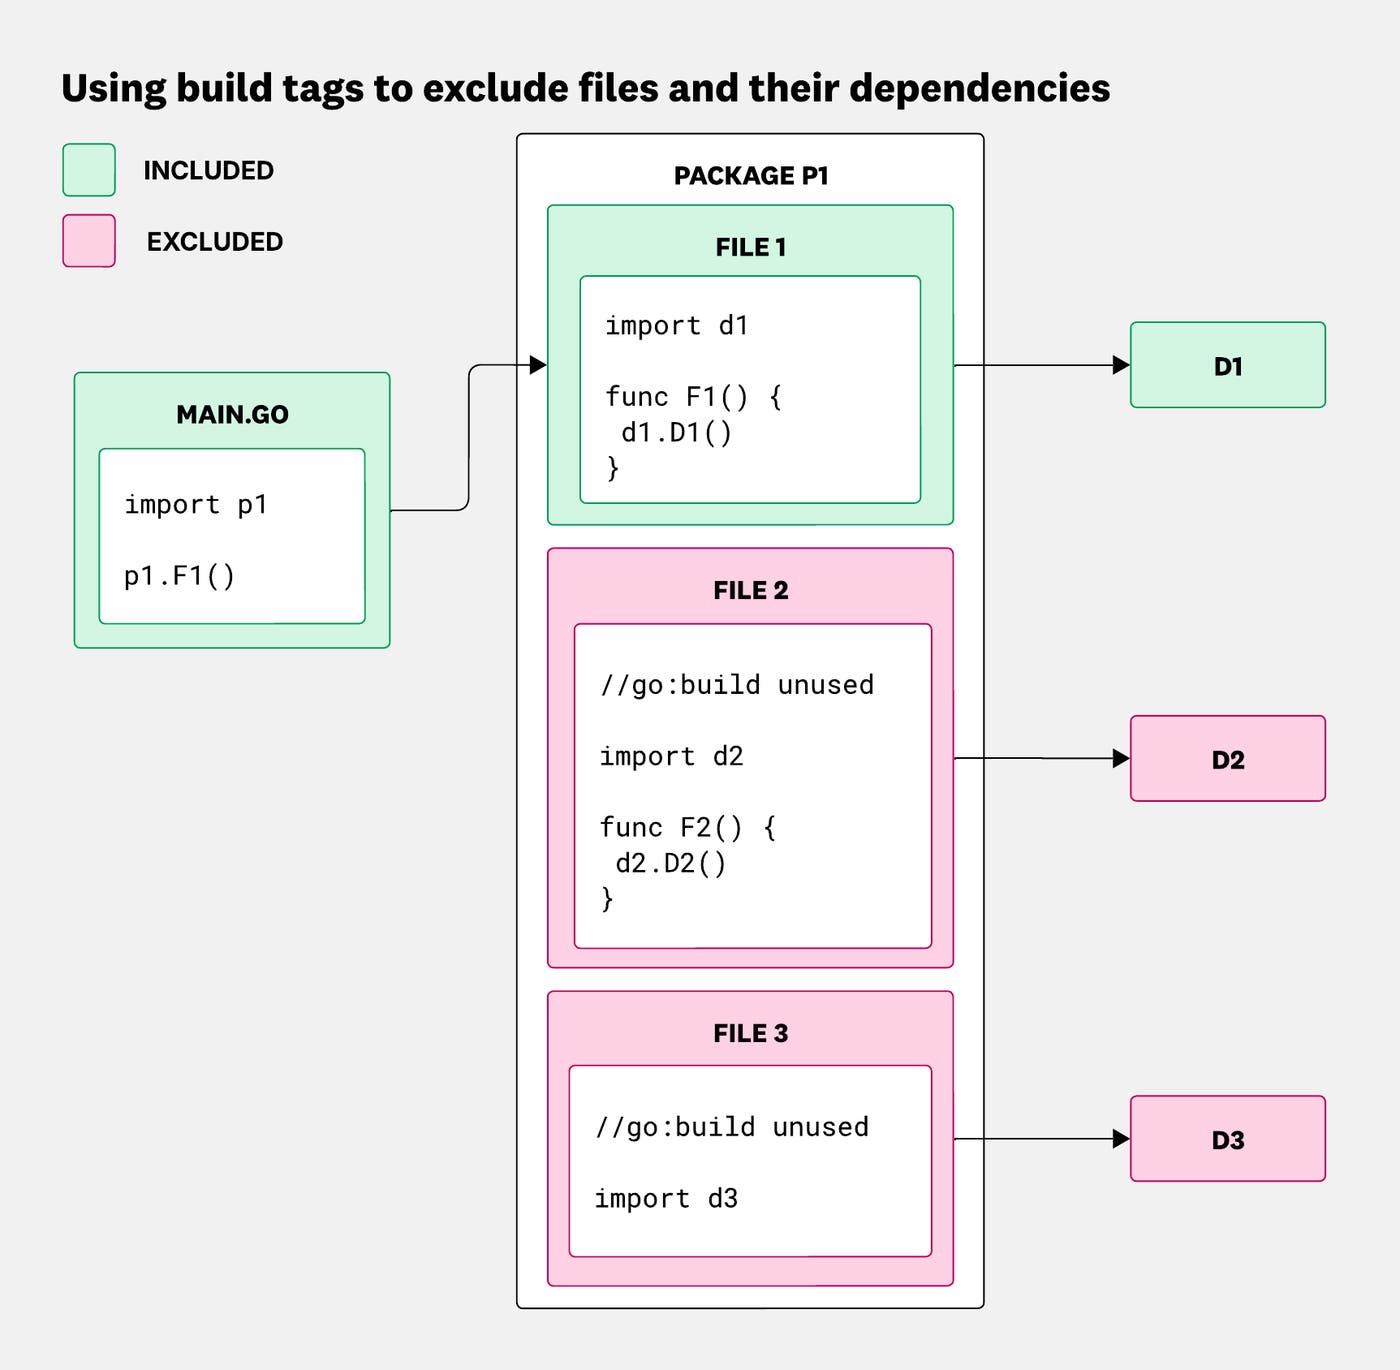
In the first case, we mark the file that imports a dependency with a build tag (//go:build unused) we aren’t using. Because the compiler ignores that file, its imports and their transitive dependencies never make it into the final binary.
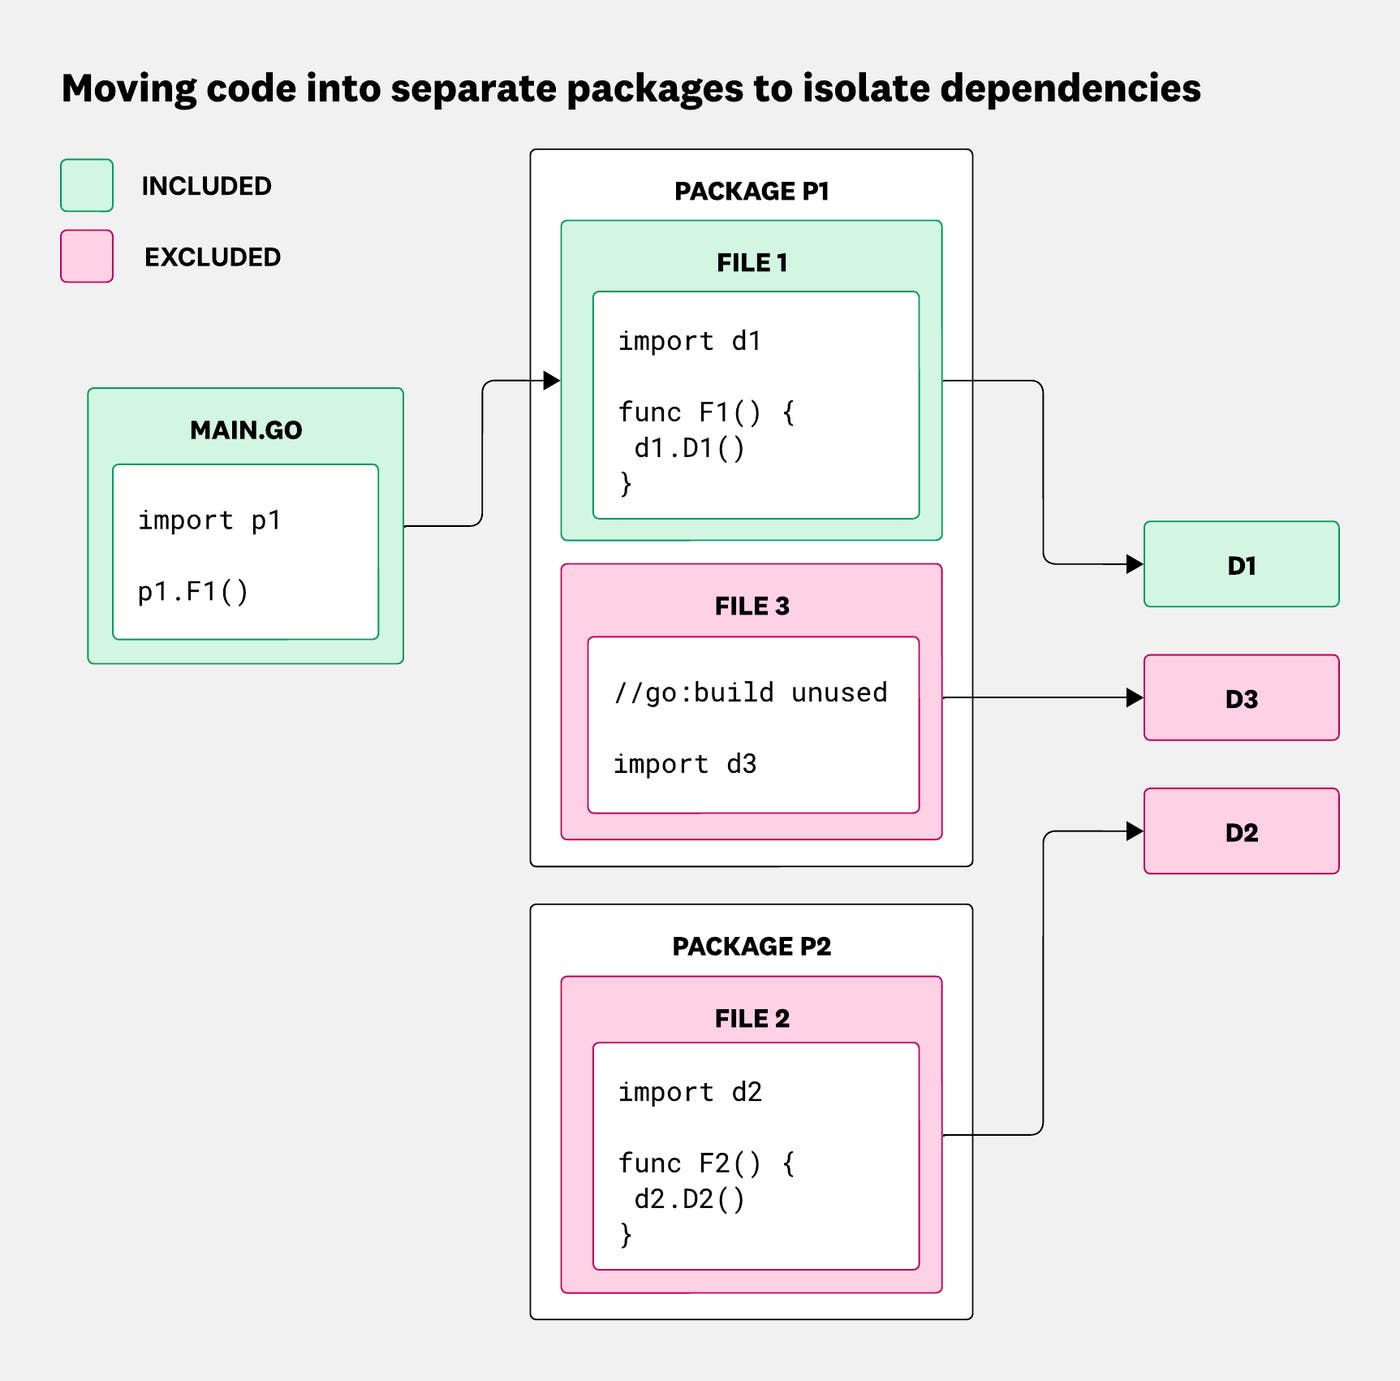
In the second case, we move the function that relies on the dependency into a different package. That way, only binaries that explicitly import that package will pull in the dependency.
Binaries often use different packages depending on the platform and build tags, which can make it difficult to understand what gets included.
The go list subcommand can be used to show all packages used when building a binary for a given OS, architecture, and a given set of build tags. So the command:
$ GOOS=linux GOARCH=amd64 go list -f '{{ join .Deps "\n"}}' \
-tags my_tag_1,my_tag_2 ./path/to/main_package
would output something like:
bytes
cmp
errors
fmt
internal/abi
[...]
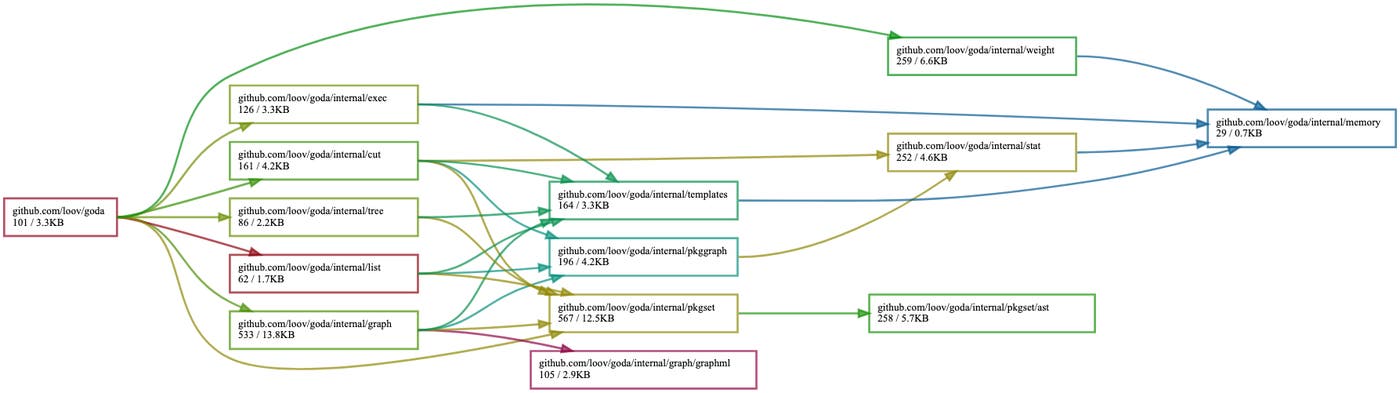
This is great, but it doesn’t explain how these dependencies were imported in the first place. To figure that out, we use goda, a convenient tool that can create a graph of package imports, showing all the imports done by a binary, including indirectly from dependencies.
Similar to go list, goda takes into account build tags, as well as the GOOS and GOARCH environment variables. In the following command, . means starting from the current package, and :all includes all direct and indirect dependencies:
$ GOOS=linux GOARCH=amd64 goda graph "my_tag_1=1(my_tag_2=1(.:all))"
The reach function can also be used to graph only the paths leading to a given target package:
$ GOOS=linux GOARCH=amd64 goda graph "reach(my_tag_1=1(my_tag_2=1(.:all)), ./target/package)"
Here is the dependency graph of goda itself:
Having a list of included packages in an artifact is convenient, but if you care about size, it doesn’t help much. The linker is able to determine which symbols of a package are actually used in a binary—and remove the others—so a package can have a different binary size depending on how it’s used. Furthermore, simply importing a package has side effects: init functions run and global variables are initialized, which can be enough to force the linker to keep many unnecessary symbols. So a package might have a size impact even though you’re not truly using it. Some uses of reflect can also impact linker optimizations here, but we’ll come back to that later.
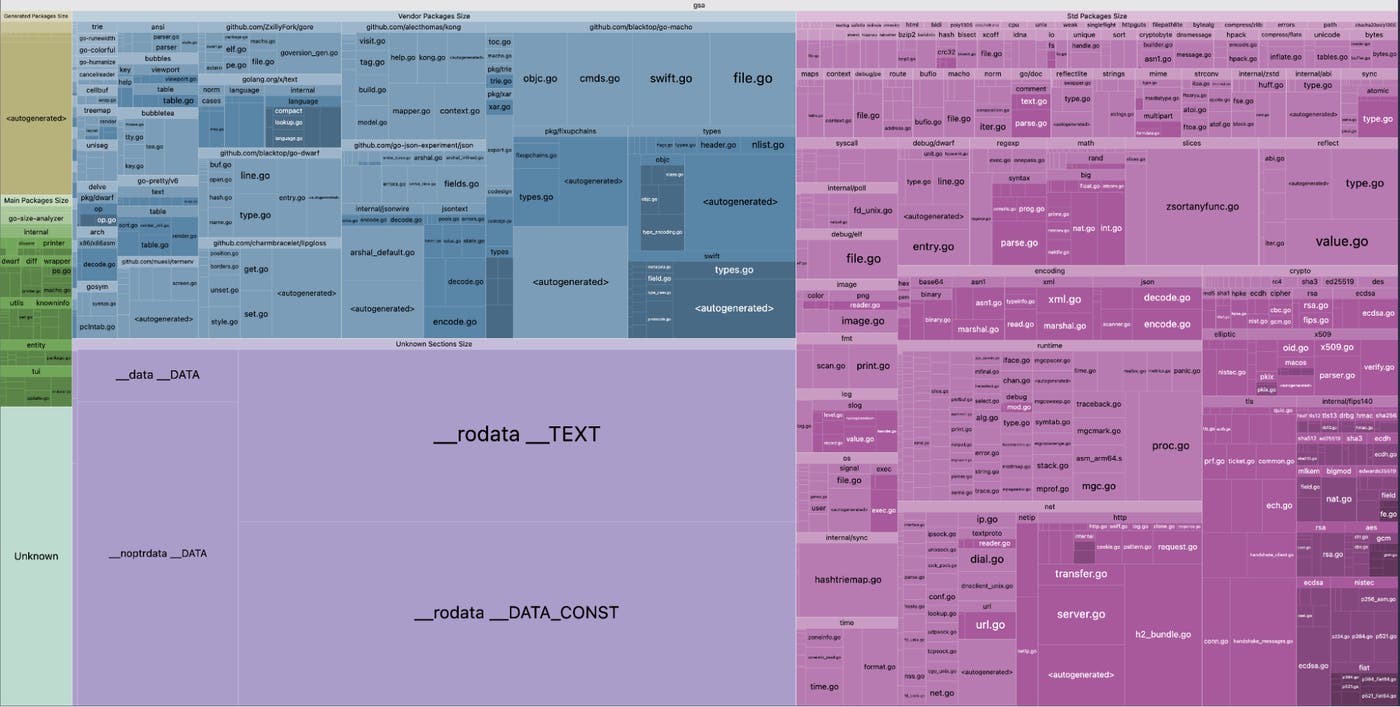
The tool go-size-analyzer displays the size taken by each dependency in a Go binary, either as text or in an interactive web interface. This makes it easier to spot which dependencies are actually worth removing:
Here is the interactive web output of go-size-analyzer when analyzing itself. You can then hover over each tile to see the size:
Let’s look at a concrete example from the Agent codebase.
We updated the tagging logic in our trace-agent binary so that it wouldn’t depend on Kubernetes dependencies anymore. But when we ran go list, it still showed 526 packages from k8s.io included in the build, and go-size-analyzer made it clear that those packages accounted for at least 30 MB of binary size.
$ gsa trace-agent
|----------------------------------------------------------------------|
| trace-agent |
|----------------------------------------------------------------------|
| PERCENT | NAME | SIZE | TYPE |
|---------|---------------------------------------|--------|-----------|
| 21.48% | k8s.io/api | 14 MB | vendor |
| 18.63% | .rodata | 12 MB | section |
| 15.69% | k8s.io/client-go | 9.9 MB | vendor |
| 4.48% | github.com/DataDog/datadog-agent | 2.8 MB | main |
| 2.50% | k8s.io/apimachinery | 1.6 MB | vendor |
| 2.36% | .text | 1.5 MB | section |
| 2.26% | google.golang.org/protobuf | 1.4 MB | vendor |
| 2.22% | net | 1.4 MB | std |
| 2.17% | crypto | 1.4 MB | std |
| 2.13% | github.com/google/gnostic-models | 1.3 MB | vendor |
| 1.76% | k8s.io/apiextensions-apiserver | 1.1 MB | vendor |
| 1.64% | github.com/gogo/protobuf | 1.0 MB | vendor |
[...]
Using goda, we traced the import path back to a single package in our codebase. That package was only included into the trace-agent binary for one function, and that function did not actually depend on any Kubernetes code.

Simply moving this function into its own package and updating the relevant imports was enough for the compiler to trim all the unused dependencies. The result: 570 packages removed from the Linux trace-agent binary and a size reduction of about 36 MiB—more than half of the binary.
This reduction is an extreme example, but was not a unique one. We found many similar cases—although with smaller impacts—where dependencies were accidentally included. By systematically listing, auditing, and pruning these imports, we were able to significantly reduce binary size across the Agent.
While we were looking into removing unneeded dependencies, we found out about a linker optimization that could also cut binary size by around 20%.
When using the reflect package, you can call any exported method of a type by using MethodByName. However, if you use a non-constant method name, the linker can no longer know at build time which methods will be used at runtime. So it needs to keep every exported method of every reachable type, and all the symbols they depend on, which can drastically increase the size of the final binary.
We referred to this optimization as method dead code elimination.
The most common uses of this feature of reflect are the text/template and html/template packages from the standard library, since they enable calling methods whose name is specified in a dynamic template on a dynamic object.
Our initial idea to enable this optimization was to instrument our binaries to emit a list of all methods used at runtime, then edit the compiler artifacts to force the linker to remove all other methods. Although this approach had the convenient benefit of requiring almost no code changes, it would have introduced runtime panics if we removed a method that ended up actually being called, so we looked for alternatives.
While we initially assumed patching every problematic use of reflect—both in our own codebase and external dependencies—would be too difficult, we gave it a try anyway.
To understand why the optimization is disabled in the linker, we used its -dumpdep flag, which makes it print why symbols are reachable in the binary.
The whydeadcode tool can consume this output, determine whether the optimization is disabled, and if so it prints the culprit call chain, letting you fix the issue and re-run the tool until the optimization is enabled. One caveat: Only the first displayed call stack is guaranteed to be a true positive, so the safest way to use the tool is to run it repeatedly and fix the first identified call each time.
Consider the following example:
import (
"errors"
"os"
"text/template"
)
func main() {
tmpl, _ := template.New("tmpl").Parse("{{.Error}}\n")
tmpl.Execute(os.Stdout, errors.New("some error"))
}
Using whydeadcode shows that the optimization is disabled due to executing the template:
$ go build -ldflags=-dumpdep |& whydeadcode
text/template.(*state).evalField reachable from:
text/template.(*state).evalFieldChain
text/template.(*state).evalCommand
text/template.(*state).evalPipeline
text/template.(*state).walk
text/template.(*Template).execute
main.main
runtime.main_main·f
runtime.main
runtime.mainPC
runtime.rt0_go
_rt0_arm64_darwin
_
It turned out we only needed to patch around a dozen dependencies to exclude those uses of reflect, some of which already had open proposals for fixes. We opened change requests on dependencies we needed to patch (for example, kubernetes/kubernetes, uber-go/dig, google/go-cmp), pushed existing upstream PRs forward, and removed various dependencies from our binaries altogether.
As for text/template and html/template, while there is an open issue to allow statically disabling method calls, we couldn’t wait for a fix to be implemented and released. So we forked the two packages into our codebase and patched them to disable method calls in our own template usage.
Eventually, we enabled the optimization across all of our binaries, one by one, and saw an average 20% binary size reduction, ranging from 16% to 25% depending on the binaries, compounding to a total reduction of around 100 MiB.
Our efforts also helped spread awareness of the optimization: Kubernetes project contributors began enabling it in their own binaries and reported 16% to 37% size reduction, bringing similar improvements to the wider community.
During our initial investigation into enabling method dead code elimination, we hacked through our codebase and dependencies, commenting out every piece of code that disabled the optimization. Although this broke the binaries in many ways, we wanted to see which parts of the code needed updates and measure the potential size reduction impact.
Even in that broken state, we saw an immediate effect: Our Linux arm64 Go binaries shrank by a combined 94 MiB, even though the optimization wasn’t yet enabled for every binary. On the other hand, it barely affected our amd64 artifacts.
When we built the binaries on amd64, we noticed something odd: whydeadcode showed that simply using a type made one of its unexported methods—unused in practice—reachable, which indirectly disabled the optimization. Even stranger, that code wasn’t architecture-specific, so it should have behaved the same on arm64.
We assumed this was due to differences in how the linker handled each architecture, but decided to investigate anyway, hoping to find something we could improve and upstream.
Looking into the linker code, we found references to the plugin build mode and several plugin-specific behaviors. It turns out that just importing the plugin package from the standard library makes the linker treat the binary as dynamically linked, as shown in the linker source code, which disables method dead code elimination and even forces the linker to keep all unexported methods.
Go plugins allow for dynamically loading Go code at runtime from another Go program. The main binary and the plugin share the same state—global variables, values, and methods—so the linker must keep every symbol in case they are used by a plugin.
We had already noticed that the plugin package was imported in our amd64 builds but not the arm64 ones, so this was most likely the root cause of the difference.
Using goda to inspect our dependency graph, we quickly traced the plugin import to the containerd package, which allows users to load custom plugins. That feature wasn’t something the Agent relied on, so we opened a PR upstream to add a build tag so that the import could be selectively excluded without breaking any existing users. Once containerd merged and released the change, we updated the Agent and applied the relevant build tags in PR #32538 and PR #32885.
Overall, this specific change resulted in a 245 MiB size reduction for our main Linux amd64 artifacts—roughly a 20% decrease in the total size at the time—benefiting about 75% of our users.
To see the full impact of these efforts, the following chart shows the size of our Linux amd64 packages over time. You can see how the growth of the Agent artifacts peaked around v7.60.0, and how the changes we introduced between v7.60.0 (December 2024) and v7.68.0 (July 2025) brought those sizes sharply back down, nearly to where they were 5 years ago.
Across all Linux amd64 binaries—representing roughly 75% of our users—the reductions are striking:
Core Agent: 236 MiB → 103 MiB (decrease of 56%)
Process Agent: 128 MiB → 34 MiB (decrease of 74%)
Trace Agent: 90 MiB → 23 MiB (decrease of 74%)
Security Agent: 152 MiB → 35 MiB (decrease of 77%)
System Probe: 180 MiB → 54 MiB (decrease of 70%)
Overall, the compressed and uncompressed sizes of our .deb package have dropped by about 44%, from 265 MiB to 149 MiB compressed, and from 1.22 GiB to 688 MiB uncompressed.
What makes this result even more satisfying is that we achieved it without removing any feature. Every capability added over the past 5 years is still there. And in that time, we have added dozens of new products and major capabilities to the Agent. The binaries are now just smaller, cleaner, faster to distribute, and they use less memory.
It was a long journey but the results were worth it. We also hope that this article can also help others in their optimization journey.
If you enjoy digging into compilers, optimizing build systems, or solving scale and performance challenges like this, we’re hiring!
此内容由惯性聚合(RSS阅读器)自动聚合整理,仅供阅读参考。 原文来自 — 版权归原作者所有。