


We recently released our initial State of Cloud Costs report, which identified factors shaping the costs of hundreds of organizations that use Datadog Cloud Cost Management to monitor their AWS spend. The report reveals several widely applicable themes, including the ways in which resource utilization, adoption of emerging technologies, and participation in commitment-based discount programs all shape cloud environments and costs.
In this post, we’ll explore those themes, describe best practices you can use to optimize your cloud environment, and show you how Datadog can help. You’ll learn how you can:
To run healthy containers, you need to provision enough hosts in your cluster and dedicate sufficient CPU and memory to ensure the performance of your workloads. But to run containers cost-efficiently, you need to avoid over-provisioning—running clusters with more nodes than necessary or requesting more CPU and memory than your workloads require—which can leave your infrastructure underutilized. It’s difficult to predict the resource requirements for new and evolving workloads, and organizations often over-provision to be on the safe side. As a result, their infrastructure is underutilized, and these idle resources are a frequent contributor to wasted cloud spend.
To carefully manage your container costs, you need an understanding of your workloads’ current and future resource requirements, as well as ongoing visibility into their resource utilization. You can monitor metrics from your ECS, EKS, and self-managed Kubernetes environments to understand the performance and resource utilization of your workloads. These metrics can help you understand your applications’ baseline performance, which gives you useful information for revising resource requests and autoscaling parameters.
Datadog Cloud Cost Management gives you tools to analyze the utilization and cost efficiency of your containerized environments, including EKS, ECS, and Kubernetes on EC2. The Containers view—shown in the screenshot below—makes it easy to see if any of your Kubernetes spend is being wasted on workload idle or cluster idle. You can filter your cost data by any dimensions that are meaningful to your organization—such as cluster, service, or team—to see where your idle costs are coming from. To address any wasted spend due to over-provisioning, you can autoscale your clusters and individual workloads.
Cloud Cost Management also provides detailed guidance on how you can revise your resource requests to mitigate wasted spend. By monitoring your clusters’ performance data, Datadog can automatically identify over-provisioned workloads and recommend request values that can reduce your cloud costs while still allocating enough CPU and memory to ensure the performance of your applications. And Datadog Kubernetes Autoscaling enables you to continuously optimize your cluster to ensure efficient resource usage.
As AWS evolves and improves its services, their most recent versions are often the most performant and cost-efficient. For example, many current-generation EC2 instances use modern Intel Xeon or AWS Graviton processors, which give these EC2s improved cost-efficiency compared to previous generations. Similarly, the most recent EBS volume type—gp3—boasts cost and performance improvements over the previous generation, gp2.
It’s often an easy choice to adopt current-generation services to support brand new workloads, but migrating existing workloads may not be as simple. Moving to a new storage service or compute architecture often comes with a need for planning and testing to ensure that the change won’t introduce any user-facing impact or breach any SLAs. The risk and burden of migrating may explain why previous-generation versions of AWS services—for example, EBS and EC2—are still widely used.
A significant part of the challenge of modernizing your infrastructure is identifying all of the workloads in your environment that rely on previous-generation services. It’s also important to see the extent to which these services affect your cloud costs, so you can prioritize migrating the workloads that will bring the greatest optimizations.
You can leverage Cloud Cost Management to see the savings you could realize by migrating away from the legacy technologies in your environment, such as gp2 volumes. In the screenshot below, Cloud Cost Recommendations lists gp2 volumes in use and displays an AWS CLI command you can use to migrate a volume to use the gp3 volume type instead.
Another important piece of migrating is understanding the context of each occurrence of legacy technology in your environment. Before you can plan and prioritize a migration, you should identify your services that rely on those legacy technologies, the teams that own those services, and any risks you face when you migrate. The Resource Catalog shows the infrastructure resources in your environment with valuable context, including ownership and service information from the Service Catalog. You can easily group resource data by using attributes such as instance type or volume type to aggregate records in a way that shows you your usage of old- and new-generation AWS services. In the screenshot below, the Resource Catalog lists gp2 volumes and shows the team and service each one is associated with.
Transferring data to, from, and within your AWS environment can contribute to your cloud bill. For example, you’ll incur costs sending data between your EC2 instances and the internet, and from one availability zone (AZ) to another within the same region in your AWS environment. This cross-AZ traffic makes up half of data transfer costs for the organizations we looked at, and almost all those organizations paid some amount for cross-AZ traffic.
To manage your cross-AZ spending, you need to understand which of your services are talking to endpoints in other AZs and decide whether that traffic is necessary. Similar to migrating to current-generation data stores and compute instances, reconfiguring your services to keep traffic within a single AZ may or may not be worth the effort it requires. If limiting the associated services to a single AZ would affect their performance or availability, or if the work to re-architect them wouldn’t be offset by the cost efficiency gained, you may need to acknowledge the costs as necessary and budget accordingly going forward.
Datadog Network Performance Monitoring (NPM) lets you visualize traffic between AZs. You can use the traffic’s service tag to isolate network activity to and from a specific service, helping you understand how the volume of that service’s traffic contributes to your cross-AZ spend. In the screenshot below, the Network Analytics view shows the relative amounts of traffic between different AZs.
The Network Analytics view illustrates where cross-AZ traffic occurs, providing context to better understand your costs. But to illuminate those costs further, you can pivot to Cloud Cost Management, which brings together cost and observability data to help you understand and optimize your cloud spend. In the screenshot below, the Cloud Cost Analytics page shows cross-AZ costs for the past 30 days. The data is grouped by service to show the costs incurred by each service as well as the percentage of change in cost over the selected time range. This stacked bar chart illustrates the relative cost incurred by each service as well as the organization’s overall daily spending on this type of traffic, and the table below summarizes costs based on the source and destination AZs.
To prioritize your optimization work, you can easily sort the data by cost to highlight the services that incur the most cross-AZ cost. And to jump-start your collaboration on these efforts, you can pivot to the Service Catalog, where you’ll find each service’s ownership information, along with its reliability, performance, and security data.
AWS offers several discount programs that reduce the cost of some of its services if you commit to an amount of spend or usage over a defined period. For example, Compute Savings Plans cut prices on AWS compute services—including EC2, Fargate, and Lambda—when you pay in advance to use those services. Savings Plans don’t restrict which services or instance types you use during the committed term, so you can change how you use AWS compute and still benefit from discounts on any of them.
Despite the potential savings promised by commitment-based discount programs, we saw a decline in the percentage of organizations participating. Purchasing discounts carries risk, and organizations are often circumspect in adopting them because overcommitting can result in unused capacity and wasted cloud spend. To minimize risk, you should analyze your AWS bill to identify trends in your usage of services that offer a commitment-based discount. If you can confidently project your future usage across a discount term—for example, the amount you expect to spend across EC2, Fargate, and Lambda over the next one- or three-year period—you should consider purchasing the discount.
Cloud Cost Management automatically tags your cloud costs to show whether they’re covered under a discount program. You can explore your data to see the proportion of costs that are covered by commitment-based discounts compared to your on-demand costs and visualize changes in these cost types to uncover trends in discount coverage. Datadog stores 15 months of cloud cost data, giving you deep visibility into your daily on-demand spend history to guide you in purchasing discounts. You can even isolate each resource’s costs, as well as context data such as its RDS instance type and database engine.
The screenshot below shows the past year of daily on-demand spend data, grouped by region, instance type, and database engine.
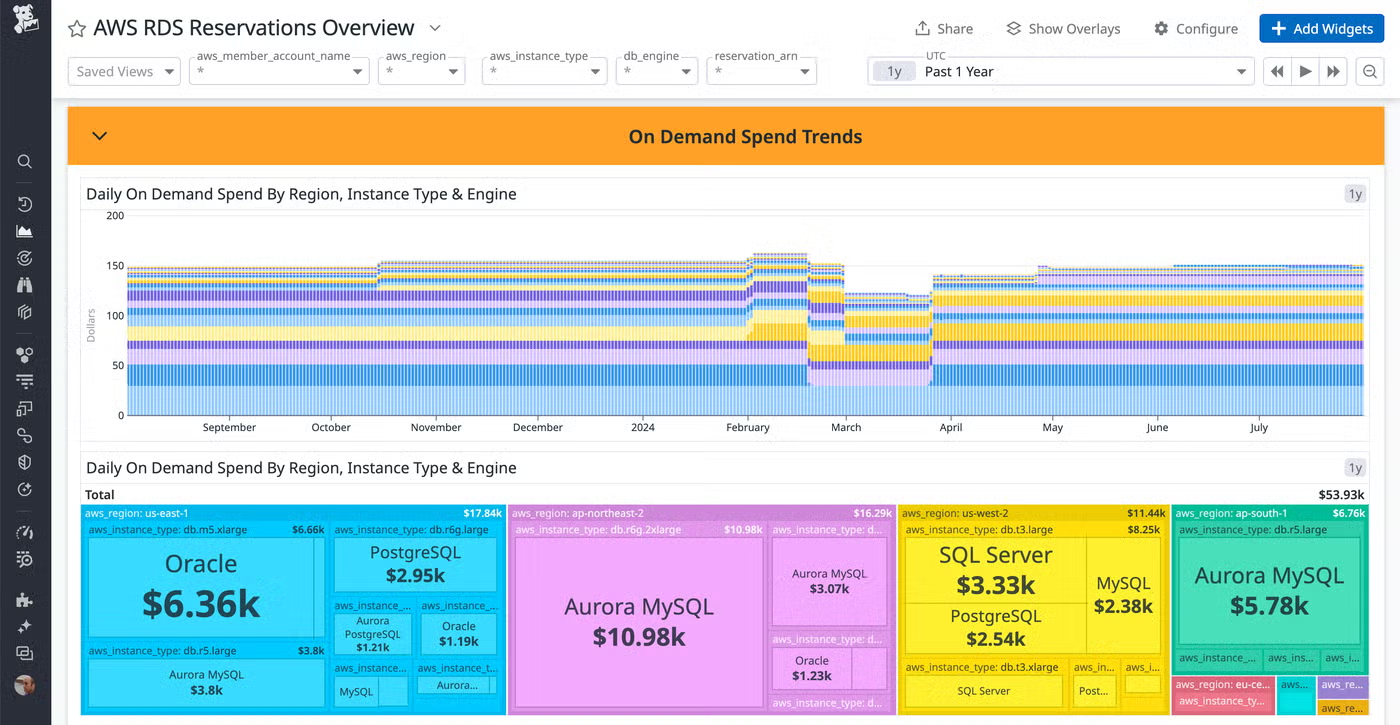
You can filter further to see how much cost is discounted for specific AWS accounts and regions to gain context on where your organization is leveraging AWS discounts and where you might be able to optimize.
Our inaugural State of Cloud Costs report surfaced some important themes that illuminate the paths to cost optimization. In this post, we looked at how Datadog can help you take initial steps to optimize your cloud costs, and how you can rely on Datadog to continue to drive efficiency as your cloud environments expand and mature. Datadog combines usage and performance metrics with your cost data to give you deep visibility into your cloud spend so that you can identify and act on cloud cost optimization opportunities.
See our documentation for information about getting started with Cloud Cost Management. And if you’re not already using Datadog, you can start today with a 14-day free trial.
此内容由惯性聚合(RSS阅读器)自动聚合整理,仅供阅读参考。 原文来自 — 版权归原作者所有。