










This post is part 3 of a 3-part series on HAProxy monitoring. Part 1 evaluates the key metrics emitted by HAProxy, and Part 2 details how to collect metrics from HAProxy.
If you’ve already read our post on accessing HAProxy metrics, you’ve seen that it’s relatively simple to run occasional spot checks using HAProxy’s built-in tools.
To implement ongoing, meaningful monitoring, however, you will need a dedicated system that allows you to store, visualize, and correlate your HAProxy metrics with the rest of your infrastructure. You also need to be alerted when any system starts to misbehave. In this post, we will show you how to use Datadog to capture and monitor HAProxy logs and all the key metrics identified in Part 1 of this series.
Before you begin, you must verify that HAProxy is set to output metrics. To read more about enabling HAProxy statistics, refer to Part 2 of this series.
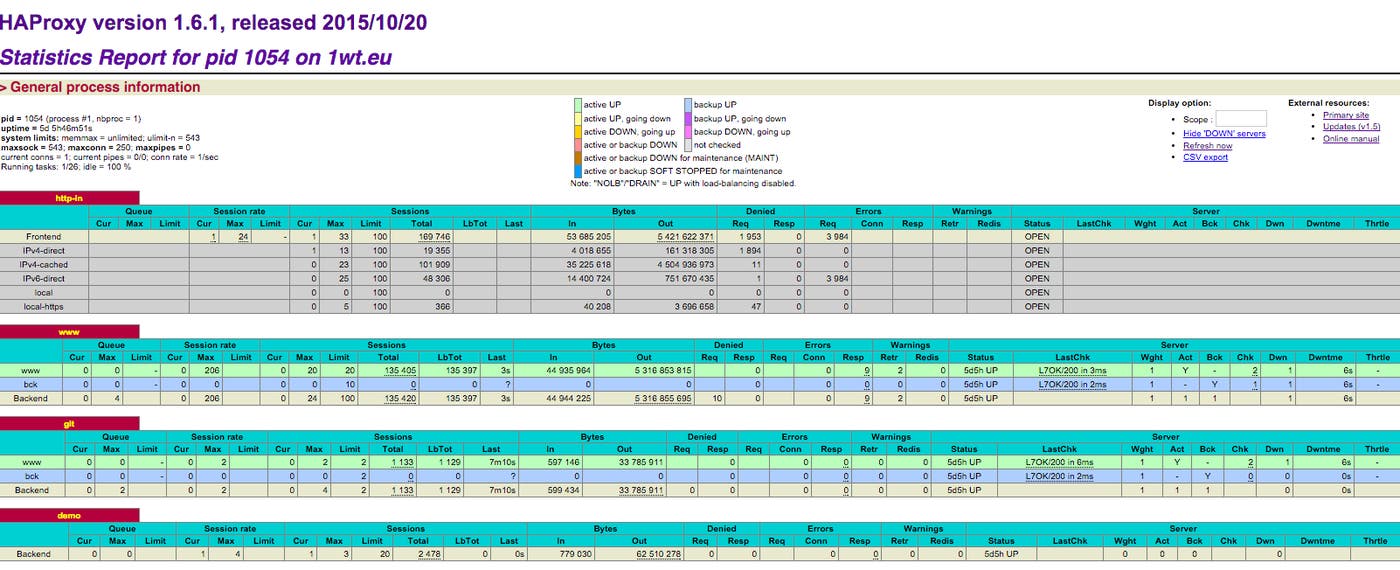
Simply open a browser to the stats URL listed in haproxy.cfg. You should see something like this:
The Datadog Agent is open source software that collects and reports metrics from all of your hosts so you can view, monitor, and correlate them on the Datadog platform. Installing the Agent usually requires just a single command. Installation instructions are platform-dependent and can be found here.
As soon as the Datadog Agent is up and running, you should see your host reporting basic system metrics in your Datadog account.

Next you will need to create an HAProxy configuration file for the Agent. You can find the location of the Agent’s configuration directory for integrations (conf.d) for your OS here. In that directory you will find an haproxy.d subdirectory containing an HAProxy configuration template named conf.yaml.example. Copy this file to conf.yaml. Edit the file to match the username, password, and URL values listed in the stats section of haproxy.cfg.
init_config:
instances:
- url: http://localhost:9000/haproxy_stats
username: Username
password: Password
If you’ve configured HAProxy to report statistics to a Unix socket, you can set url to the socket’s path (e.g., unix:///var/run/haproxy.sock). Run the following command to add the Agent user dd-agent to the haproxy group, so that it will have access to the socket:
gpasswd -a dd-agent haproxy
Save and close the file.
Restart the Agent to load your new configuration. The restart command varies somewhat by platform; see the specific commands for your platform here.
To check that Datadog and HAProxy are properly integrated, execute the Datadog status command. The command for each platform is available here. If the configuration is correct, you will see a section resembling the one below in the status output:
Running Checks
======
[...]
haproxy
-------
Total Runs: 1
Metrics: 80, Total Metrics: 80
Events: 0, Total Events: 0
Service Checks: 3, Total Service Checks: 3
The Service Checks in this snippet report the availability of your HAProxy instance. The Metrics and Events figures show that the Agent is reporting monitoring data to your Datadog account.
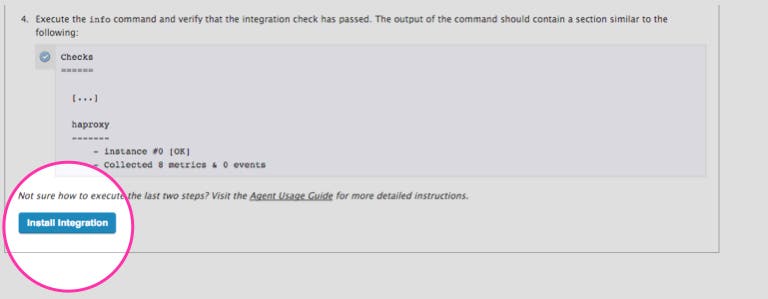
Finally, click the HAProxy Install Integration button inside your Datadog account. The button is located under the Configuration tab in the HAProxy integration settings.
Once the Agent begins reporting metrics, you will see a comprehensive HAProxy dashboard among your list of available dashboards in Datadog.
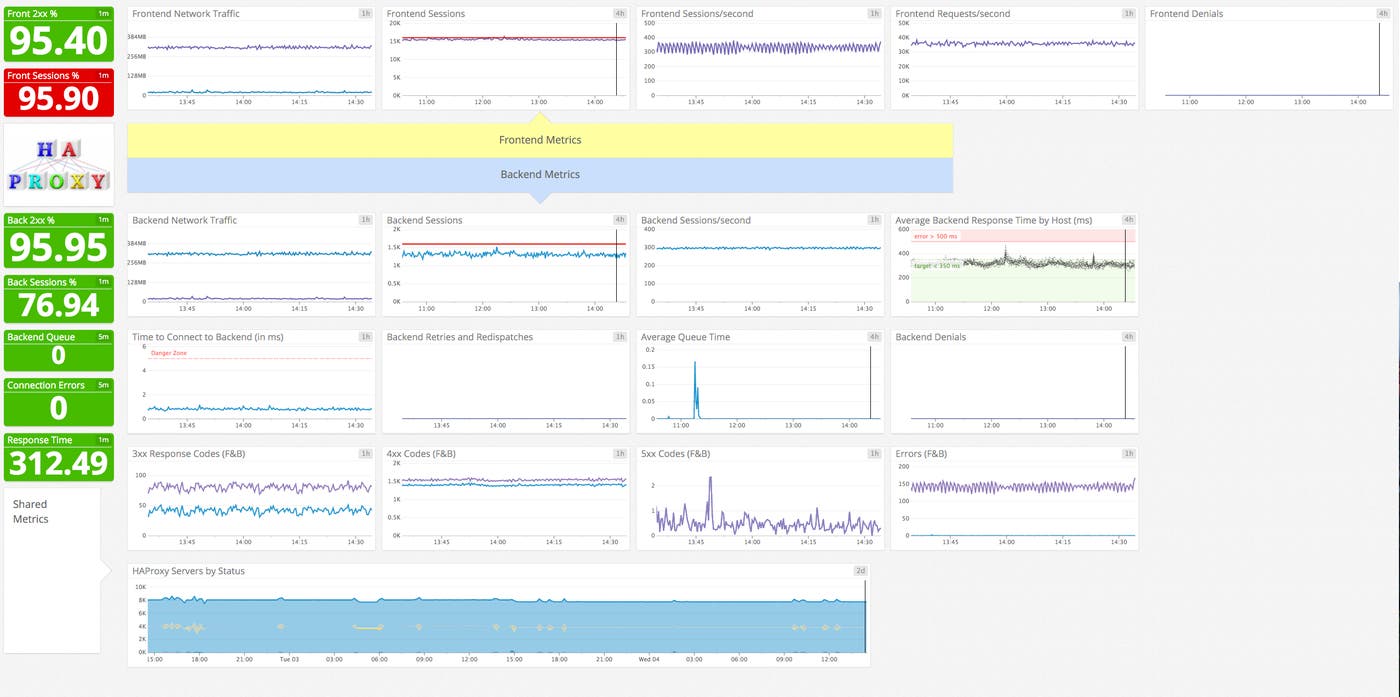
The default HAProxy dashboard, as seen at the top of this article, displays the key metrics highlighted in our introduction to HAProxy monitoring.
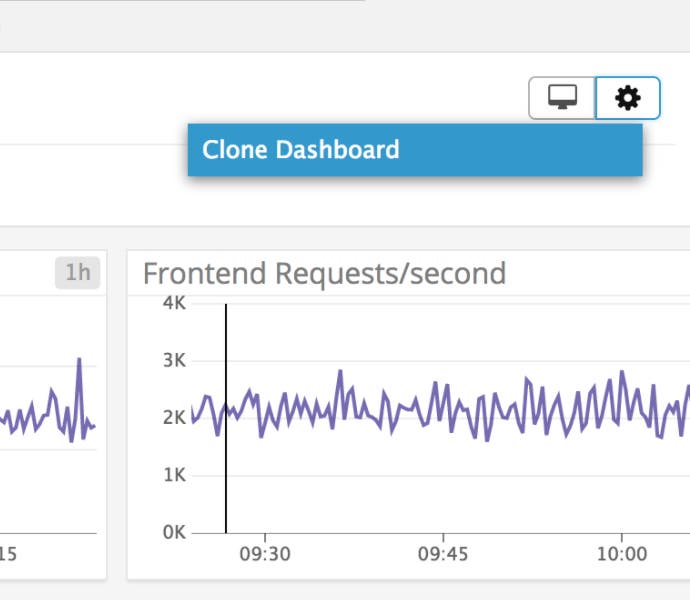
You can easily create a more comprehensive dashboard to monitor HAProxy as well as your entire web stack by adding additional graphs and metrics from your other systems. For example, you might want to graph HAProxy metrics alongside metrics from your NGINX web servers, or alongside host-level metrics such as memory usage on application servers. To start building a custom dashboard, clone the default HAProxy dashboard by clicking on the gear on the upper right of the dashboard and selecting Clone Dashboard.
With Datadog’s log management features you can automatically collect HAProxy logs and view them in your Datadog account. This section describes how to configure HAProxy and the Datadog Agent to collect logs, and how to view log data within Datadog.
Below is a sample haproxy.cfg file you can use to configure your HAProxy logging. This file specifies the httplog format, so logs will include expanded information about each request, including status codes, header information, and cookies. (For more information about the HTTP log format, see HAProxy’s log documentation.)
This sample file also shows a load balancer configuration, which we’ll reference below to illustrate the log data generated by HAProxy. This configuration includes a frontend named my-frontend and a backend group named servers, which contains only one server. Note the <MY_IP> placeholder, which should be replaced with the public IP address of your backend server.
global
log /dev/log local0
user haproxy
group haproxy
defaults
mode http
log global
option httplog
option dontlognull
option redispatch
retries 3
timeout connect 10s
timeout client 300s
timeout server 300s
frontend my-frontend
bind *:80
default_backend servers
log global
backend servers
balance roundrobin
server wp1 <MY_IP>:80 check
log global
mode http
listen stats
bind :9000 # Listen on localhost:9000
mode http
stats enable # Enable stats page
stats hide-version # Hide HAProxy version
stats realm Haproxy\ Statistics # Title text for popup window
stats uri /haproxy_stats # Stats URI
stats auth Username:Password # Credentials must match conf.yaml
You can learn more about HAProxy’s configuration file here.
Next, create the file where HAProxy will write logs, and set the proper permissions. If your system uses a logging program other than rsyslog, you’ll need to adjust accordingly:
touch /var/log/haproxy.log
chown syslog:adm /var/log/haproxy.log
chmod 644 /var/log/haproxy.log
The HAProxy installation process should have created a file telling rsyslog where to write HAProxy logs. If your system doesn’t have the file /etc/rsyslog.d/49-haproxy.conf, create it and add these lines:
local0.* /var/log/haproxy.log
& stop
Restart rsyslog so it’s ready to write to the log file. The command to restart differs between systems using upstart and those using systemd. If your system uses systemd as its init system, use
sudo systemctl restart rsyslog
If upstart is your init system, use
sudo service rsyslog start
Log collection is disabled in the Agent by default. To enable it, edit the Agent configuration file, datadog.yaml. (The path to the file varies by platform. See the Datadog Agent documentation for more information.) Uncomment the relevant line and set logs_enabled to true:
# Logs agent is disabled by default
logs_enabled: true
Next, edit the configuration that tells the Agent where to find the log data for HAProxy and what metadata to apply. Add the following content to the logs item within haproxy.d/conf.yaml, in the conf.d directory under the Agent’s configuration directory:
logs:
- type: file
path: /var/log/haproxy.log
service: my_haproxy_service
source: haproxy
sourcecategory: http_web_access
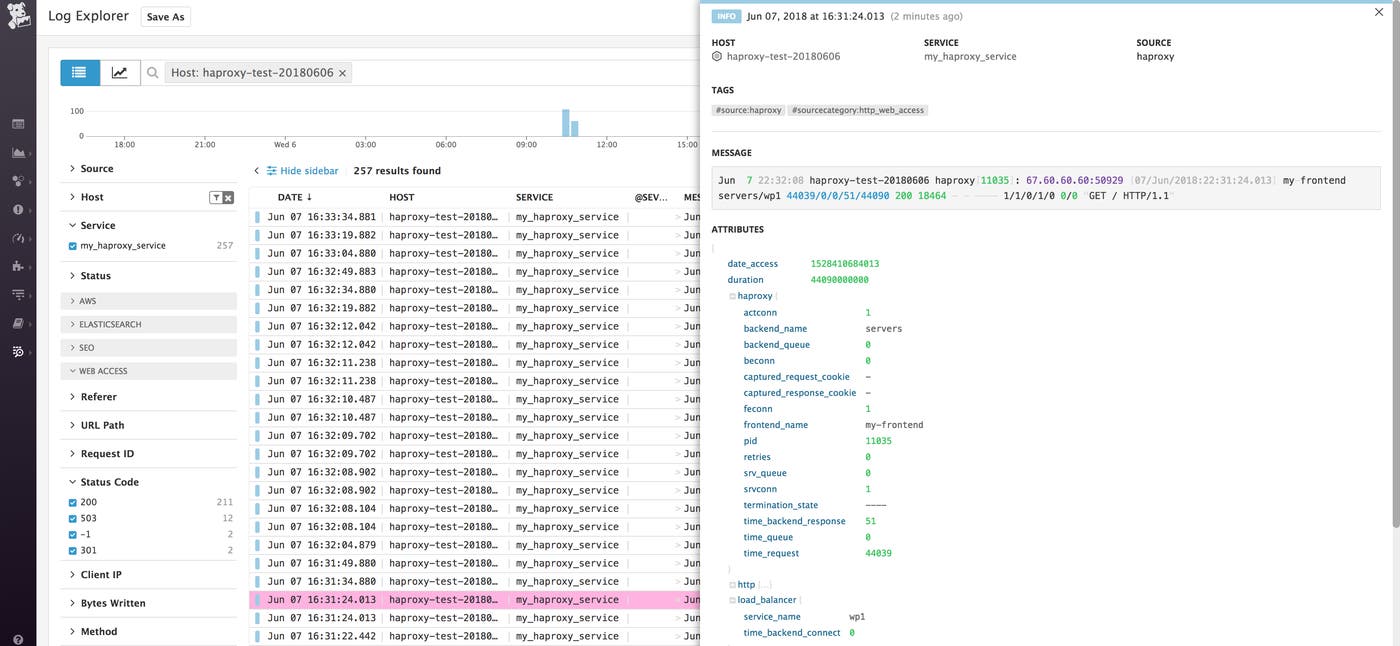
This applies a service name of my_haproxy_service to all the logs generated by this HAProxy instance. It also applies source and sourcecategory tags. The screenshot below shows where this metadata appears in the Log Explorer interface. You can use the Service list in the sidebar to filter log results. Similarly, you can use the search field at the top of the page to filter by tag. See our log management documentation for more information.
Finally, restart HAProxy, then restart the Agent as described in the Agent documentation.
The Log Explorer page in your Datadog account shows logs from all your services that have been configured for log collection. To isolate this service’s logs, click my_haproxy_service under the Service list in the sidebar.
In the image below, the log entry shows metadata about a GET request received by my-frontend and delegated to the servers backend, wp1 service.
You can filter the logs that you receive by optionally specifying a log level in the global section of haproxy.cfg. For example, you could modify the sample config above to log at the info level by changing those lines to read:
global
log /dev/log local0 info
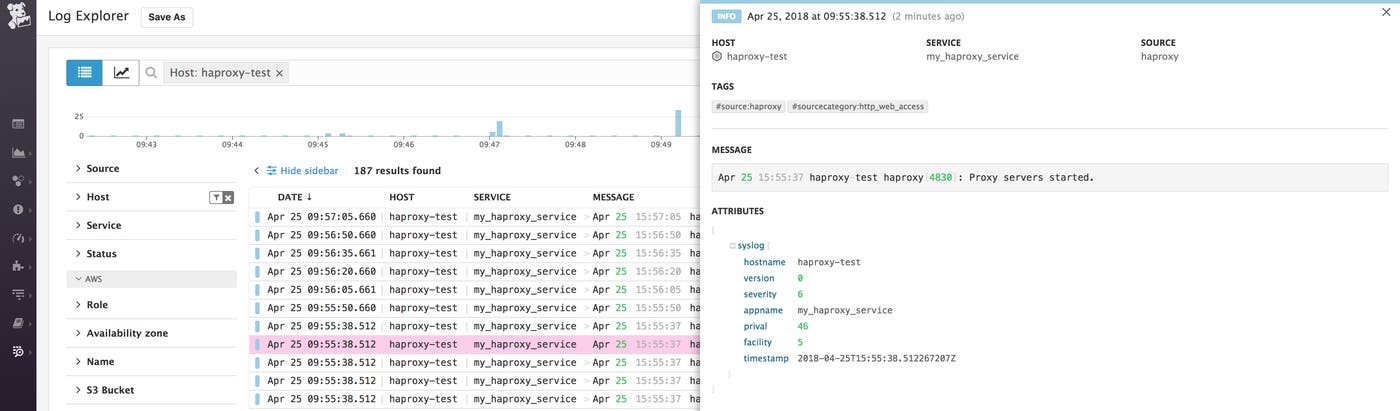
The available log levels are emerg, alert, crit, err, warning, notice, info, and debug. At the debug and notice log levels, you will see log entries created whenever HAProxy fulfills a request. At all levels, your logs will show information about HAProxy starting and shutting down. An example of this type of log entry is shown here:
You can learn more about HAProxy log configuration here.
Once Datadog is capturing and visualizing your metrics, you will likely want to set up some alerts to be automatically notified of potential issues.
With our outlier detection feature, you can get alerted on the things that matter. For example, you can set an alert if a particular backend is experiencing an increase in latency while the others are operating normally.
Datadog can monitor individual hosts, containers, services, processes—or virtually any combination thereof. For instance, you can monitor all of your HAProxy frontends, backends, or all hosts in a certain availability zone, or even a single metric being reported by all hosts with a specific tag.
You can also use HAProxy log information as a basis for your alerts. See our log monitor documentation for guidance on creating your alerts.
In this post we’ve walked you through integrating HAProxy with Datadog to visualize your key metrics and logs, and to notify the right team whenever your infrastructure or application shows signs of trouble.
If you’ve followed along using your own Datadog account, you should now have improved visibility into what’s happening in your environment, as well as the ability to create automated alerts tailored to your infrastructure, your usage patterns, and the metrics that are most valuable to your organization.
If you don’t yet have a Datadog account, you can sign up for a free trial and start monitoring HAProxy right away.
此内容由惯性聚合(RSS阅读器)自动聚合整理,仅供阅读参考。 原文来自 — 版权归原作者所有。