


Istio is a service mesh that enables teams to manage traffic in distributed workloads without modifying the workloads themselves, making it easier to implement load balancing, canarying, circuit breakers, and other design choices. Versions of Istio prior to 1.5 adopted a microservices architecture and deployed each Istio component as an independently scalable Kubernetes pod. Version 1.5 signalled a change in course, moving all of its components into a single binary, istiod.
If you’ve recently upgraded to monolithic versions of Istio—or if you’ve recently deployed your services to an Istio-based service mesh—you’ll want to ensure that you have comprehensive visibility into istiod and all the services running in your mesh. In this post, we’ll explain:
Key metrics for monitoring istiod
How to monitor istiod with out-of-the-box tools
How to monitor istiod with Datadog
Istio’s move to a monolithic architecture has two main implications for monitoring. First, you’ll need to monitor a single component, istiod, rather than the old quartet of Galley, Pilot, Mixer, and Citadel. Second, since Istio 1.4.0 removed its telemetry component, Mixer, in favor of Telemetry V2—which generates mesh traffic metrics inside each Envoy proxy—you’ll need to ensure that your environment is configured to collect mesh metrics directly from your Envoy containers.
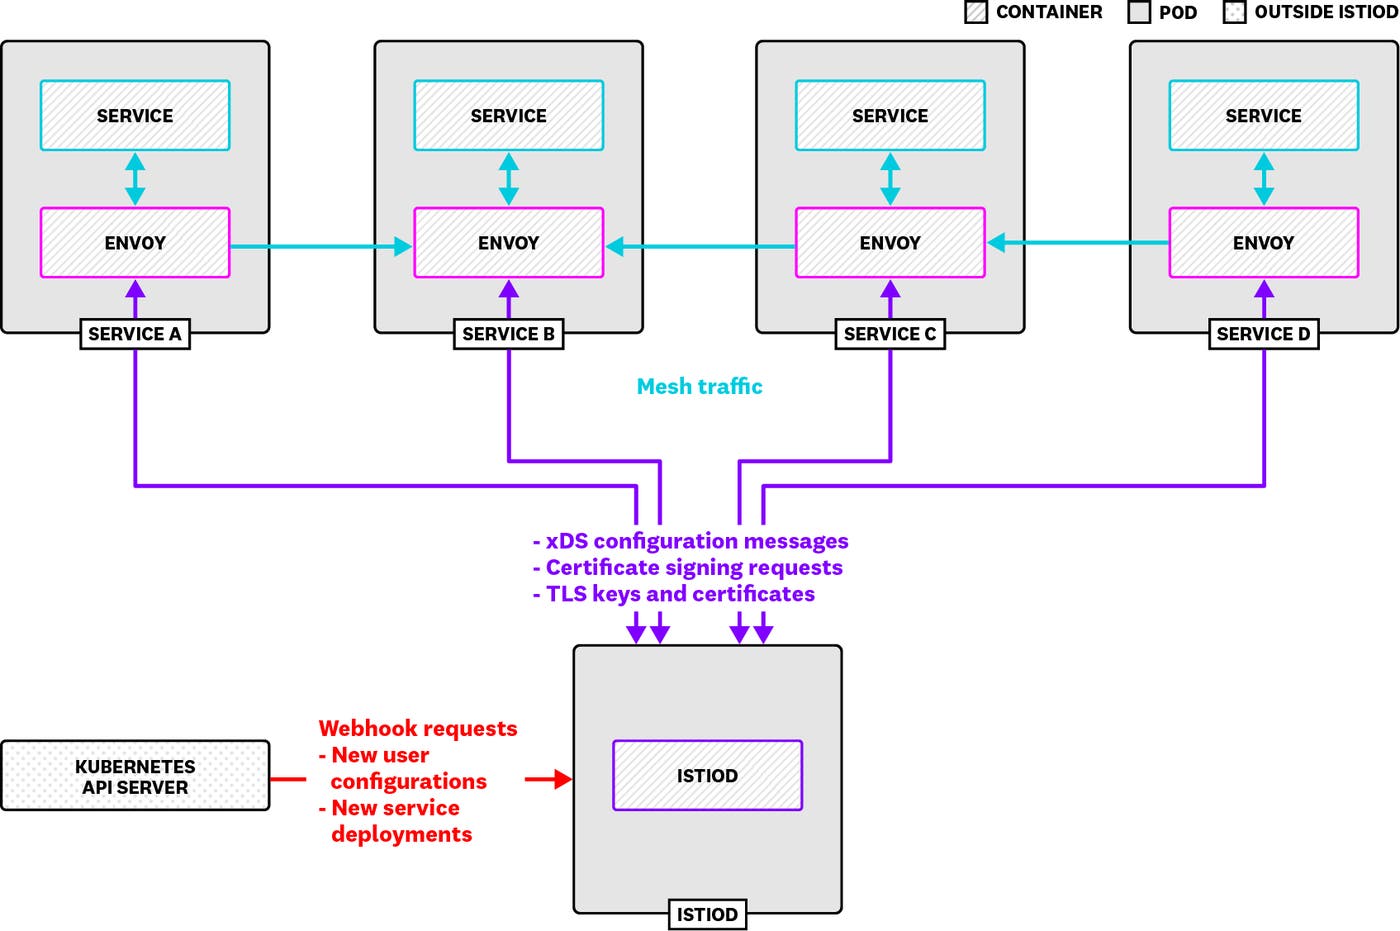
Istio works as a service mesh by deploying an Envoy sidecar to each pod that runs your application workloads. Rather than send traffic directly to one another, application containers route their data through the Envoy sidecars within their local pods, which then route traffic to other sidecars. This means that by sending configurations to the sidecars in your cluster, Istio can dynamically apply changes to traffic routing. This approach decouples inter-service traffic rules from your application code, allowing you to modify the design of your distributed systems using configuration files alone.
istiod manages the Envoy proxies in your mesh, putting your configurations into action. It does this by running four services:
An xDS server: istiod manages the Envoy proxies in your mesh by using Envoy’s xDS protocol to send configurations. It also receives messages from your proxies to discover endpoints, TLS secrets, and other cluster information.
A sidecar injection webhook: Gets notified by the Kubernetes API server when new pods are created and responds by deploying an Envoy proxy as a sidecar on each of those pods.
A configuration validation webhook: Users submit new Istio configurations as Kubernetes manifests. istiod validates these manifests before applying them to your cluster.
A certificate authority: istiod runs a gRPC server that manages TLS for Envoy proxies. It handles certificate signing requests and returns signed certificates and security keys. This enables services in your mesh to communicate securely with minimal manual setup.
In Istio versions prior to 1.5.0, the default configuration profile would collect metrics, traces, and logs from traffic in your mesh via a component called Mixer. An Envoy filter would extract attributes from TCP connections and HTTP requests, and Mixer would transform these attributes, based on user-generated configurations, into data that services like Prometheus could query.
In newer versions of Istio, Envoy proxies collect metrics automatically from the traffic they handle. They use Envoy’s WebAssembly-based plugin system to process data that an Envoy proxy receives through a listener and its filters, and export metrics in Prometheus format. Rather than collect metrics from Mixer pods, clients use Kubernetes’ built-in service discovery to query Envoy proxies directly.
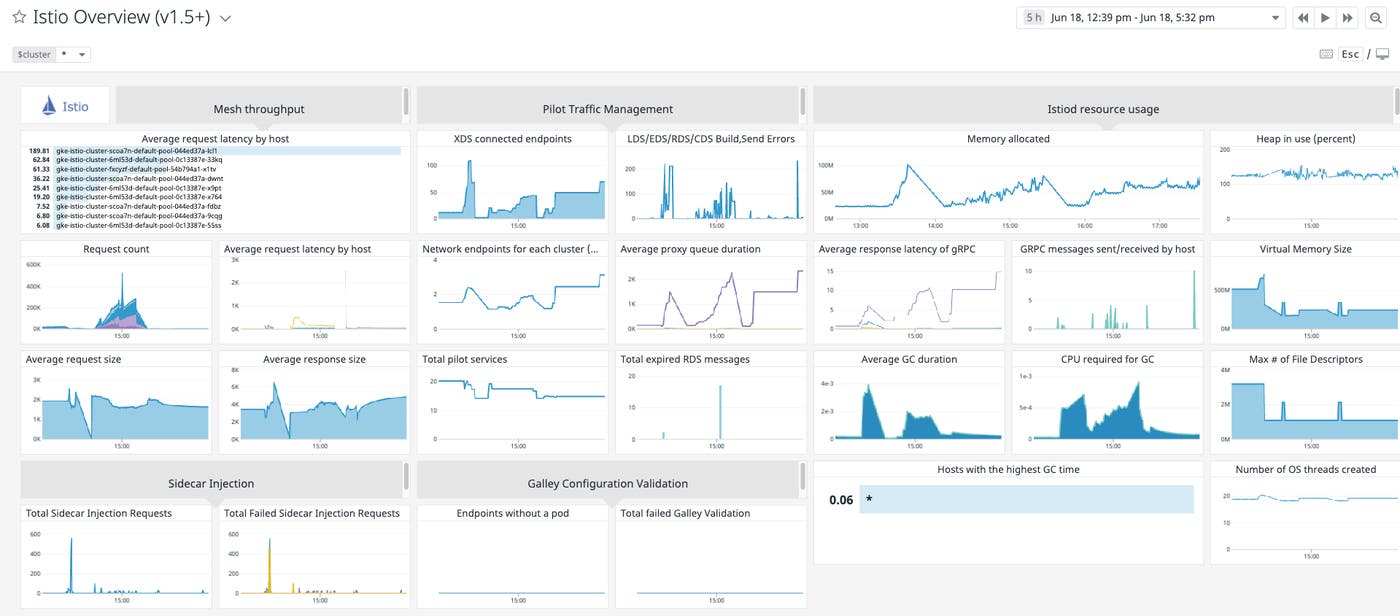
To understand the health and performance of your Istio mesh, you should monitor istiod alongside the services it manages. Changes in per-service metrics, such as a service suddenly losing most of its request traffic, can indicate that your Istio routing configuration could use a second look. And changes in istiod metrics can either indicate shifting demand on istiod—more requests to the certificate authority, more frequent user configuration changes, and so on—or issues with the health of your istiod pods (e.g., they become unschedulable because of node-level resource constraints). The metrics you should monitor include:
Istio mesh metrics
istiod metrics
Throughout this post, we’ll refer to terminology we introduced in our Monitoring 101 series.
Since Istio’s service mesh functionality is based on a cluster of Envoy proxies, you should track the throughput and latency of traffic through each proxy to understand how Istio is applying your configurations and when you should make changes. And even when Istio is performing as expected, these metrics can help you observe traffic in your cluster and oversee canary deployments, scaling events, and other potentially risky operations.
| Name | Description | Metric type | Availability |
|---|---|---|---|
| istiorequeststotal | Number of HTTP requests received by an Envoy proxy | Work: Throughput | Envoy metrics plugin |
| istiorequestduration_milliseconds | How long it takes an Envoy proxy to process an HTTP request | Work: Performance | Envoy metrics plugin |
| istioresponsebytes | The size of the HTTP response bodies that an Envoy proxy has processed | Work: Throughput | Envoy metrics plugin |
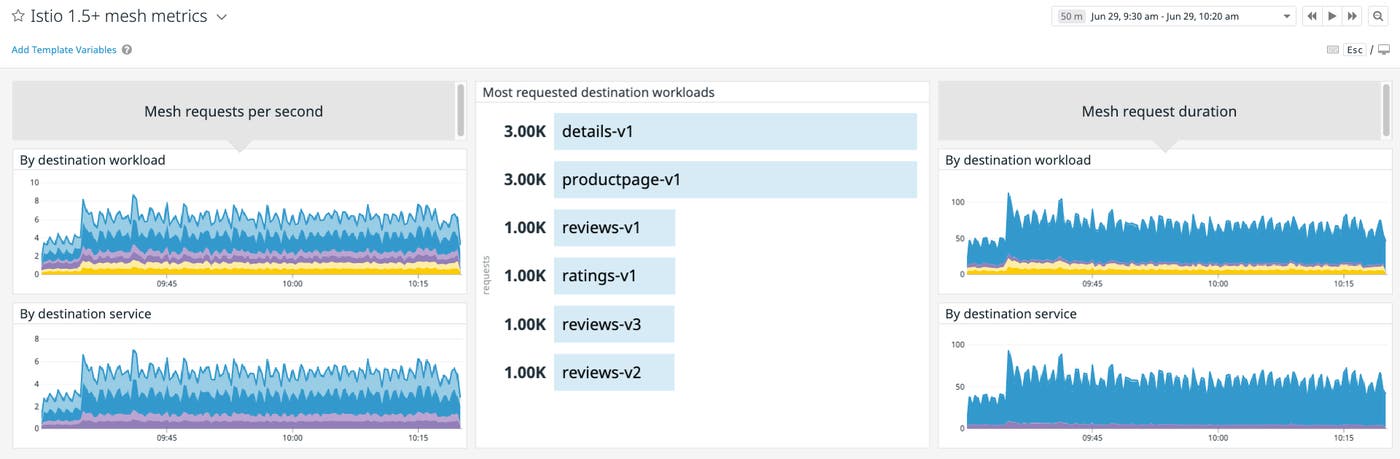
You can understand the overall volume of traffic within your mesh by watching the istio_requests_total metric. Istio tags this metric by origin and destination, indicating which services have received unexpected surges or slumps. You can also use this metric to guide your Istio operations. If you’re canarying a service, for example, you can check whether one version of the service is successfully handling traffic at a low volume before configuring Istio to make that volume higher. istio_requests_total is a Prometheus counter, and will only ever increase—you should track this metric as a rate.
istio_request_duration_milliseconds and istio_response_bytes are useful for optimizing performance and troubleshooting issues. Unexpectedly low values of these metrics can indicate an issue with your service backends, which could be returning error messages or failing to fetch the requested data, even if they are also returning response codes of 200. You can investigate especially high latencies within certain services for bugs, errors, or opportunities to optimize.
Higher-than-normal response payloads aren’t necessarily problematic, but you should correlate these with downstream resource consumption and response latency. You may need to use Istio’s built-in circuit breaking feature to give downstream services time to process heavy payloads by limiting the number of concurrent requests they can handle.
| Name | Description | Metric type | Availability |
|---|---|---|---|
| istiotcpreceivedbytestotal | Bytes of TCP traffic an Envoy proxy has received from a listener | Work: Throughput | Envoy metrics plugin |
| istiotcpconnectionsopenedtotal | Number of TCP connections the listener has opened | Work: Throughput | Envoy metrics plugin |
| istiotcpconnectionsclosedtotal | Number of TCP connections the listener has closed | Other | Envoy metrics plugin |
If you’ve configured Istio to route traffic between TCP services such as message brokers, databases, and other critical infrastructure components, you’ll want to track two key measures of TCP throughput: istio_tcp_received_bytes_total, and the difference between istio_tcp_connections_opened_total and istio_tcp_connections_closed_total. The latter can show you whether the number of client connections is increasing, decreasing, or staying the same. These metrics can help you determine how to configure your TCP services within Istio: whether to add more replicas to your database, more producers or consumers for your message broker, and so on.
istiod runs several services concurrently, and you should monitor each of them to ensure that Istio is functioning as expected. If your istiod pods are being overloaded, or Istio isn’t managing your cluster as it should, you can use these metrics to see which istiod components to investigate first. istiod’s metrics are available via a single Prometheus instance.
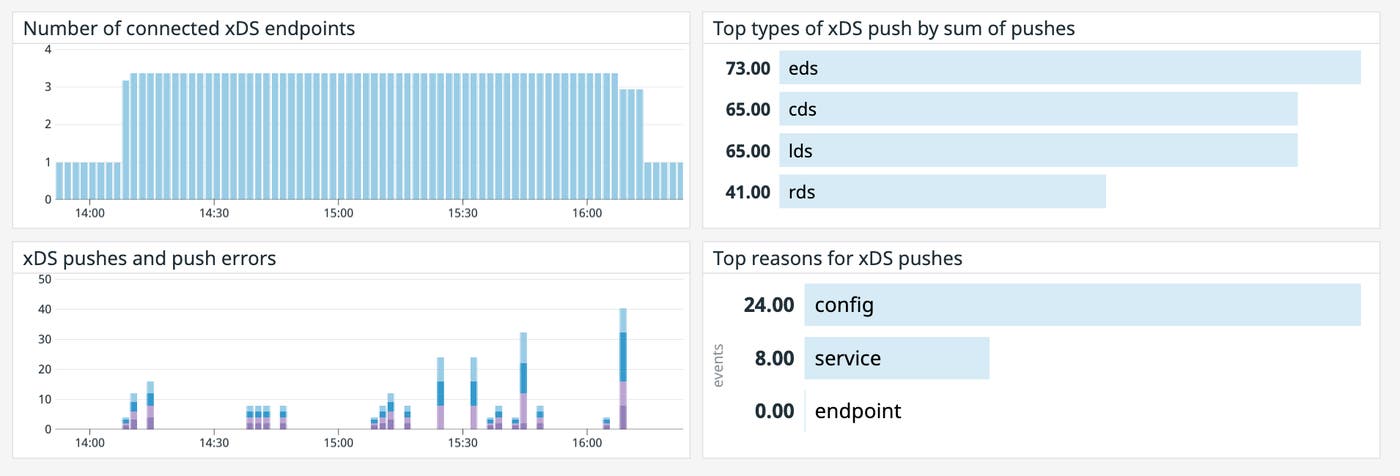
istiod needs to communicate with every Envoy proxy in your cluster in order to keep mesh configurations up to date. You will want to monitor istiod’s xDS server in order to ensure that interactions with clients take place smoothly. Prior to version 1.5.0, Istio’s xDS server ran as a microservice called Pilot, which newer versions still mention within some metrics.
| Name | Description | Metric type | Availability |
|---|---|---|---|
| pilot_xds | Count of concurrent connections to istiod’s xDS server | Other | istiod Prometheus instance |
| pilotxdspushes | Count of xDS messages sent, as well as errors sending xDS messages | Work: Throughput, Errors | istiod Prometheus instance |
| pilotproxyconvergence_time | The time it takes istiod to push new configurations to Envoy proxies (in milliseconds) | Work: Performance | istiod Prometheus instance |
| pilotpushtriggers | Count of events in which xDS pushes were triggered | Work: Throughput | istiod Prometheus instance |
You can track pilot_xds—istiod’s current number of xDS clients—to understand the overall demand on istiod from proxies in your mesh. You should also track pilot_xds_pushes, the rate of xDS pushes, plus any errors in sending xDS-based configurations—use the type label to group this metric by error or xDS API. (Note that as of Istio 1.6.0, errors with building xDS messages no longer reach users, since validation now takes place in Istio’s development environment.)
You should check whether pilot_xds_pushes and pilot_xds correlate with high CPU and memory utilization on your istiod hosts. Istio’s benchmarks show the best performance when each istiod pod supports fewer than 1,000 services and 2,000 sidecars per 1 vCPU and 1.5 GB of memory.
If xDS pushes are too frequent, check the metric pilot_push_triggers, which Istio introduced in version 1.5.0. istiod increments this metric when it initiates a push. This metric includes a type label that indicates the reason for triggering the push. For example, a type of endpoint indicates that istiod triggered the push when it discovered a change in your cluster’s service endpoints, while config indicates a manual configuration change.
To track istiod’s performance in implementing xDS, use the pilot_proxy_convergence_time metric, which measures the time (in milliseconds) it takes istiod to push new configurations to Envoy proxies in your mesh. The more configuration data istiod has to process into xDS messages, the longer this operation will take. To improve performance, you can consider breaking your configurations into smaller chunks or scaling istiod.
Istio automatically injects Envoy sidecars into your service pods by using a mutating admission webhook. Whereas prior versions of Istio ran the webhook from a dedicated istio-sidecar-injector deployment, recent versions of Istio run it within istiod.
When you create a pod in your Istio cluster, the sidecar injection webhook intercepts the request to the Kubernetes API server and changes the pod configuration to deploy a sidecar. You can track this process using the following metrics. (Note that you can also inject sidecars manually to modify Kubernetes deployment manifests you have already applied. Istio’s sidecar injection metrics are only available for the automatic method.)
| Name | Description | Metric type | Availability |
|---|---|---|---|
| sidecarinjectionrequests_total | Count of requests to the sidecar injection webhook | Work: Throughput | istiod Prometheus instance |
| sidecarinjectionfailure_total | Count of requests to the sidecar injection webhook that ended in an error | Other | istiod Prometheus instance |
| sidecarinjectionsuccess_total | Count of requests to the sidecar injection webhook that completed without any errors | Other | istiod Prometheus instance |
istiod increments the sidecar_injection_requests_total metric every time the sidecar injection webhook receives a request. Because this metric indicates when Kubernetes is deploying new services, it can help with troubleshooting availability and performance issues in your Istio mesh. Since sidecars need time to spin up, you can check whether spikes in this metric correlate with changes in mesh metrics, such as a decline in per-service request throughput.
High sidecar injection throughput shouldn’t affect istiod’s resource utilization unless pod churn is particularly massive—for example, if you’re running blue/green deployments that regularly scale your staging environment to full production size.
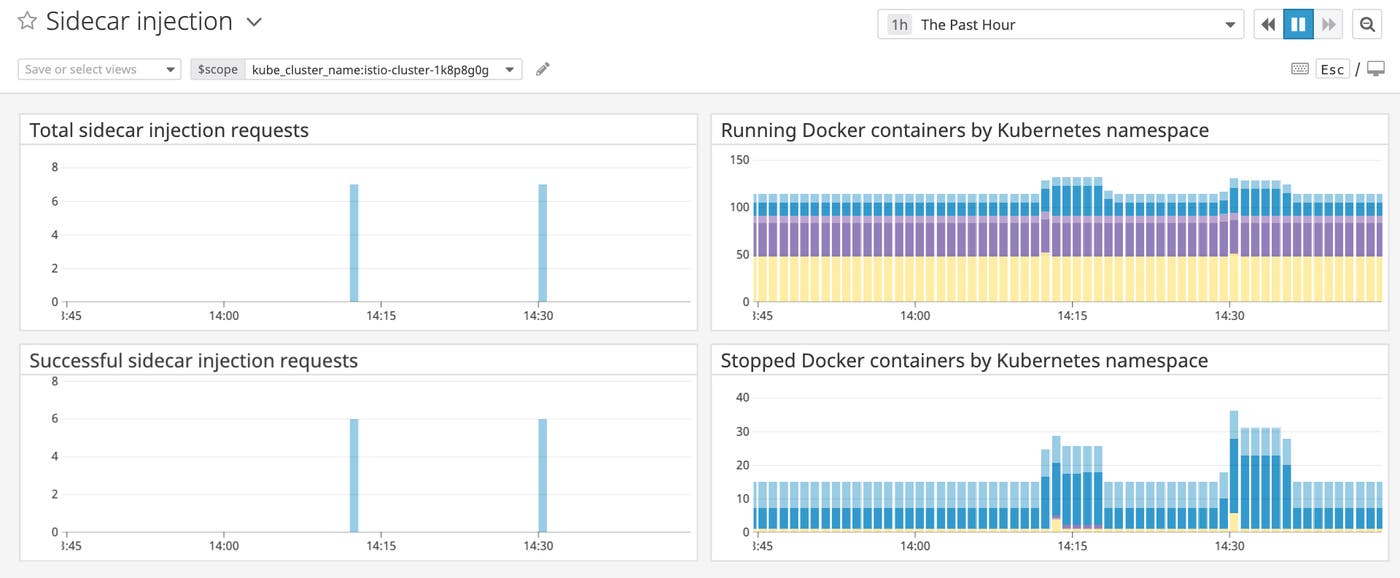
You can also track sidecar injection metrics to spot any issues with deploying proxies to your pods. If the sidecar injection webhook encounters an error while processing a request, you’ll see an increase in sidecar_injection_failure_total and an error log explaining the issue. Error-free requests increment sidecar_injection_success_total.
If successes are lagging behind the total count of webhook requests, but you’re not seeing an increase in failed injections, the webhook could be skipping the injection. This could be because your pod is exposed to the host’s network, or a deployment has disabled automatic sidecar injection using the sidecar.istio.io/inject annotation.
istiod runs Istio’s certificate authority (CA), which issues TLS certificates and keys to Envoy proxies in response to certificate signing requests (CSRs). Since istiod’s role as a CA is crucial to implementing TLS within your Istio services, you should make sure that istiod is issuing certificates successfully.
| Name | Description | Metric type | Availability |
|---|---|---|---|
| istio.grpc.server.grpcserverstarted_total | Certificate-related messages received by the gRPC server | Work: Throughput | istiod Prometheus instance |
| istio.grpc.server.msgreceivedtotal | Certificate-related messages streamed to the server’s business logic | Work: Throughput | istiod Prometheus instance |
| istio.grpc.server.msgsenttotal | Certificate-related messages streamed by the server’s business logic to clients | Work: Throughput | istiod Prometheus instance |
| istio.grpc.server.grpcserverhandled_total | Certificate-related messages fully handled by the server | Work: Throughput | istiod Prometheus instance |
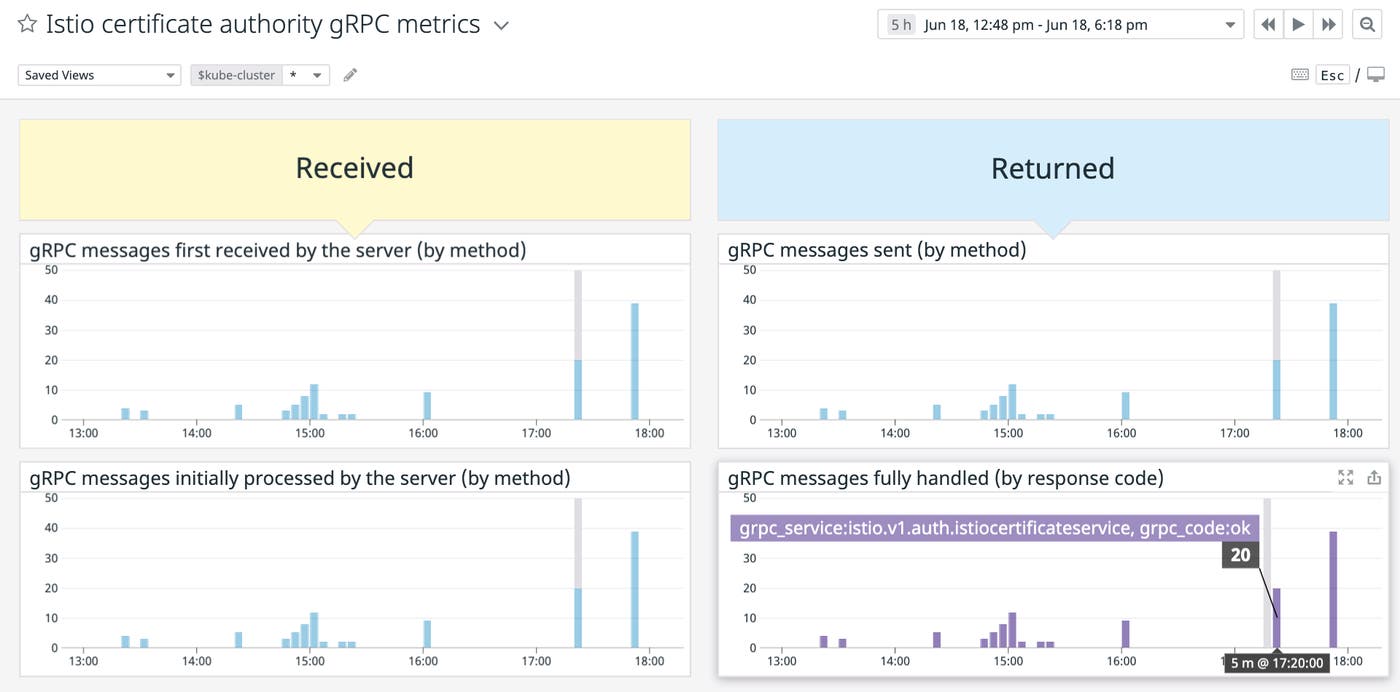
Istio’s certificate authority reports metrics through a generic gRPC interceptor for Prometheus. Since istiod also uses the Prometheus interceptor for monitoring gRPC traffic through its xDS server, you can scope these metrics to the istiod certificate authority by using the tag grpc_service:istio.v1.auth.istiocertificateservice.
The Prometheus interceptor increments counters for gRPC metrics based on a four-stage lifecycle. When a certificate authority client invokes an RPC method on the server, the server increments istio.grpc.server.grpc_server_started_total. Messages streamed by the client to the server after that initial invocation increment istio.grpc.server.msg_received_total. Any responses the server streams in return, such as error messages, increment istio.grpc.server.msg_sent_total. Finally, once the server has finished processing a method invocation, it increments istio.grpc.server.grpc_server_handled_total—which contains the gRPC response code as a label.
You can group all of these metrics by grpc_method to see which operations clients are performing most frequently, helping you understand the possible causes of issues. A spike in invocations of the createcertificate method, for example, probably indicates that new services are spinning up in your cluster.
You can use the CA’s gRPC metrics to see how much demand your mesh is placing on the server. Like istiod’s xDS server, load on the CA will increase as you add more services to the mesh. You can also use the grpc_code label to filter the istio.grpc.server.grpc_server_handled_total metric. For example, a response code of OK means that the RPC was successful. A code of INTERNAL means that the server has encountered an error—istiod returns this if the CA is not yet ready or cannot generate a certificate. You might also see the UNAVAILABLE code if the server is, for instance, closing its connection, and UNAUTHENTICATED if the caller is not authorized to perform the call.
istiod validates new Istio configurations through a validating admission webhook that listens for newly applied manifests for Istio resources from the Kubernetes API server. Like metrics for other istiod components, you should track these to understand how much work istiod is performing, and whether it has encountered any issues with managing your mesh. (Note that versions of Istio prior to 1.5.0 validated new configurations from a microservice called Galley, which still appears in the metric names across some recent versions.)
| Name | Description | Metric type | Availability |
|---|---|---|---|
| galleyvalidationfailed | Count of validations failed by the configuration validation webhook | Other | istiod Prometheus instance |
| galleyvalidationpassed | Count of validations passed by the configuration validation webhook | Work: Throughput | istiod Prometheus instance |
If you apply new Istio configurations at a high volume—e.g., you’re canarying multiple services while deploying continuously throughout the day—you will want to track Istio’s configuration validation metrics to understand the overall success of your configuration changes, and whether these correlate with any issues in your mesh, such as losses of traffic to certain services.
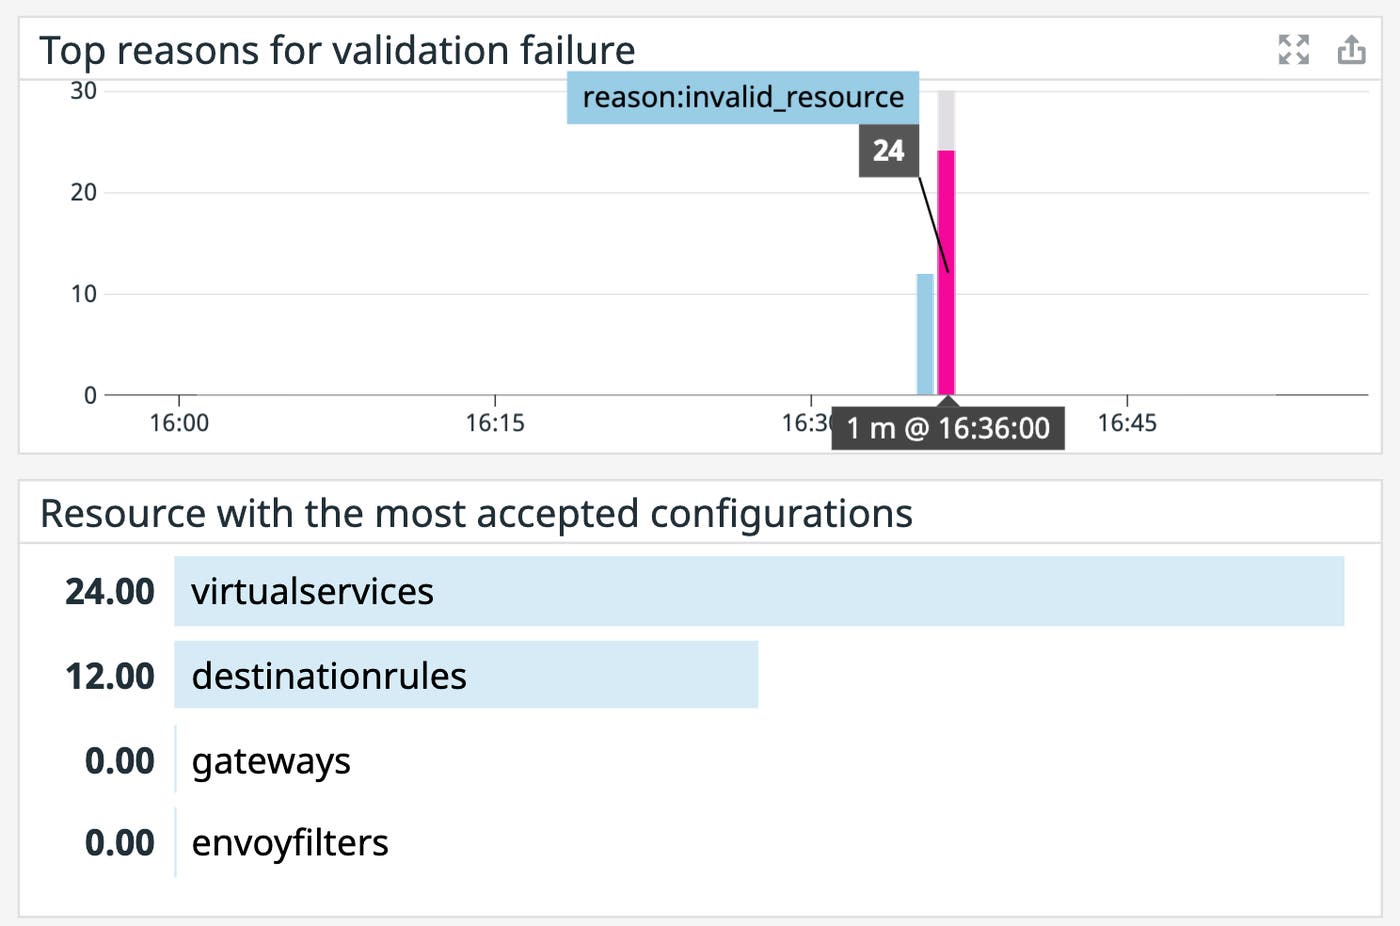
The webhook will fail a validation—and increment galley_validation_failed—if the configuration itself is invalid: if it can’t parse the manifest YAML, for example, or if it can’t recognize the type of resource you’re configuring. This metric comes with a reason label that indicates why the validation failed. Keep in mind that the Kubernetes API server also conducts a layer of validation—if it discovers errors before sending a request to the webhook, none of the galley_validation metrics will increment. However, you can locate validation errors from the API server in your Kubernetes audit logs.
While the validation webhook doesn’t increment a throughput metric when it first receives a request, you can track the throughput of Istio’s validation webhook by adding galley_validation_failed and galley_validation_passed—all requests to the validation endpoint end in one of these statuses. (There is also a galley_validation_http_error metric for errors with parsing the webhook request and generating a response, though you shouldn’t see increases in this metric because the Kubernetes API server generates these requests automatically.)
You can use the sum of galley_validation_failed and galley_validation_passed as a general indication of when istiod is validating new configurations. If you see a change in the behavior of your mesh (e.g., a wave of 404 response codes) after a spike in validations, you can inspect your logs for relevant messages. You can consult your istiod logs for validation errors, and your Kubernetes audit logs for new configurations that have passed validation within the API server.
Istio generates telemetry data within istiod and your mesh of Envoy proxies via Prometheus, and you can access this data by enabling several popular monitoring tools that Istio includes as a pre-configured bundle. To get greater detail for ad hoc investigations, you can access istiod and Envoy logs via kubectl, and troubleshoot your Istio configuration with istioctl analyze.
Each Envoy proxy and istiod container in your Istio cluster will run a Prometheus instance that emits the metrics we introduced earlier. You can access istiod metrics at <ISTIOD_CONTAINER_IP>:15014/metrics, and Envoy metrics at <ENVOY_CONTAINER_IP>:15000/stats.
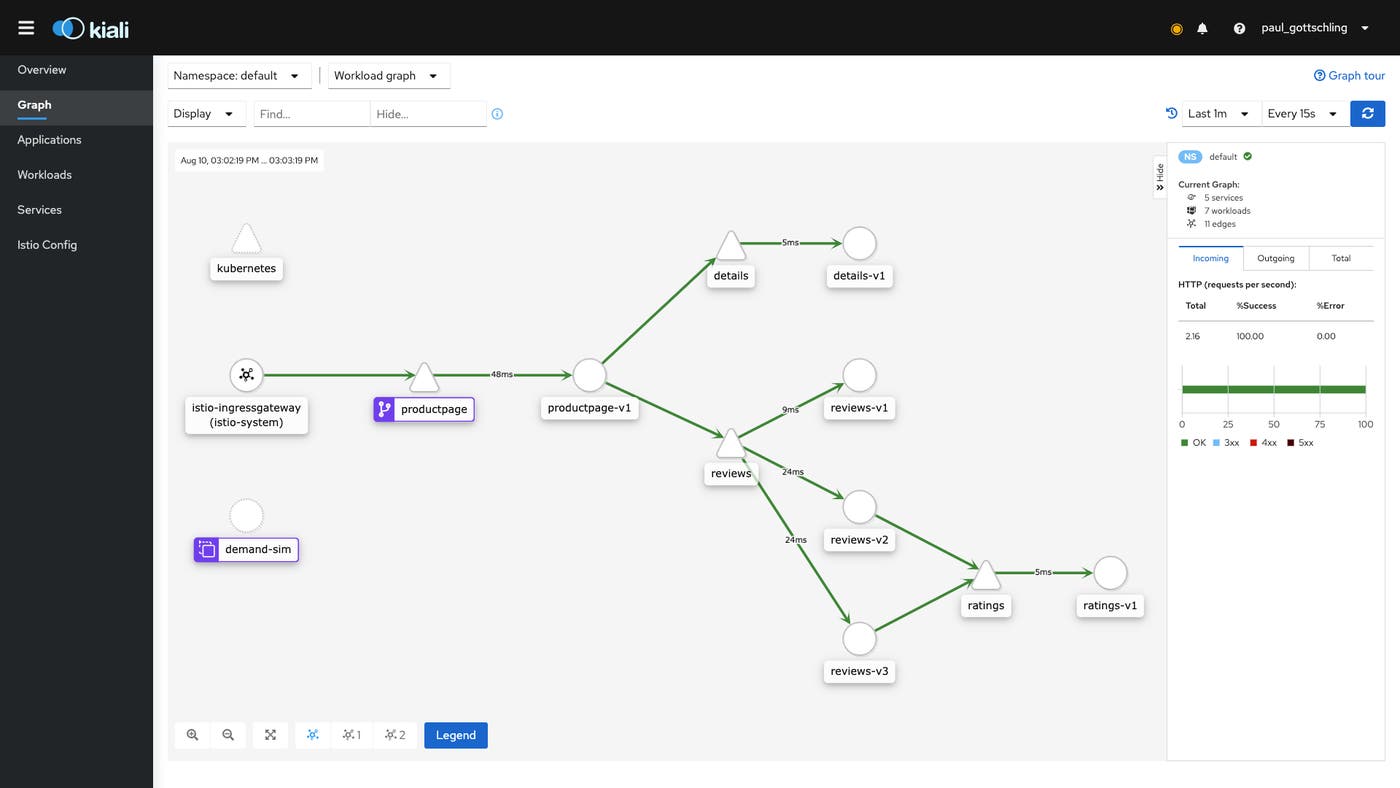
You can quickly set up monitoring for your cluster by enabling Istio’s out-of-the-box add-ons. Istio’s Prometheus add-on uses Kubernetes’ built-in service discovery to fetch the DNS addresses of istiod pods and Envoy proxy containers. You can then open Istio’s Grafana dashboards (which we introduced in Part 2) to visualize metrics for istiod and your service mesh. And if you enable Zipkin or Kiali, you can visualize traces collected from Envoy. This helps you understand your mesh’s architecture and visualize the performance of service-to-service traffic.
Beginning with version 1.4.0, Istio has deprecated Helm as an installation method, and you can install Istio’s monitoring add-ons by using the istioctl CLI. To install the add-ons, run the istioctl install command with one or more --set flags in the following format:
istioctl install --set <KEY1>=<VALUE1> --set <KEY2>=<VALUE2>
The second column in the table below shows the value of the --set flags you should add to enable specific add-ons. Once you’ve enabled an add-on, you can open it by running the command in the third column.
| Add-on | How to enable | How to view |
|---|---|---|
| Prometheus | --set values.prometheus.enabled=true | istioctl dashboard prometheus |
| Grafana | --set values.grafana.enabled=true | istioctl dashboard grafana |
| Kiali | --set values.tracing.enabled=true --set values.kiali.enabled=true | istioctl dashboard kiali |
| Zipkin | --set values.tracing.enabled=true --set values.tracing.provider=zipkin | istioctl dashboard zipkin |
Both istiod and Envoy log error messages and debugging information that you can use to get more context for troubleshooting (we addressed this in more detail in Part 2). istiod publishes logs to stdout and stderr by default. You can access istiod logs with the kubectl logs command, using the -l app=istiod option to collect logs from all istiod instances. The -f flag prints new logs to stdout as they arrive:
kubectl logs -f -l app=istiod -n istio-system
Envoy access logs are disabled by default. You can run the following command to configure Envoy to print its access logs to stdout.
istioctl install --set meshConfig.accessLogFile="/dev/stdout"
To print logs for your Envoy proxies, run the following command:
kubectl logs -f <SERVICE_POD_NAME> -c istio-proxy
If you want to change the format of your Envoy logs and the type of information they include, you can use the --set flag in istioctl install to configure two options. First, you can set global.proxy.accessLogEncoding to JSON (the default is TEXT) to enable structured logging in this format. Second, the accessLogFormat option lets you customize the fields that Envoy prints within its access logs, as we discussed in more detail in Part 2.
If your Istio metrics are showing unexpected traffic patterns, anomalously low sidecar injections, or other issues, you may have misconfigured your Istio deployment. You can use the istioctl analyze command to see if this is the case. To check for configuration issues in all Kubernetes namespaces, run the following command:
istioctl analyze --all-namespaces
The output will be similar to the following:
Warn [IST0102] (Namespace app) The namespace is not enabled for Istio injection. Run 'kubectl label namespace app istio-injection=enabled' to enable it, or 'kubectl label namespace app istio-injection=disabled' to explicitly mark it as not needing injection
Info [IST0120] (Policy grafana-ports-mtls-disabled.istio-system) The Policy resource is deprecated and will be removed in a future Istio release. Migrate to the PeerAuthentication resource.
Error: Analyzers found issues when analyzing all namespaces.
See https://istio.io/docs/reference/config/analysis for more information about causes and resolutions.
In this case, the first warning explains why mesh metrics are missing in the app namespace: because we have not yet enabled sidecar injection. After enabling automatic sidecar injection for the app namespace, we can watch our sidecar injection metrics to ensure our configuration is working.
Datadog gives you comprehensive visibility into the health and performance of your mesh by enabling you to visualize and alert on all the data that Istio generates within a single platform. This makes it easy to navigate between metrics, traces, and logs, and to set intelligent alerts. In this section, we’ll show you how to monitor istiod with Datadog.
Datadog monitors your Istio deployment through a collection of Datadog Agents, which are designed to maximize visibility with minimal overhead. One Agent runs on each node in your cluster, and gathers metrics, traces, and logs from local Envoy and istiod containers. The Cluster Agent passes cluster-level metadata from the Kubernetes API server to the node-based Agents along with any configurations needed to collect data from Istio. This enables node-based Agents to get comprehensive visibility into your Istio cluster, and to enrich metrics with cluster-level tags.
We recommend that you install the Datadog Agents within your Istio cluster using the Datadog Operator, which tracks the states of Datadog resources, compares them to user configurations, and applies changes accordingly. In this section, we will show you how to:
Deploy the Datadog Operator
Annotate your Istio services so the Datadog Agents can discover them
Before you deploy the Datadog Operator, you should create a Kubernetes namespace for all of your Datadog-related resources. This way, you can manage them separately from your Istio components and mesh services, and exempt your Datadog resources from Istio’s automatic sidecar injection.
Run the following command to create a namespace for your Datadog resources:
kubectl apply -f - <<EOF
{
"apiVersion": "v1",
"kind": "Namespace",
"metadata": {
"name": "datadog",
"labels": {
"name": "datadog"
}
}
}
EOF
Next, create a manifest called dd_agent.yaml that the Datadog Operator will use to install the Datadog Agents. Note that you’ll only need to provide the keys below the spec section of a typical Kubernetes manifest (the Operator installation process will fill in the rest):
credentials:
apiKey: "<DATADOG_API_KEY>" # Fill this in
appKey: "<DATADOG_APP_KEY>" # Fill this in
# Node Agent configuration
agent:
image:
name: "datadog/agent:latest"
config:
# The Node Agent will tolerate all taints, meaning it can be deployed to
# any node in your cluster.
# https://kubernetes.io/docs/concepts/scheduling-eviction/taint-and-toleration/
tolerations:
- operator: Exists
# Cluster Agent configuration
clusterAgent:
image:
name: "datadog/cluster-agent:latest"
config:
metricsProviderEnabled: true
clusterChecksEnabled: true
# We recommend two replicas for high availability
replicas: 2
You’ll need to include your Datadog API key within the manifest. You won’t have to provide an application key to collect data from Istio, but one is required if you want the Datadog Operator to send data to Datadog for troubleshooting Datadog Agent deployments. You can find your API and application keys within Datadog. Once you’ve created your manifest, use the following helm (version 3.0.0 and above) and kubectl commands to install and configure the Datadog Operator:
helm repo add datadog https://helm.datadoghq.com
helm install -n datadog my-datadog-operator datadog/datadog-operator
kubectl -n datadog apply -f "dd_agent.yaml" # Configure the Operator
The helm install command uses the -n datadog flag to deploy the Datadog Operator and the resources it manages into the datadog namespace we created earlier.
After you’ve installed the Datadog Operator, it will deploy the node-based Agents and Cluster Agent automatically.
$ kubectl get pods -n datadog
NAME READY STATUS RESTARTS AGE
datadog-datadog-operator-5656964cc6-76mdt 1/1 Running 0 1m
datadog-operator-agent-hp8xs 1/1 Running 0 1m
datadog-operator-agent-ns6ws 1/1 Running 0 1m
datadog-operator-agent-rqhmk 1/1 Running 0 1m
datadog-operator-agent-wkq64 1/1 Running 0 1m
datadog-operator-cluster-agent-68f8cf5f9b-7qkgr 1/1 Running 0 1m
datadog-operator-cluster-agent-68f8cf5f9b-v8cp6 1/1 Running 0 1m
The node-based Datadog Agents are pre-configured to track Envoy containers running on their local hosts. This means that Datadog will track mesh metrics from your services as soon as you have deployed the node-based Agents.
Since Kubernetes can schedule istiod and service pods on any host in your cluster, the Datadog Agent needs to track the containers running the relevant metrics endpoints—no matter which pods run them. We’ll show you how to configure Datadog to use endpoints checks, which collect metrics from the pods that back the istiod Kubernetes service. With endpoints checks enabled, the Cluster Agent ensures that each node-based Agent is querying the istiod pods on its local host. The Cluster Agent then populates an Istio Autodiscovery template for each node-based Agent.
The Datadog Cluster Agent determines which Kubernetes services to query by extracting configurations from service annotations. It then fills in the configurations with up-to-date data from the pods backing these services. You can configure the Cluster Agent to look for the istiod service by running the following script (note that the service you’ll patch is called istio-pilot in version 1.5.x and istiod in version 1.6.x.):
kubectl -n istio-system patch service <istio-pilot|istiod> --patch "$(cat<<EOF
metadata:
annotations:
ad.datadoghq.com/endpoints.check_names: '["istio"]'
ad.datadoghq.com/endpoints.init_configs: '[{}]'
ad.datadoghq.com/endpoints.instances: |
[
{
"istiod_endpoint": "http://%%host%%:15014/metrics",
"send_histograms_buckets": true
}
]
EOF
)"
The ad.datadoghq.com/endpoints.instances annotation includes the configuration for the Istio check. Once the istiod service is annotated, the Cluster Agent will dynamically fill in the %%host%% variable with the IP address of each istiod pod, then send the resulting configuration to the Agent on the node where that pod is running. After applying this change, you’ll see istiod metrics appear within Datadog.
Datadog helps you monitor metrics for istiod, Envoy, and 1,000+ integrations, giving you insights into every component of your Istio cluster. For example, you can create a dashboard that visualizes request rates from your mesh alongside Kubernetes resource utilization (below), as well as metrics from common Kubernetes infrastructure components like Harbor and CoreDNS. Istio’s most recent benchmark shows that Envoy proxies consume 0.6 vCPU for every 1,000 requests per second—to ensure that all services remain available, you should keep an eye on per-node resource utilization as you deploy new services or scale existing ones.
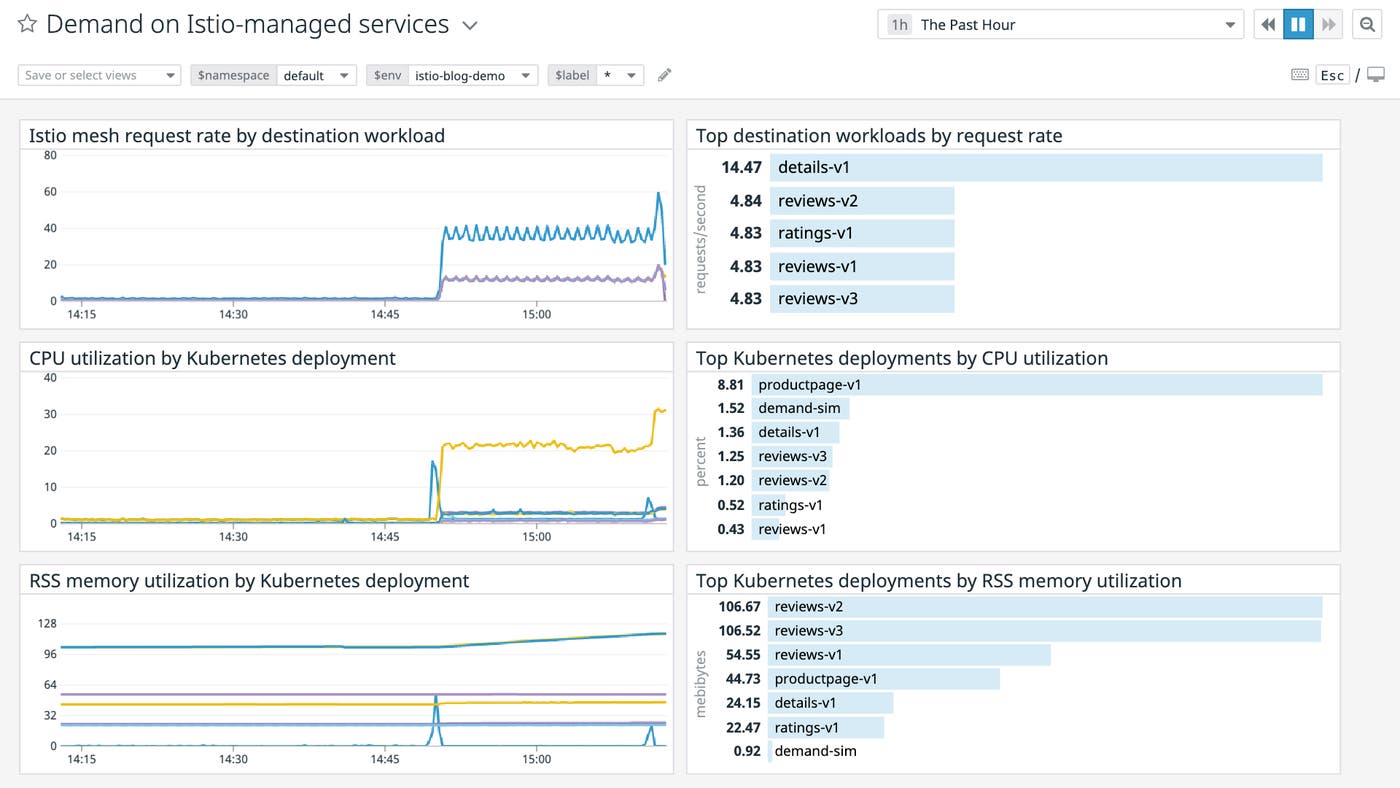
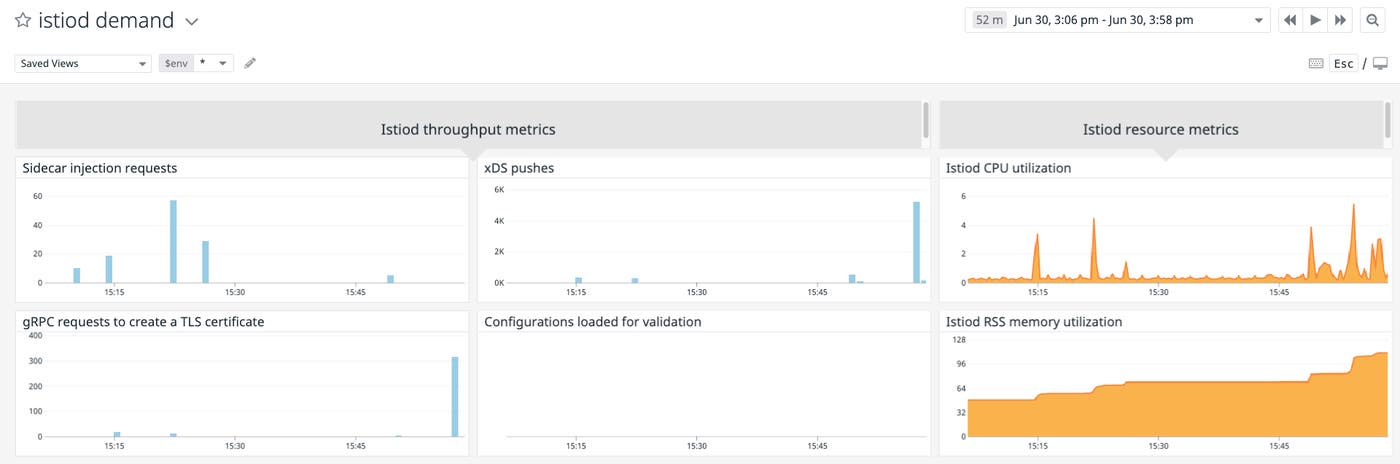
You can also use Datadog to get a clearer picture into whether to scale your istiod deployment. By tracking istiod’s work and resource utilization metrics, you can understand when istiod pods are under heavy load and scale them as needed. The dashboard below shows key throughput metrics for each of istiod’s core functions—handling sidecar injection requests, pushing xDS requests, creating certificates, and validating configurations—along with high-level resource utilization metrics (CPU and memory utilization) for the istiod pods in your cluster.

You can reduce the time it takes to identify issues within a complex Istio deployment by letting Datadog notify you if something is amiss. Datadog enables you to create automated alerts based on your istiod and mesh metrics, plus APM data, logs, and other information that Datadog collects from your cluster. In this section, we’ll show you two kinds of alerts: metric monitors and forecast monitors.
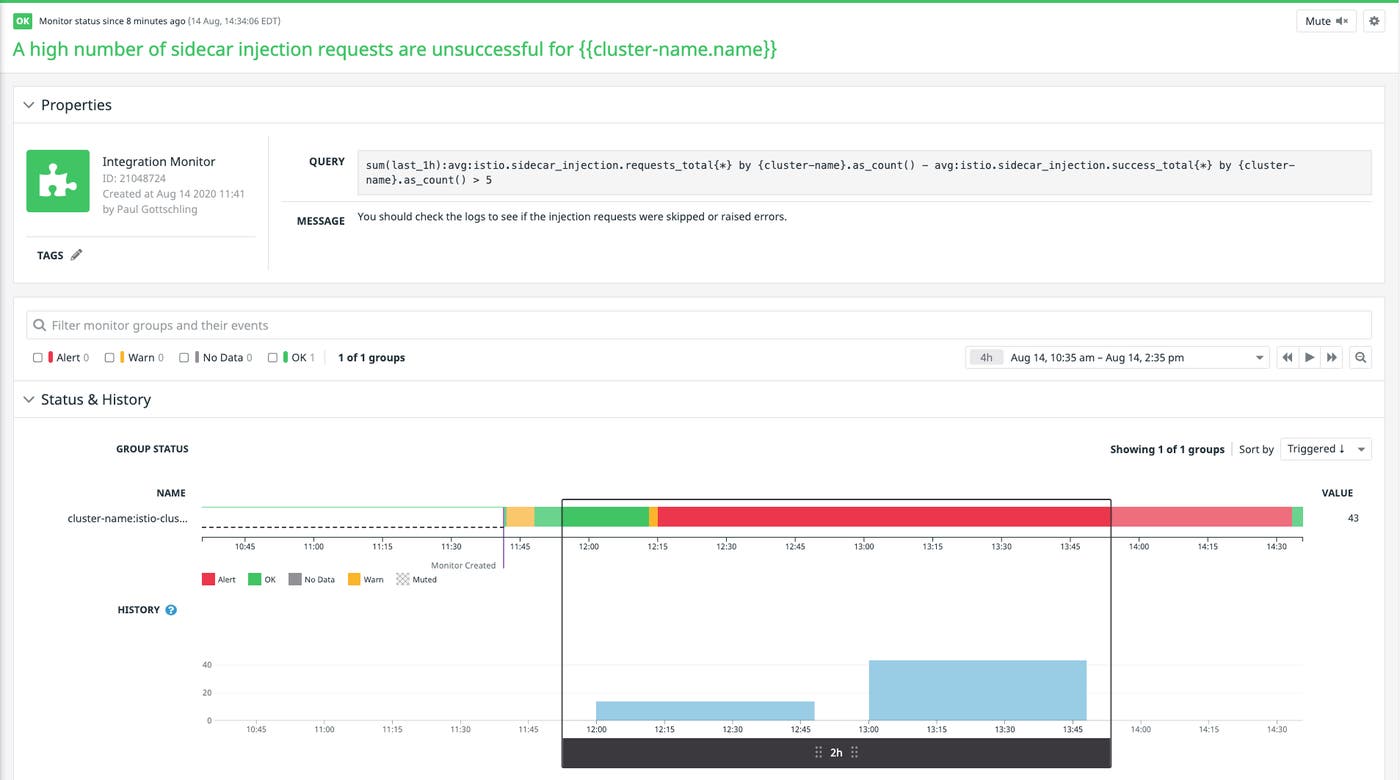
Metric monitors can notify your team if a particular metric’s value crosses a threshold for a specific period of time. This is particularly useful when monitoring automated sidecar injections, which are critical to Istio’s functionality. You’ll want to know as soon as possible if your cluster has added new pods without injecting sidecars so you can check for misconfigurations or errors within the injection webhook.
You can do this by setting a metric monitor on the difference between sidecar_injection_success_total and sidecar_injection_requests_total, which tells you how many sidecar requests were skipped or resulted in an error. If you get alerted that this value is unusually low, you can immediately investigate.
Forecast monitors use the baseline behavior of a metric to project its future values. Since istiod runs multiple gRPC and HTTP servers, each of which handles more traffic as you add services to your cluster, you should alert on imminently high levels of CPU and memory utilization within your istiod pods. You can provide quick context for your on-call team by linking your notifications to a dashboard that visualizes istiod work metrics such as pilot_xds_pushes, sidecar_injection_requests_total, and istio.grpc.server.grpc_server_started_total.
You can also alert on projected CPU and memory utilization for the hosts running pods for services in your mesh. If Datadog forecasts that your hosts will run out of CPU or memory in the near future, it can notify your team so you can take preventive action.

We have shown you how to use Datadog to get comprehensive visibility into the newer, monolithic versions of Istio. Datadog simplifies the task of monitoring Istio, so you can track health and performance, rightsize your Istio deployment, and alert on issues, all in one place. If you’re interested in getting started with Datadog, sign up for a free trial.
We would like to thank Mandar Jog at Google for his technical review of this post.
此内容由惯性聚合(RSS阅读器)自动聚合整理,仅供阅读参考。 原文来自 — 版权归原作者所有。