











Editor’s note: Several URLs in this post contain the term “master.” Datadog does not use this term, but GitHub historically used “master” as the default name for the main branch of a repository. It now uses “main” instead for new repos, and GitHub is advising users to wait for upcoming changes that will allow us to safely rename the “master” branch in our existing repositories.
If you’ve read Part 3 of this series, you’ve learned how you can use different Kubernetes commands and add-ons to spot-check the health and resource usage of Kubernetes cluster objects. In this post we’ll show you how you can get more comprehensive visibility into your cluster by collecting all your telemetry data in one place and tracking it over time. After following along with this post, you will have:
Deployed the Datadog Agent to collect all the metrics highlighted in Part 2 of this series
Deployed kube-state-metrics to gain additional visibility into cluster-level status
Learned how Autodiscovery enables you to automatically monitor your containerized workloads, wherever in the cluster they are running
Enabled log collection so you can search, analyze, and monitor all the logs from your cluster
Set up Datadog APM to collect distributed traces from your containerized applications
Datadog’s integrations with Kubernetes, Docker, containerd, etcd, Istio, and other related technologies are designed to tackle the considerable challenges of monitoring orchestrated containers and services, as explained in Part 1.
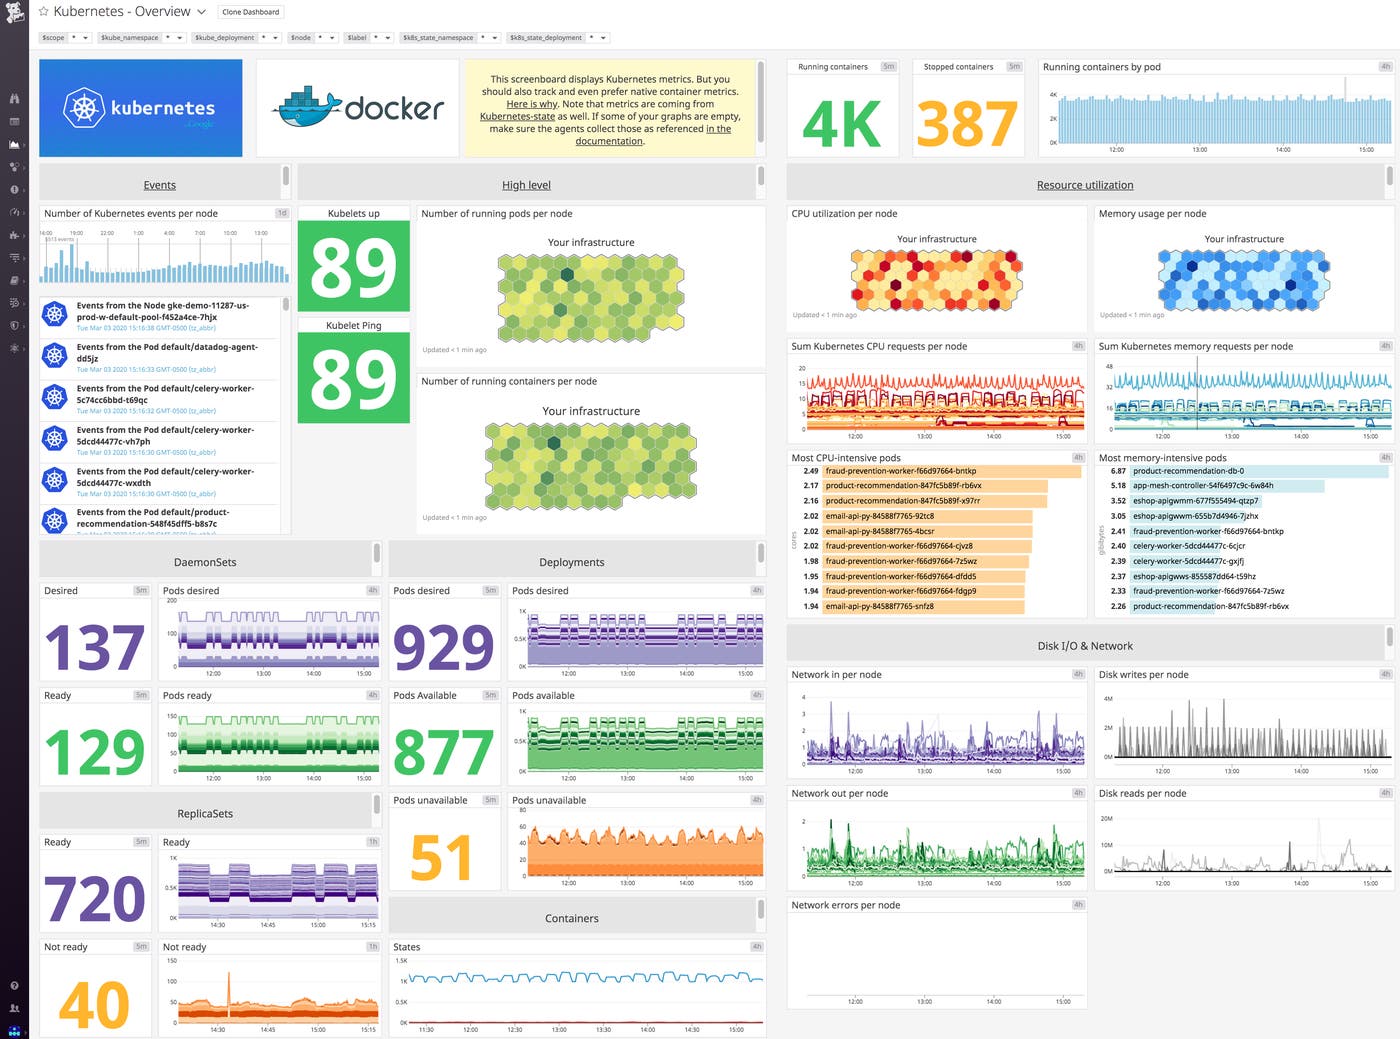
After reading the previous parts of this series, you know that it’s essential to monitor the different layers of your container infrastructure. Datadog integrates with each part of your Kubernetes cluster to provide you with a complete picture of health and performance:
The Datadog Agent’s Kubernetes integration collects metrics, events, and logs from your cluster components, workload pods, and other Kubernetes objects
Integrations with container runtimes including Docker and containerd collect container-level metrics for detailed resource breakdowns
Wherever your Kubernetes clusters are running—including Amazon Web Services, Google Cloud Platform, or Azure—the Datadog Agent automatically monitors the nodes of your Kubernetes clusters
Datadog’s Autodiscovery and 1,000+ built-in integrations automatically monitor the technologies you are deploying
APM and distributed tracing provide transaction-level insight into applications running in your Kubernetes clusters
The first step in setting up comprehensive Kubernetes monitoring is deploying the Datadog Agent to the nodes of your cluster.
The Datadog Agent is open source software that collects and reports metrics, distributed traces, and logs from each of your nodes, so you can view and monitor your entire infrastructure in one place. In addition to collecting telemetry data from Kubernetes, Docker, and other infrastructure technologies, the Agent automatically collects and reports resource metrics (such as CPU, memory, and network traffic) from your nodes, whatever the underlying infrastructure platform. In this section we’ll show you how to install the node-based Datadog Agent along with the Datadog Cluster Agent to provide comprehensive, resource-efficient Kubernetes monitoring.
The Datadog documentation outlines multiple methods for installing the Agent, including using the Helm package manager and installing the Agent directly onto the nodes of your cluster. The recommended approach for the majority of use cases, however, is to deploy the containerized version of the Agent. By deploying the containerized Agent to your cluster as a DaemonSet, you can ensure that one copy of the Agent runs on each host in your cluster, even as the cluster scales up and down. You can also specify a subset of nodes that you wish to run the Agent by using nodeSelectors.
In the sections below, we’ll show you how to install the Datadog Agent across your cluster if you are running Docker. For other runtimes, such as containerd, consult the Datadog documentation.
Datadog’s Agent deployment instructions for Kubernetes provide a full manifest for deploying the containerized node-based Agent as a DaemonSet. If you wish to get started quickly for experimentation purposes, you can follow those directions to roll out the Agent across your cluster. In this guide, however, we’ll go one step further to show you how you can install the Agent on all your nodes, and deploy the specialized Datadog Cluster Agent, which provides several additional benefits for large-scale, production use cases. For instance, the Cluster Agent:
reduces the load on the Kubernetes API server for gathering cluster-level data by serving as a proxy between the API server and the node-based Agents
provides additional security by reducing the permissions needed for the node-based Agents
enables auto-scaling of Kubernetes workloads using any metric collected by Datadog
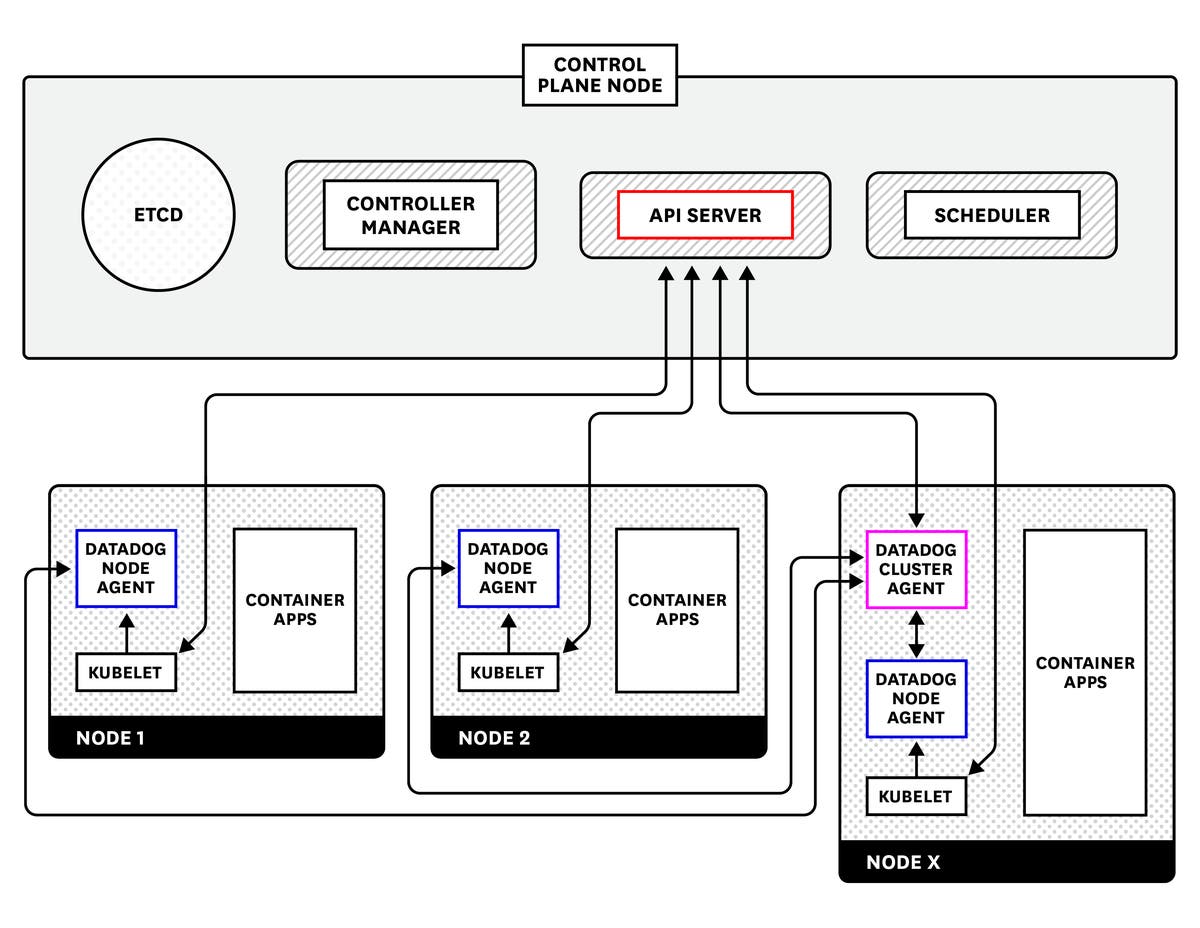
Before you deploy the node-based Agent and the Cluster Agent, you’ll need to complete a few simple prerequisites.
Note: This section includes URLs that use the terms “master.” Datadog does not use this term, but GitHub historically used “master” as the default name for the main branch of a repository.
If your Kubernetes cluster uses role-based access control, you can deploy the following manifests to create the permissions that the node-based Agent and Cluster Agent will need to operate in your cluster. The following manifests create two sets of permissions: one for the Cluster Agent, which has specific permissions for collecting cluster-level metrics and Kubernetes events from the Kubernetes API, and a more limited set of permissions for the node-based Agent. Deploying these two manifests will create a ClusterRole, ClusterRoleBinding, and ServiceAccount for each flavor of Agent:
kubectl create -f "https://raw.githubusercontent.com/DataDog/datadog-agent/master/Dockerfiles/manifests/cluster-agent/cluster-agent-rbac.yaml"
kubectl create -f "https://raw.githubusercontent.com/DataDog/datadog-agent/master/Dockerfiles/manifests/cluster-agent/rbac.yaml"
Next, create a Kubernetes secret to provide your Datadog API key to the Agent without embedding the API key in your deployment manifests (which you may wish to manage in source control). To create the secret, run the following command using an API key from your Datadog account:
kubectl create secret generic datadog-secret --from-literal api-key="<YOUR_API_KEY>"
Finally, create a secret token to enable secure Agent-to-Agent communication between the Cluster Agent and the node-based Agents:
echo -n '<32_CHARACTER_LONG_STRING>' | base64
Use the resulting token to create a Kubernetes secret that both flavors of Agent will use to authenticate with each other:
kubectl create secret generic datadog-auth-token --from-literal=token=<TOKEN_FROM_PREVIOUS_STEP>
Now that you’ve created Kubernetes secrets with your Datadog API key and with an authentication token, you’re ready to deploy the Cluster Agent. Copy the manifest below to a local file and save it as datadog-cluster-agent.yaml:
apiVersion: v1
kind: Service
metadata:
name: datadog-cluster-agent
labels:
app: datadog-cluster-agent
spec:
ports:
- port: 5005 # Has to be the same as the one exposed in the DCA. Default is 5005.
protocol: TCP
selector:
app: datadog-cluster-agent
---
apiVersion: apps/v1
kind: Deployment
metadata:
name: datadog-cluster-agent
namespace: default
spec:
selector:
matchLabels:
app: datadog-cluster-agent
template:
metadata:
labels:
app: datadog-cluster-agent
name: datadog-agent
annotations:
ad.datadoghq.com/datadog-cluster-agent.check*names: '["prometheus"]'
ad.datadoghq.com/datadog-cluster-agent.init_configs: '[{}]'
ad.datadoghq.com/datadog-cluster-agent.instances: '[{"prometheus_url": "http://%%host%%:5000/metrics","namespace": "datadog.cluster_agent","metrics": ["go_goroutines","go_memstats*_","process\__","api*requests","datadog_requests","external_metrics", "cluster_checks*\*"]}]'
spec:
serviceAccountName: dca
containers:
- image: datadog/cluster-agent:latest
imagePullPolicy: Always
name: datadog-cluster-agent
env:
- name: DD_API_KEY
valueFrom:
secretKeyRef:
name: datadog-secret
key: api-key
# Optionally reference an APP KEY for the External Metrics Provider.
# - name: DD_APP_KEY
# value: '<YOUR_APP_KEY>'
- name: DD_CLUSTER_AGENT_AUTH_TOKEN
valueFrom:
secretKeyRef:
name: datadog-auth-token
key: token
- name: DD_COLLECT_KUBERNETES_EVENTS
value: "true"
- name: DD_LEADER_ELECTION
value: "true"
- name: DD_EXTERNAL_METRICS_PROVIDER_ENABLED
value: "true"
The manifest creates a Kubernetes Deployment and Service for the Cluster Agent. The Deployment ensures that a single Cluster Agent is always running somewhere in the cluster, whereas the Service provides a stable endpoint within the cluster so that node-based Agents can contact the Cluster Agent, wherever it may be running. Note that the Datadog API key and authentication token are retrieved from Kubernetes secrets, rather than being saved as plaintext in the manifest itself. To deploy the Cluster Agent, apply the manifest above:
kubectl apply -f datadog-cluster-agent.yaml
To verify that the Cluster Agent is running properly, run the first command below to find the pod name of the Cluster Agent. Then, use that pod name to run the Cluster Agent’s status command, as shown in the second command:
kubectl get pods -l app=datadog-cluster-agent
NAME READY STATUS RESTARTS AGE
datadog-cluster-agent-7477d549ff-s42zx 1/1 Running 0 11s
kubectl exec -it datadog-cluster-agent-7477d549ff-s42zx datadog-cluster-agent status
In the output, you should be able to see that the Cluster Agent is successfully connecting to the Kubernetes API server to collect events and cluster status data, as shown in this example snippet:
Running Checks
==============
[...]
kubernetes_apiserver
--------------------
Instance ID: kubernetes_apiserver [OK]
Configuration Source: file:/etc/datadog-agent/conf.d/kubernetes_apiserver.d/conf.yaml.default
Total Runs: 4
Metric Samples: Last Run: 0, Total: 0
Events: Last Run: 0, Total: 52
Service Checks: Last Run: 4, Total: 16
Average Execution Time : 2.017s
Once you’ve created the necessary permissions and secrets, deploying the node-based Datadog Agent to your cluster is simple. The manifest below builds on the standard Kubernetes Agent manifest to set two extra environment variables: DD_CLUSTER_AGENT_ENABLED (set to true), and DD_CLUSTER_AGENT_AUTH_TOKEN (set via Kubernetes secrets, just as in the manifest for the Cluster Agent). Copy the following manifest to a local file and save it as datadog-agent.yaml.
apiVersion: apps/v1
kind: DaemonSet
metadata:
name: datadog-agent
spec:
selector:
matchLabels:
app: datadog-agent
template:
metadata:
labels:
app: datadog-agent
name: datadog-agent
spec:
serviceAccountName: datadog-agent
containers:
- image: datadog/agent:7
imagePullPolicy: Always
name: datadog-agent
ports:
- containerPort: 8125
# Custom metrics via DogStatsD - uncomment this section to enable custom metrics collection
# hostPort: 8125
name: dogstatsdport
protocol: UDP
- containerPort: 8126
# Trace Collection (APM) - uncomment this section to enable APM
# hostPort: 8126
name: traceport
protocol: TCP
env:
- name: DD_API_KEY
valueFrom:
secretKeyRef:
name: datadog-secret
key: api-key
- name: DD_COLLECT_KUBERNETES_EVENTS
value: "true"
- name: KUBERNETES
value: "true"
- name: DD_HEALTH_PORT
value: "5555"
- name: DD_KUBERNETES_KUBELET_HOST
valueFrom:
fieldRef:
fieldPath: status.hostIP
- name: DD_CLUSTER_AGENT_ENABLED
value: "true"
- name: DD_CLUSTER_AGENT_AUTH_TOKEN
valueFrom:
secretKeyRef:
name: datadog-auth-token
key: token
- name: DD_APM_ENABLED
value: "true"
resources:
requests:
memory: "256Mi"
cpu: "200m"
limits:
memory: "256Mi"
cpu: "200m"
volumeMounts:
- name: dockersocket
mountPath: /var/run/docker.sock
- name: procdir
mountPath: /host/proc
readOnly: true
- name: cgroups
mountPath: /host/sys/fs/cgroup
readOnly: true
livenessProbe:
httpGet:
path: /health
port: 5555
initialDelaySeconds: 15
periodSeconds: 15
timeoutSeconds: 5
successThreshold: 1
failureThreshold: 3
volumes:
- hostPath:
path: /var/run/docker.sock
name: dockersocket
- hostPath:
path: /proc
name: procdir
- hostPath:
path: /sys/fs/cgroup
name: cgroups
Then run the following command to deploy the node-based Agent as a DaemonSet, which ensures that one copy of the Agent will run on every node in the cluster:
kubectl create -f datadog-agent.yaml
To verify that the node-based Datadog Agent is running on your cluster, run the following command:
kubectl get daemonset datadog-agent
NAME DESIRED CURRENT READY UP-TO-DATE AVAILABLE NODE SELECTOR AGE
datadog-agent 3 3 3 3 3 <none> 12m
The output above shows that the Agent was successfully deployed across a three-node cluster. The number of desired and current pods should be equal to the number of running nodes in your Kubernetes cluster.
You can then run the status command for any one of your node-based Agents to verify that the node-based Agents are successfully communicating with the Cluster Agent. First find the name of a node-based Agent pod:
kubectl get pods -l app=datadog-agent
NAME READY STATUS RESTARTS AGE
datadog-agent-7vzqh 1/1 Running 0 27m
datadog-agent-kfvpc 1/1 Running 0 27m
datadog-agent-xvss5 1/1 Running 0 27m
Then use one of those pod names to query the Agent’s status:
kubectl exec -it datadog-agent-7vzqh agent status
There are at least two items to look for in the output. First, you should see that the node-based Agent is not collecting any events from the Kubernetes API server nor running any service checks on the API server (as these responsibilities have been delegated to the Cluster Agent):
Running Checks
==============
[...]
kubernetes_apiserver
--------------------
Instance ID: kubernetes_apiserver [OK]
Configuration Source: file:/etc/datadog-agent/conf.d/kubernetes_apiserver.d/conf.yaml.default
Total Runs: 110
Metric Samples: Last Run: 0, Total: 0
Events: Last Run: 0, Total: 0
Service Checks: Last Run: 0, Total: 0
Average Execution Time : 0s
Second, you should see a section at the end of the status output indicating that the node-based Agent is talking to the Cluster Agent:
# Datadog Cluster Agent
- Datadog Cluster Agent endpoint detected: https://10.137.5.251:5005
Successfully connected to the Datadog Cluster Agent.
With the Datadog Agent successfully deployed, resource metrics and events from your cluster should be streaming into Datadog. You can view the data you’re already collecting in the built-in Kubernetes dashboard.
You may recall from earlier in this series that certain cluster-level metrics—specifically, the counts of Kubernetes objects such as the count of pods desired, currently available, and currently unavailable—are provided by an optional cluster add-on called kube-state-metrics. If you see that this data is missing from the dashboard, it means that you have not deployed the kube-state-metrics service. To add these statistics to the lower-level resource metrics already being collected by the Agent, you simply need to deploy kube-state-metrics to your cluster.
As covered in Part 3 of this series, you can use a set of manifests from the official kube-state-metrics project to quickly deploy the add-on and its associated resources. To download the manifests and apply them to your cluster, run the following series of commands:
git clone https://github.com/kubernetes/kube-state-metrics.git
cd kube-state-metrics
kubectl apply -f examples/standard
You can then inspect the Deployment to ensure that kube-state-metrics is running and available:
kubectl get deploy kube-state-metrics --namespace kube-system
NAME READY UP-TO-DATE AVAILABLE AGE
kube-state-metrics 1/1 1 1 42m
Once kube-state-metrics is up and running, your cluster state metrics will start pouring into Datadog automatically, without any further configuration. That’s because the Datadog Agent’s Autodiscovery functionality, which we’ll cover in the next section, detects when certain services are running and automatically enables metric collection from those services. Since kube-state-metrics is among the integrations automatically enabled by Autodiscovery, there’s nothing more you need to do to start collecting your cluster state metrics in Datadog.
Thanks to the Datadog Agent’s Autodiscovery feature, you can continuously monitor your containerized applications without interruption even as they scale or shift across containers and hosts. Autodiscovery listens for container creation or deletion events and applies configuration templates accordingly to ensure that containerized applications are automatically monitored as they come online.
Autodiscovery means that Datadog can automatically configure many of its integrations, such as kube-state-metrics (as explained above), without any user setup. Other auto-configured services include common cluster components such as the Kubernetes API server, Consul, CoreDNS, and etcd, as well as infrastructure technologies like Apache (httpd), Redis, and Apache Tomcat. When the Datadog Agent detects those containers running anywhere in the cluster, it will attempt to apply a standard configuration template to the containerized application and begin collecting monitoring data.
For services in your cluster that require user-provided configuration details (such as authentication credentials for a database), you can use Kubernetes pod annotations to specify which Datadog check to apply to that pod, as well as any details necessary to configure the monitoring check. For example, to configure the Datadog Agent to collect metrics from your MySQL database using an authorized datadog user, you would add the following pod annotations to your MySQL pod manifest:
annotations:
ad.datadoghq.com/mysql.check_names: '["mysql"]'
ad.datadoghq.com/mysql.init_configs: '[{}]'
ad.datadoghq.com/mysql.instances: '[{"server": "%%host%%", "user": "datadog","pass": "<UNIQUEPASSWORD>"}]'
Those annotations instruct Datadog to apply the MySQL monitoring check to any mysql containers, and to connect to the MySQL instances using a dynamically provided host IP address and authentication credentials for the datadog user.
Datadog includes integrations with the individual components of your cluster’s Control Plane, including the API server, scheduler, and etcd cluster. Once you deploy Datadog to your cluster, metrics from these components automatically appear so that you can easily visualize and track the overall health and workload of your cluster.
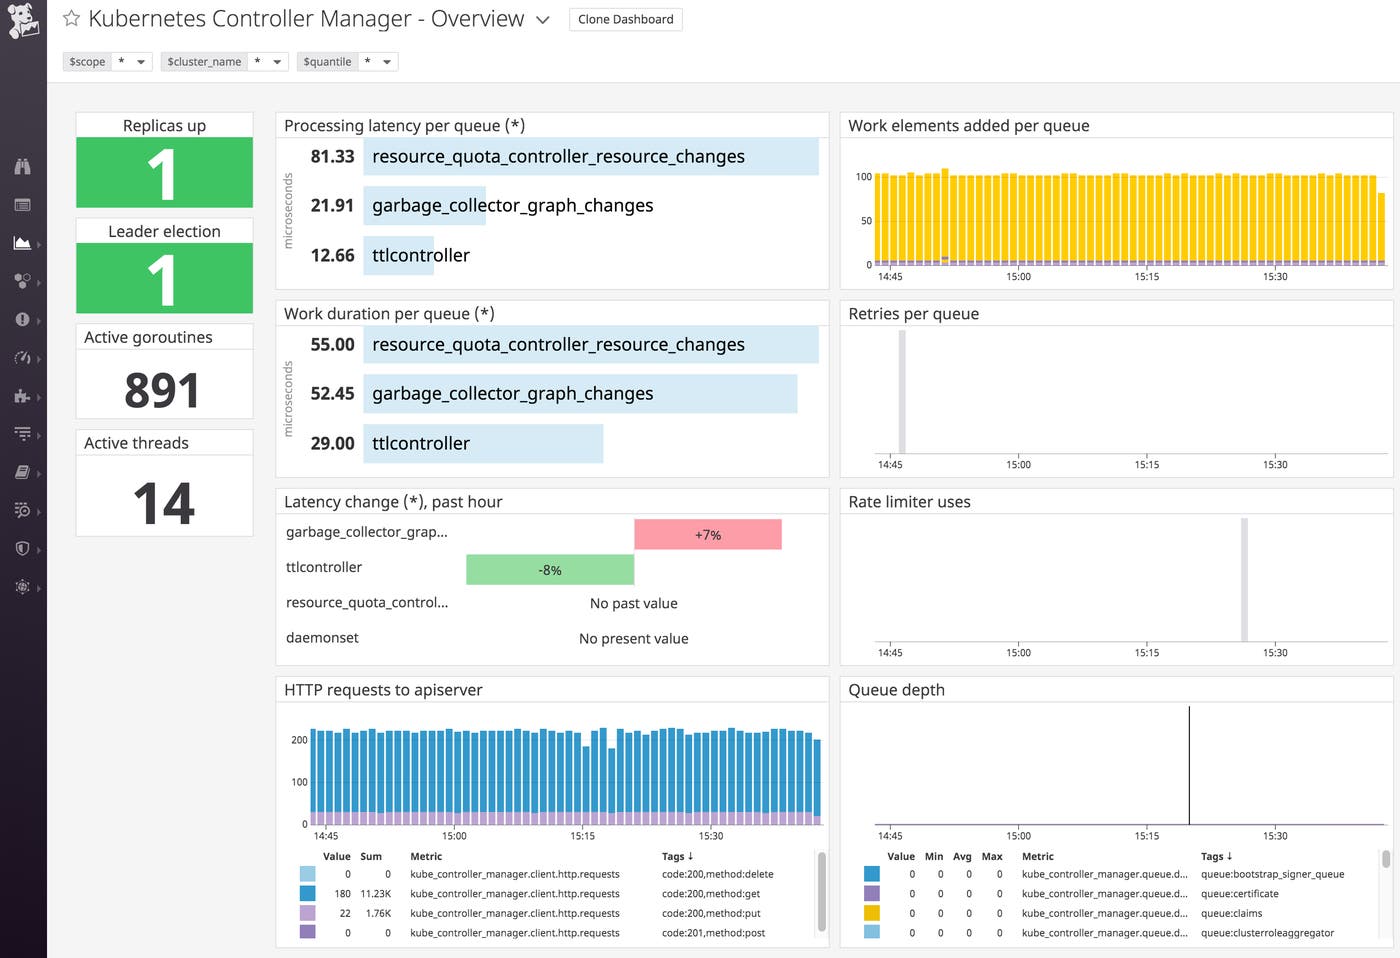
See our documentation for more information on our integrations with the API server, controller manager, scheduler, and etcd. And you can learn more about how etcd works and key metrics you should monitor in our etcd monitoring guide.
Datadog automatically imports metadata from Kubernetes, Docker, cloud services, and other technologies, and creates tags that you can use to sort, filter, and aggregate your data. Tags (and their Kubernetes equivalent, labels) are essential for monitoring dynamic infrastructure, where host names, IP addresses, and other identifiers are constantly in flux. With tags in Datadog, you can filter and view your resources by Kubernetes Deployment (kube_deployment) or Service (kube_service), or by Docker image (image_name). Datadog also automatically pulls in tags from your cloud provider, so you can view your nodes or containers by availability zone, instance type, and so on.
In your node-based Datadog Agent manifest, you can add custom tags with the environment variable DD_TAGS followed by key:value pairs, separated by spaces. For example, you could apply the following tags to your node-based Agents to indicate the code name of the Kubernetes cluster and the team responsible for it:
env:
[...]
- name: DD_TAGS
value: cluster-codename:melange team:core-platform
You can also import Kubernetes pod labels as tags, which captures pod-level metadata that you define in your manifests as tags, so you can use that metadata to filter and aggregate your telemetry data in Datadog.
The Datadog Agent automatically collects metrics from your nodes and containers. To get even more insight into your cluster, you can also configure Datadog to collect logs and distributed traces from the applications in your cluster. You can easily enable log collection and distributed tracing by changing a few configurations to the node-based Agent manifest.
Datadog can automatically collect logs from Kubernetes, Docker, and many other technologies you may be running on your cluster. Logs can be invaluable for troubleshooting problems, identifying errors, and giving you greater insight into the behavior of your infrastructure and applications.
In order to enable log collection from your containers, add the following environment variables:
env:
[...]
- name: DD_LOGS_ENABLED
value: "true"
- name: DD_LOGS_CONFIG_CONTAINER_COLLECT_ALL
value: "true"
- name: DD_AC_EXCLUDE
value: "name:datadog-agent"
The DD_AC_EXCLUDE environment variable instructs the Datadog Agent to exclude certain containers from log collection to reduce the volume of collected data—in this case, the Agent will omit its own logs. You can skip this configuration item if you wish the Agent to send its own logs to Datadog.
Next, add the following to volumeMounts and volumes:
volumeMounts:
[...]
- name: pointdir
mountPath: /opt/datadog-agent/run
[...]
volumes:
[...]
- hostPath:
path: /opt/datadog-agent/run
name: pointdir
Once you make those additions to the node-based Agent manifest, redeploy the Agent to enable log collection from your cluster:
kubectl apply -f datadog-agent.yaml
With log collection enabled, you should start seeing logs flowing into the Log Explorer in Datadog. You can filter by your cluster name, node names, or any custom tag you applied earlier to drill down to the logs from only your deployment.
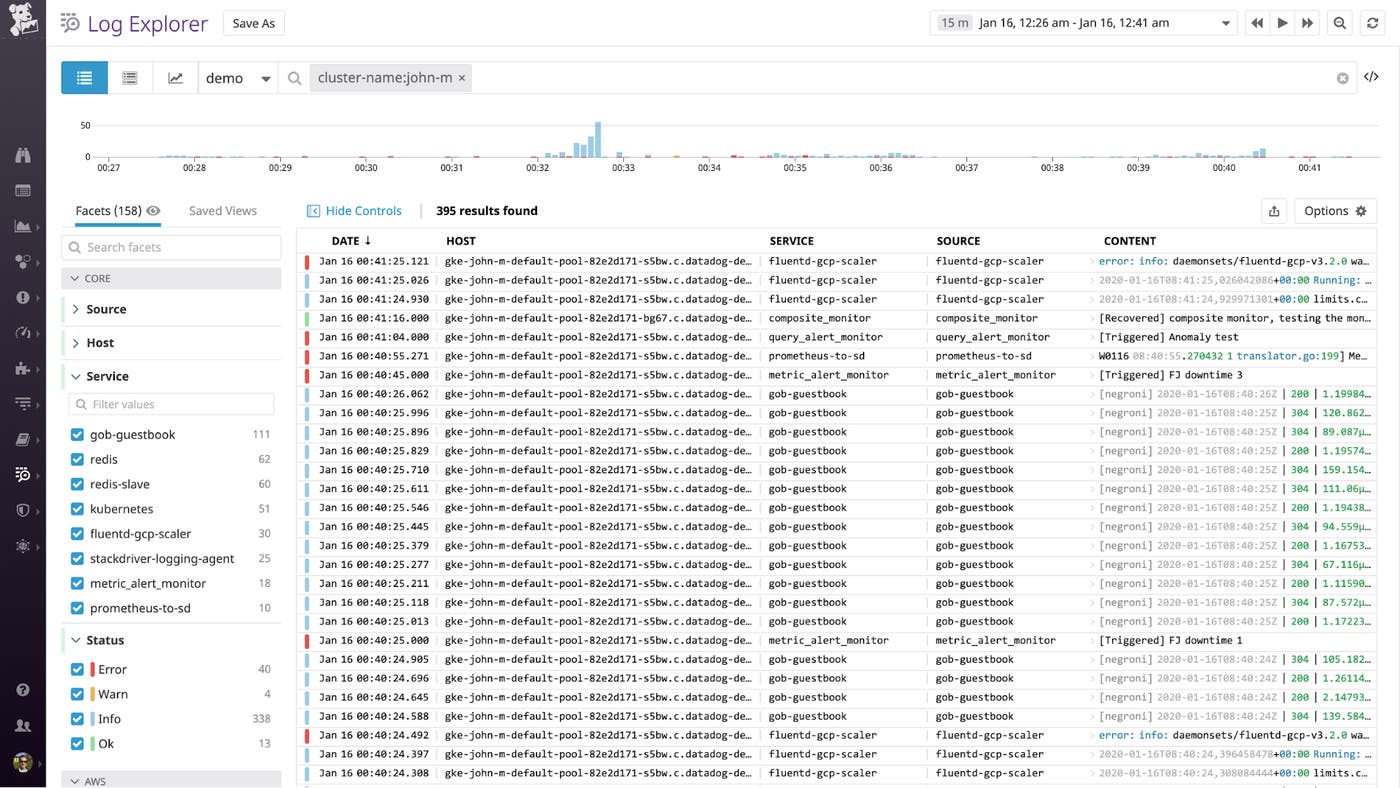
Note that in some container environments, including Google Kubernetes Engine, /opt is read-only, so the Agent will not be able to write to the standard path provided above. As a workaround, you can replace /opt/datadog-agent/run with /var/lib/datadog-agent/logs in your manifest if you run into read-only errors.
Kubernetes audit logs provide valuable information about requests made to your API servers. They record data such as which users or services are requesting access to cluster resources, and why the API server authorized or rejectd those requests. Because audit logs are written in JSON, a monitoring service like Datadog can easily parse them for filtering and analysis. This enables you to set alerts on unusual behavior and troubleshoot potential API authentication issues that might affect whether users or services can access your cluster.
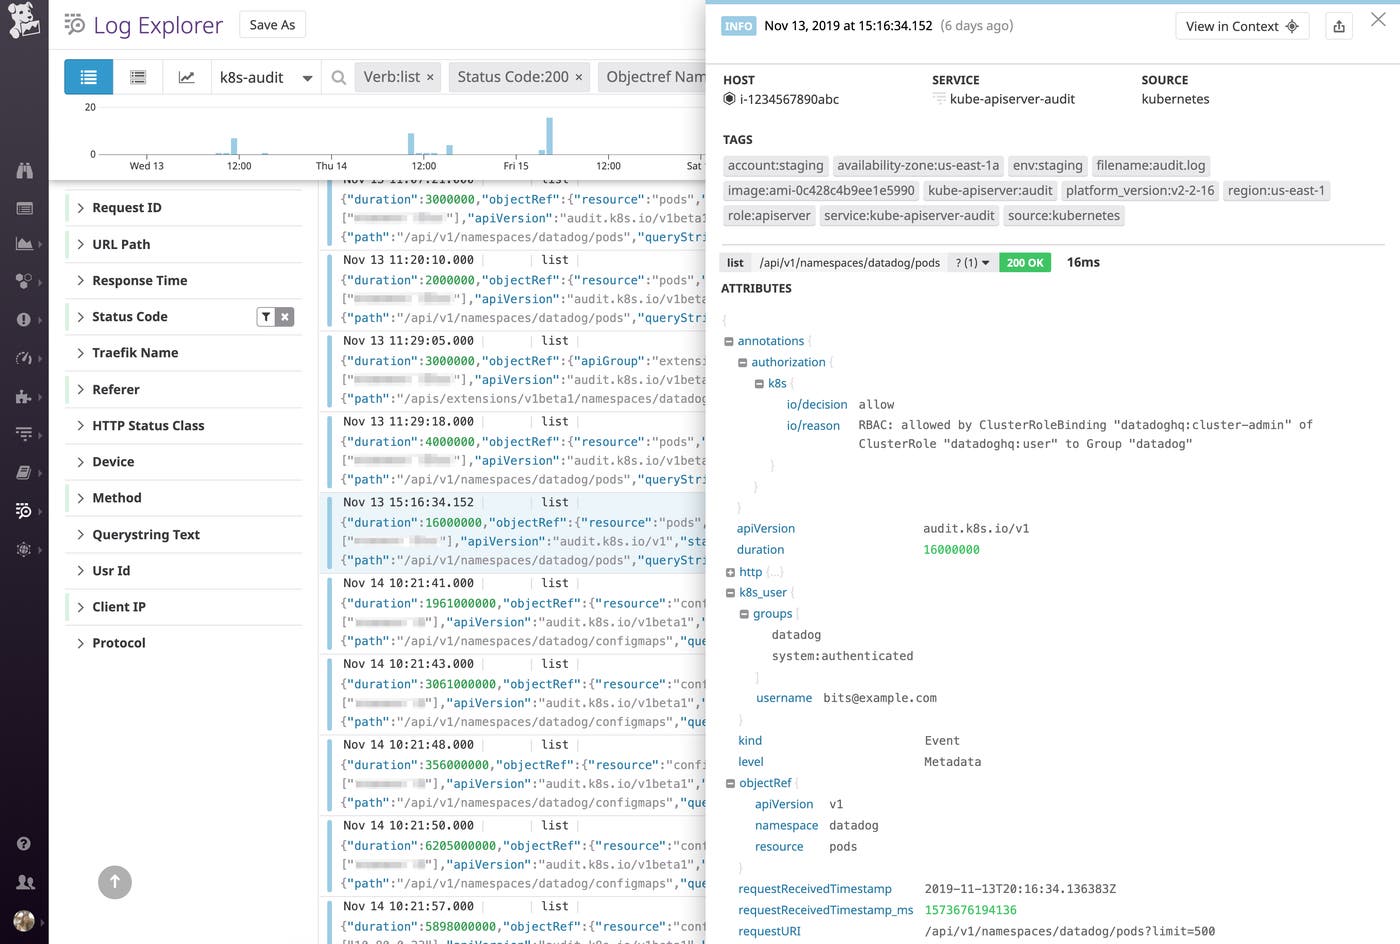
See our documentation for steps on setting up audit log collection with Datadog.
Datadog automatically ingests, processes, and parses all of the logs from your Kubernetes cluster for analysis and visualization. To get the most value from your logs, ensure that they have a source tag and a service tag attached. For logs coming from one of Datadog’s log integrations, the source sets the context for the log (e.g. nginx), enabling you to pivot between infrastructure metrics and related logs from the same system. The source tag also tells Datadog which log processing pipeline to use to properly parse those logs in order to extract structured facets and attributes. Likewise, the service tag (which is a core tag in Datadog APM) enables you to pivot seamlessly from logs to application-level metrics and request traces from the same service for rapid troubleshooting.
The Datadog Agent will attempt to automatically generate these tags for your logs from the image name. For example, logs from Redis containers will be tagged source:redis and service:redis. You can also provide custom values by including them in Kubernetes annotations in your deployment manifests:
annotations:
ad.datadoghq.com/<CONTAINER_IDENTIFIER>.logs: '[{"source":"<SOURCE>","service":"<SERVICE>"}]'
Datadog APM traces requests to your application as they propagate across infrastructure and service boundaries. You can then visualize the full lifespan of these requests from end to end. APM gives you deep visibility into application performance, database queries, dependencies between services, and other insights that enable you to optimize and troubleshoot application performance.
Datadog APM auto-instruments a number of languages and application frameworks; consult the documentation for supported languages and details on how to get started with instrumenting your language or framework.
To enable tracing in your cluster, first ensure that the Datadog Agent has the environment variable DD_APM_ENABLED set to true, as in the Datadog node-based Agent manifest provided above. If you’re using a different Agent manifest, you can add the following configuration to set the environment variable:
env:
[...]
- name: DD_APM_ENABLED
value: "true"
Then, uncomment the hostPort for the Trace Agent so that your manifest includes:
- containerPort: 8126
hostPort: 8126
name: traceport
protocol: TCP
Apply the changes:
kubectl apply -f datadog-agent.yaml
Next, provide the host node’s IP as an environment variable to ensure that application containers send traces to the Datadog Agent instance running on the correct node. This can be accomplished by configuring the application’s Deployment manifest to provide the host node’s IP as an environment variable using Kubernetes’s Downward API. Set the DATADOG_TRACE_AGENT_HOSTNAME environment variable in the manifest for the application to be monitored:
spec:
containers:
- name: <CONTAINER_NAME>
image: <CONTAINER_IMAGE>:<TAG>
env:
- name: DATADOG_TRACE_AGENT_HOSTNAME
valueFrom:
fieldRef:
fieldPath: status.hostIP
When you deploy your instrumented application, it will automatically begin sending traces to Datadog. From the APM tab of your Datadog account, you can see a breakdown of key performance indicators for each of your instrumented services, with information about request throughput, latency, errors, and the performance of any service dependencies.
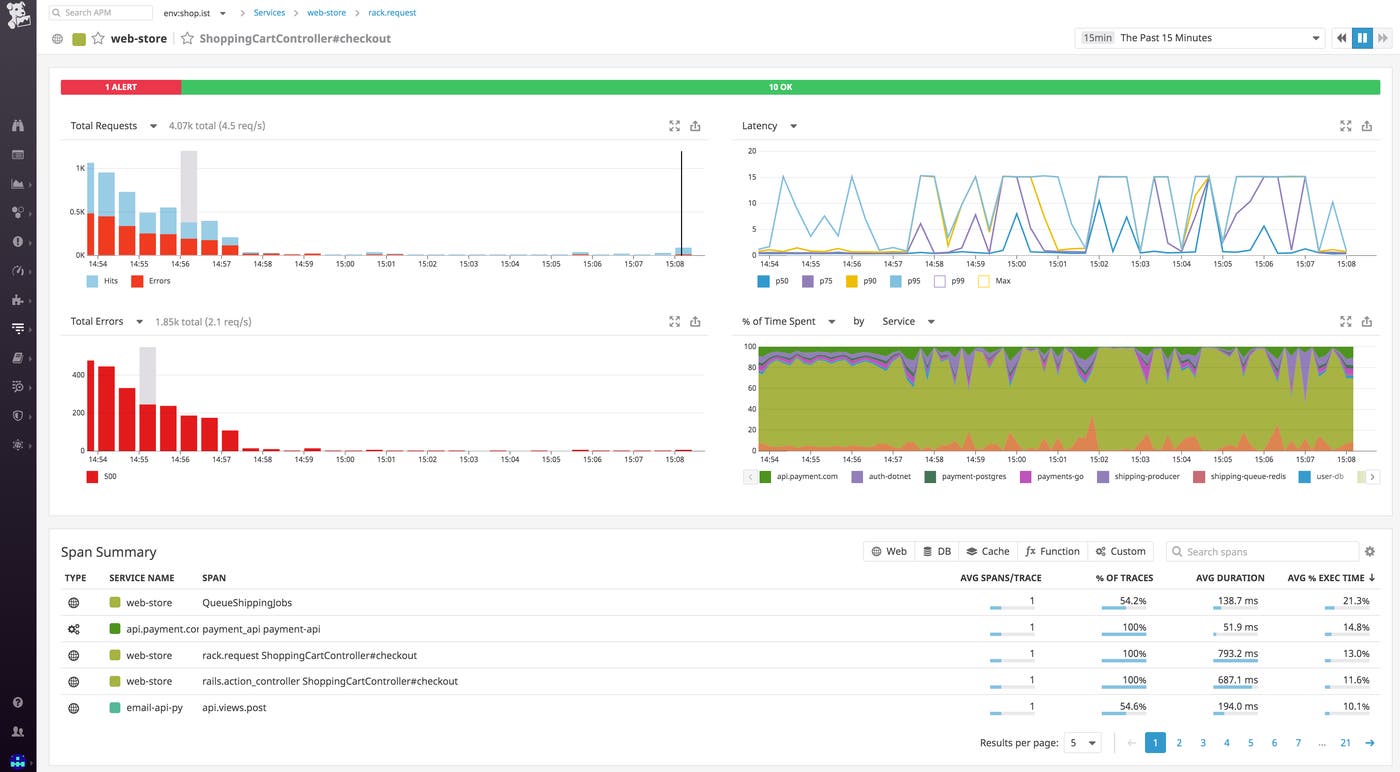
You can then dive into individual traces to inspect a flame graph that breaks down the trace into spans, each one representing an individual database query, function call, or operation carried out as part of fulfilling the request. For each span, you can view system metrics, application runtime metrics, error messages, and relevant logs that pertain to that unit of work.
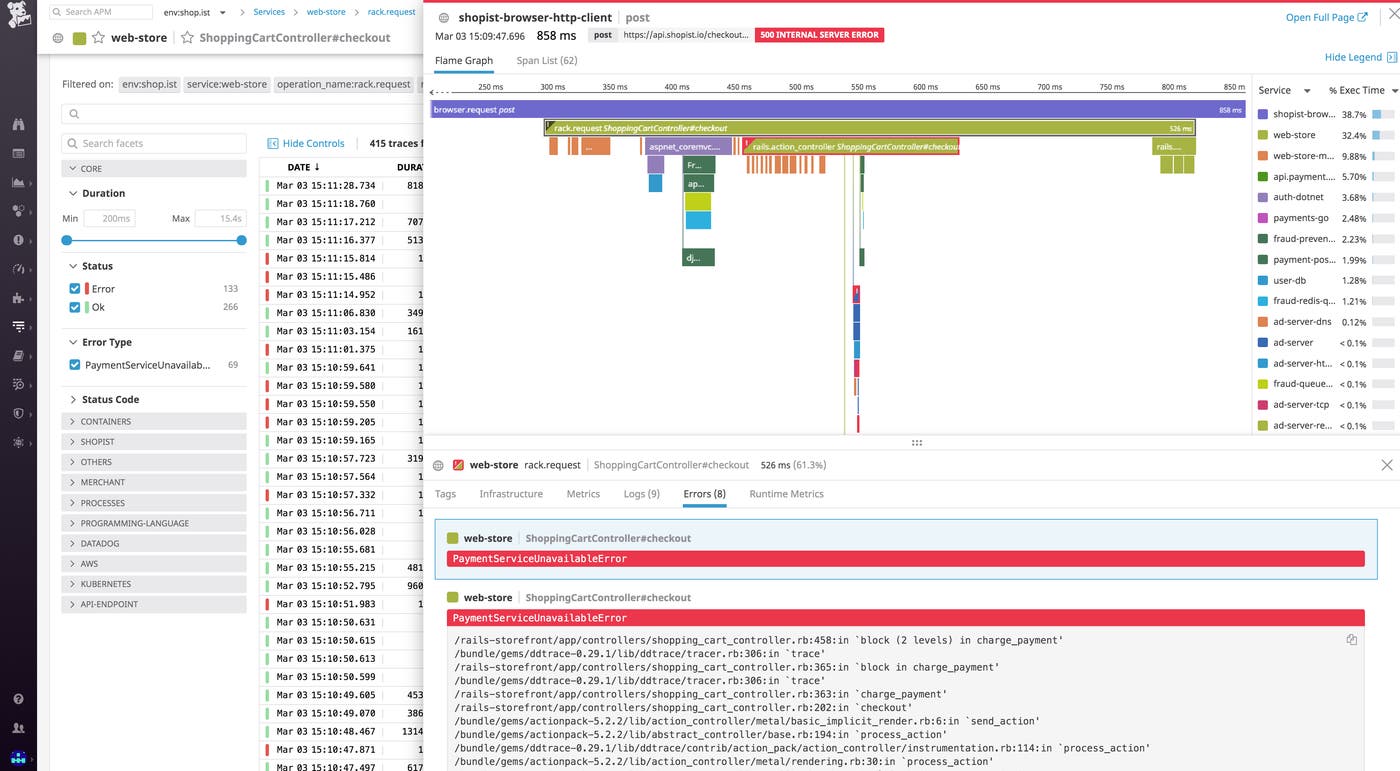
If you’ve followed along in this post, you’ve already started collecting a wealth of data from your Kubernetes cluster by:
Deploying the Datadog Cluster Agent and node-based Agent to collect metrics and other telemetry data from your cluster
Adding kube-state-metrics to your cluster to expose high-level statistics on the number and status of cluster objects
Enabling Autodiscovery to seamlessly monitor new containers as they are deployed to your cluster
Collecting logs from your cluster and the workloads running on it
Setting up distributed tracing for your applications running on Kubernetes
Datadog provides even more Kubernetes monitoring functionality beyond the scope of this post. We encourage you to dive into Datadog’s Kubernetes documentation to learn how to set up process monitoring, network performance monitoring, and collection of custom metrics in Kubernetes.
If you don’t yet have a Datadog account, you can start monitoring Kubernetes clusters with a free trial.
此内容由惯性聚合(RSS阅读器)自动聚合整理,仅供阅读参考。 原文来自 — 版权归原作者所有。