





In Part 1 of this series, we looked at how Snowflake enables users to easily store, process, analyze, and share high volumes of structured and semi-structured data, as well as key metrics for monitoring compute costs, storage, and datasets.
In this post, we’ll walk through how to collect and analyze these metrics using Snowsight, Snowflake’s built-in web interface. Snowsight enhances Snowflake’s data collection and monitoring capabilities by providing tools that allow users to track and analyze key metrics. Snowsight includes pre-built dashboards for monitoring various aspects of account activity, such as credit usage, storage, and query performance. These observability tools can help you track resource usage and manage costs.
We’ll discuss how to use the built-in tooling available in Snowflake to:
Review and analyze virtual warehouse metrics
Monitor query activity and history
Get visibility into spend and create budgets
Monitor data loading
To get monitoring data on your virtual warehouses, you can use views in the ACCOUNT_USAGE schema like QUERY_HISTORY and WAREHOUSE_LOAD_HISTORY, or you can easily visualize data using the Warehouse Monitoring view in Snowsight, which provides real-time and historical insights into the performance and usage of Snowflake’s virtual warehouses. The metrics surfaced in these views can help you optimize performance, manage costs, and ensure efficient use of resources.
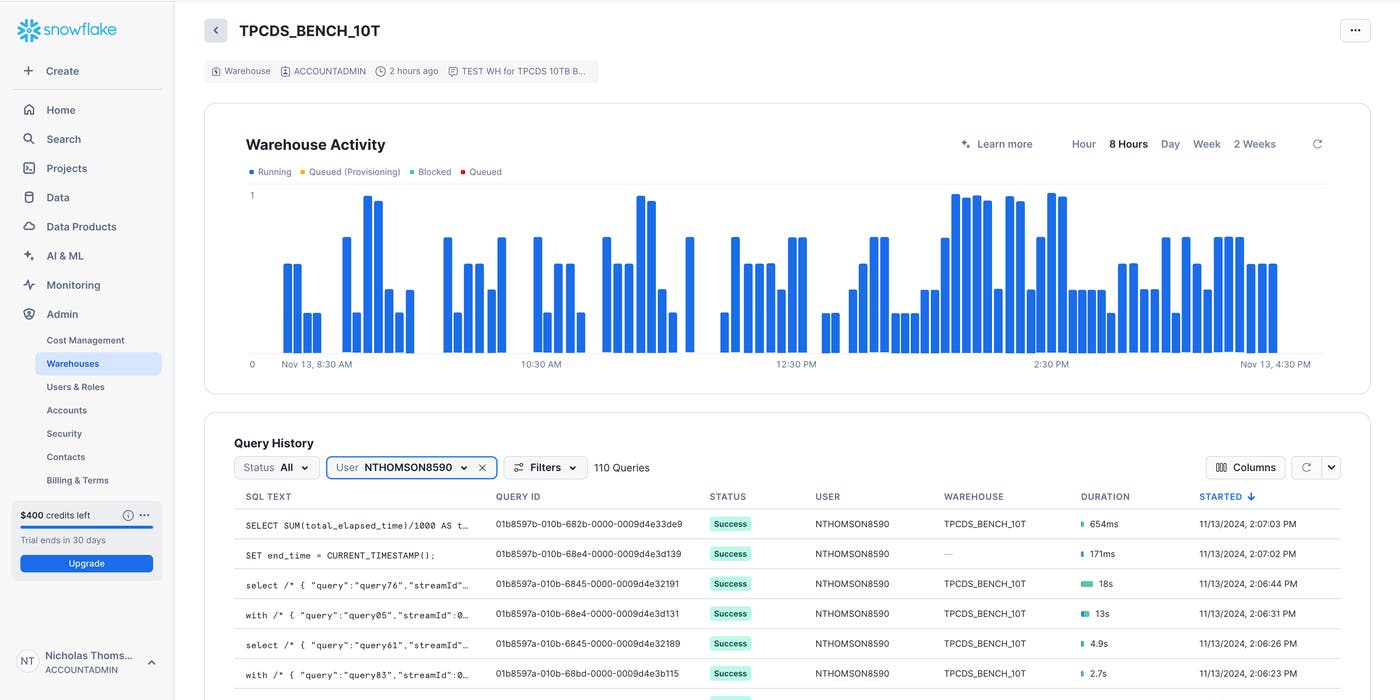
You can use the Snowsight Warehouse Activity view to identify bottlenecks in query performance. For example, you can filter by STATUS over a certain time period to surface queries that FAILED. To troubleshoot, you should identify the root cause of the FAILED queries by:
Checking the error message to see if, for instance, the query failed due to a permission issue (e.g., “Insufficient privileges”) or due to missing or malformed data (e.g., “NULL value not allowed”, “Numeric value out of range”, “Data type mismatch”)
Reviewing the SQL query that failed to see if a syntax error or logic issue caused the query to fail
Noting how long the query ran before failing—long-running queries could be a sign of resource contention (e.g., insufficient compute capacity)
Verifying which warehouse executed the query
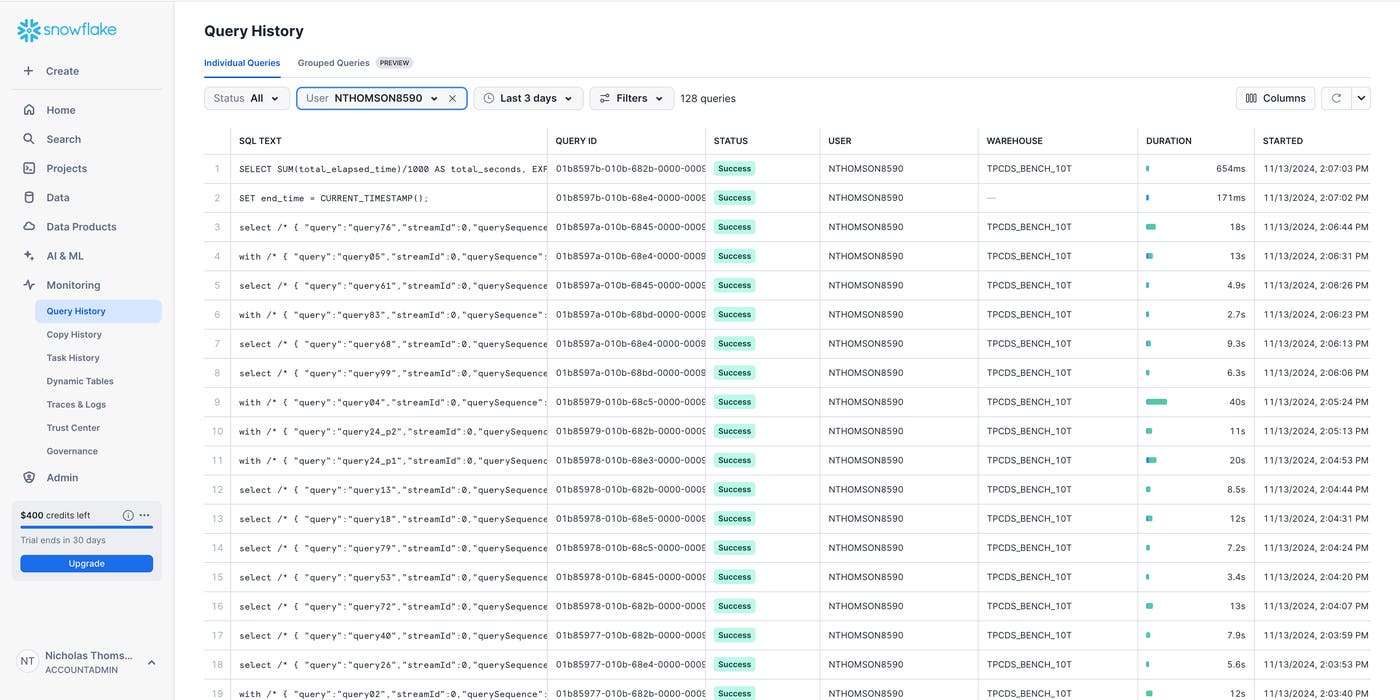
You can monitor query activity and history by using the QUERY_HISTORY view in the ACCOUNT_USAGE schema, or via Snowsight, which offers a Query History view. This view provides a detailed, searchable history where you can filter queries by user, warehouse, database, or execution status. Additionally, Snowsight provides real-time data on executed queries, while account_usage.query_history can have latency of up to 45 minutes. So if you want to view the most recent data, you should look at Snowsight.
Visualizing your query history helps you identify long-running or resource-intensive queries. For example, you could filter by Warehouse to narrow down your investigation, then sort queries by CREDITS_USED to identify the most resource-intensive queries. Since Snowflake charges for compute based on credits, this metric directly correlates with costs. Then, you could optimize these high-credit-consuming queries by, for example, rewriting SQL, improving joins, or implementing clustering keys on frequently queried columns.
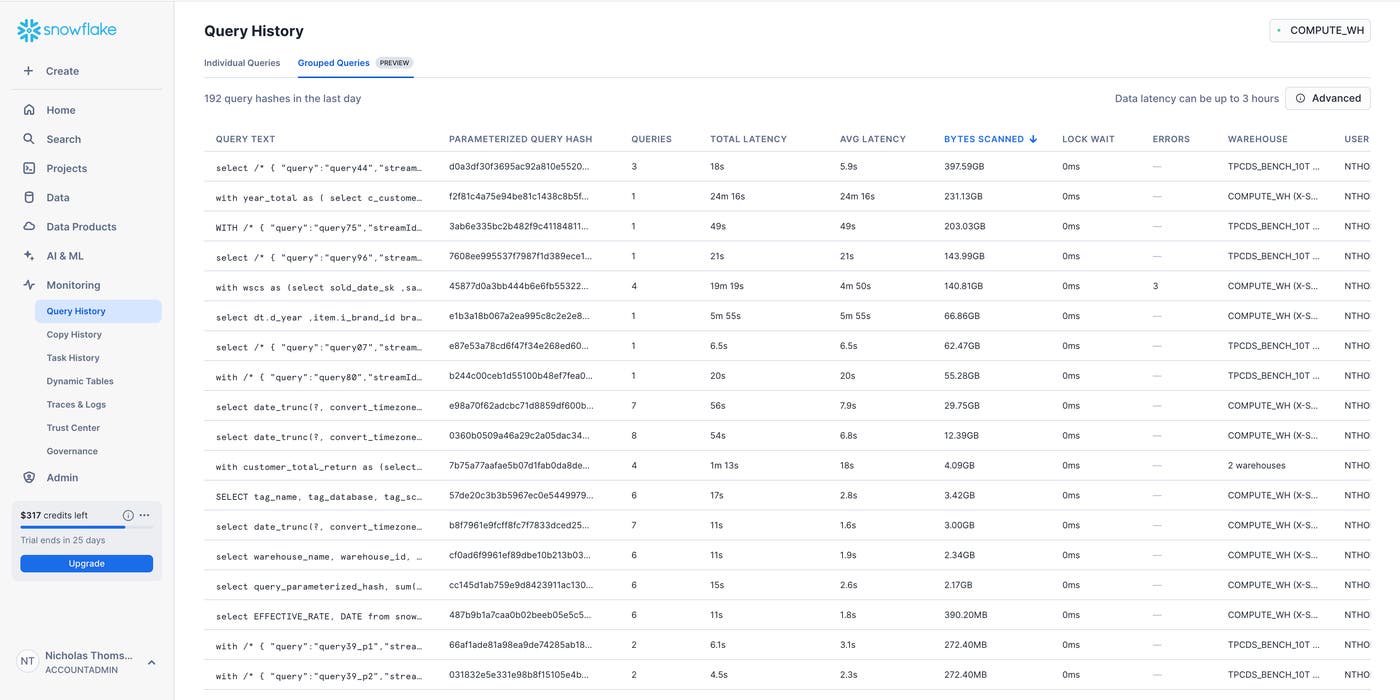
Snowsight’s Grouped Queries feature aggregates and organizes queries by common attributes (such as query type, user, warehouse, database, or table) and surfaces the group’s query hash. This visibility helps identify patterns and trends, allowing you to optimize query performance and resource usage. For example, you can use Grouped Queries to spot inefficiencies in query design, such as queries scanning large amounts of unnecessary data.
First, group queries by BYTES_SCANNED to identify those processing large data volumes. Once you’ve isolated the most expensive query groups, you can optimize them to retrieve only the necessary columns and rows by, for example, using WHERE clauses to filter data early and minimize scans. You might also consider table clustering to pre-aggregate frequently queried data.
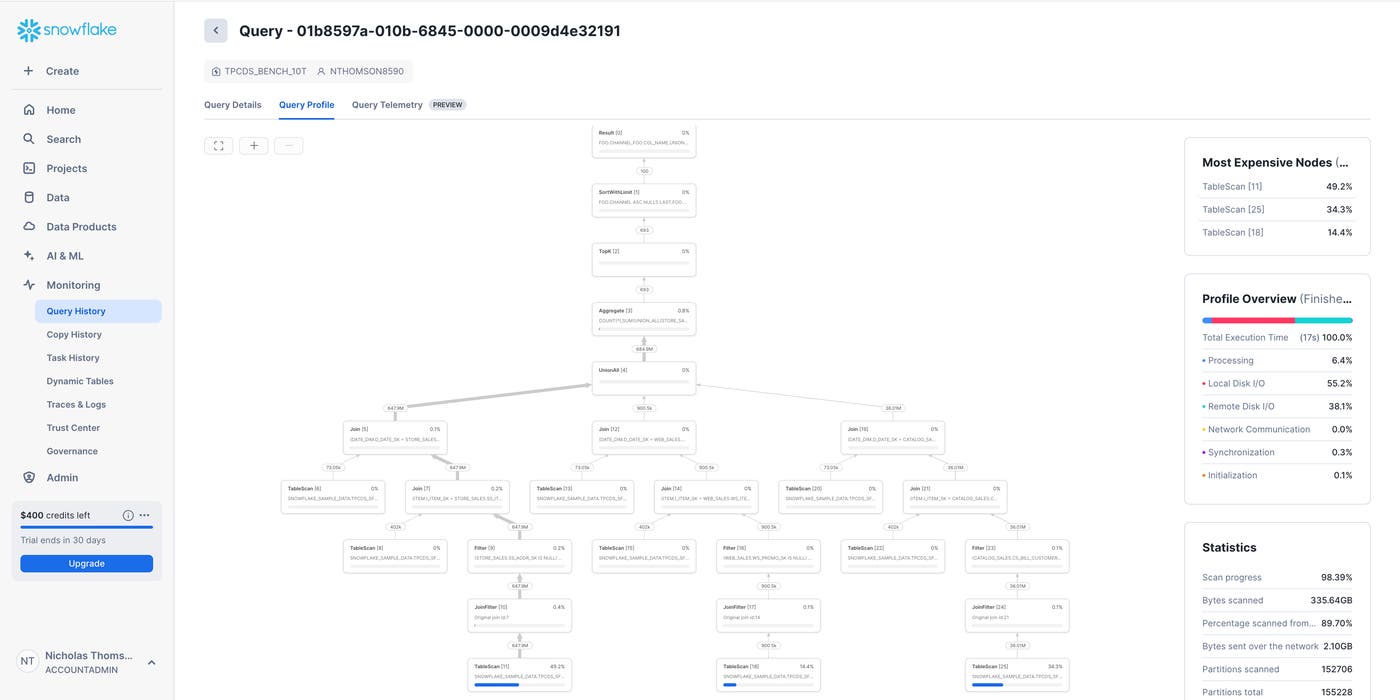
Snowsight’s Query Profile tool visually breaks down each query’s execution plan, showing resource utilization at each step. It helps identify bottlenecks and improve query performance. For example, you can use Query Profile to understand a query’s execution plan.
The Query Profile breaks down the execution plan into stages (e.g., SCAN, FILTER, JOIN, AGGREGATE) and shows how data flows through the query. You can examine the sequence of operations to identify unnecessary steps or inefficiencies, as well as expensive operations such as large table scans or joins with a high number of input or output rows. To optimize performance, you can simplify query logic where possible and ensure that filters are applied early to reduce the data volume passed to subsequent stages.
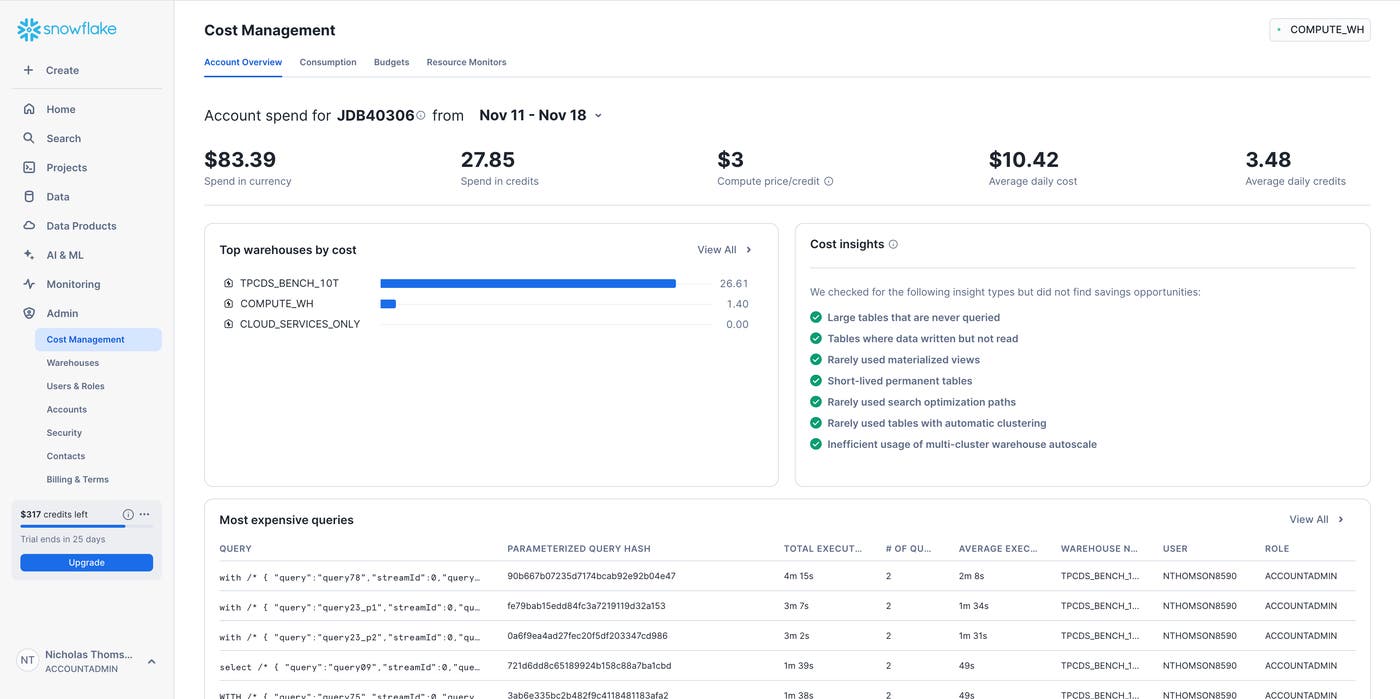
Snowsight allows you to get a high-level overview of your organization’s spend with the Cost Management dashboard by highlighting top warehouses by cost, and surfacing insights, such as large tables that are never queried, tables where data is written but not read, rarely used views, and more. For example, a SysAdmin could use this dashboard to right-size virtual warehouses to balance performance and cost by comparing credit usage against query execution times to identify oversized or underutilized warehouses. If they notice a large warehouse is running lightweight queries, they can resize it to medium to save costs without sacrificing performance.
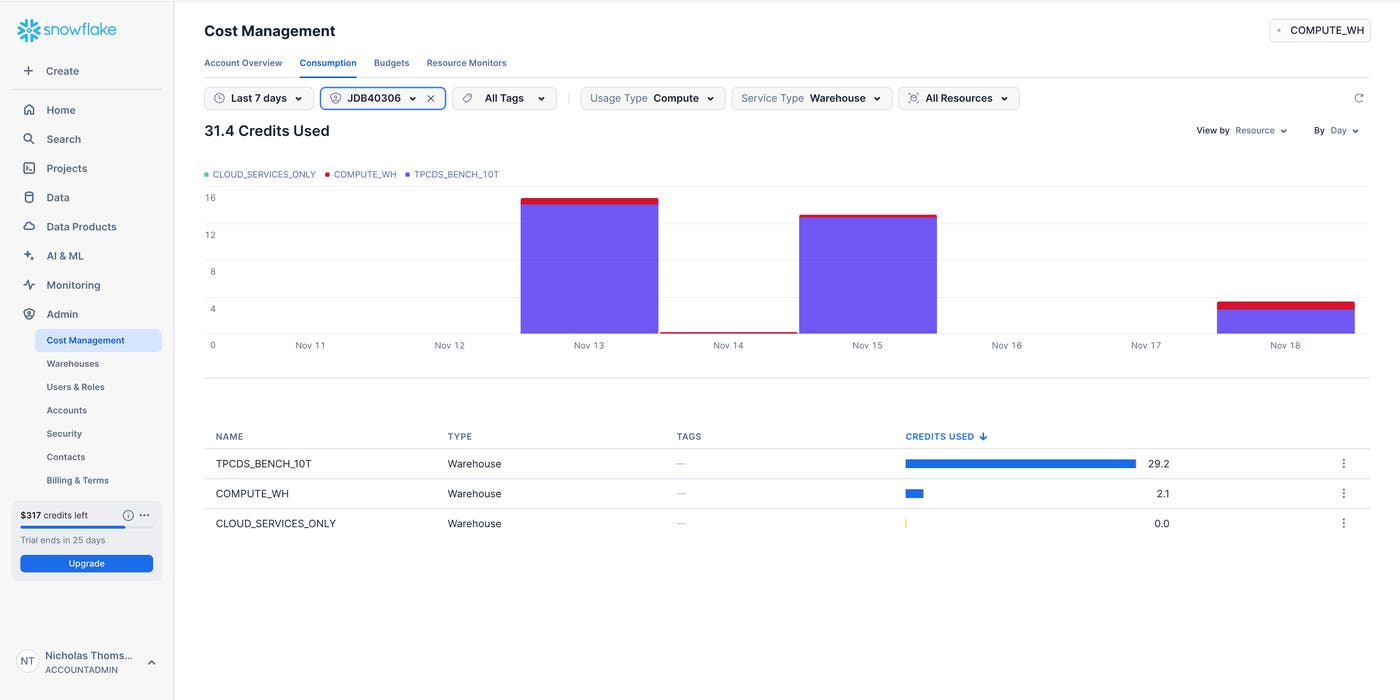
The Consumption dashboard shows you the overall cost of running Snowflake within a given time period. For example, a SysAdmin could use the Consumption dashboard to monitor credit consumption trends by warehouse, time period, or user to identify patterns and peaks in usage. If they notice a spike in credit consumption during specific hours, they could investigate workloads running during that time and reassign them to smaller warehouses or off-peak hours.
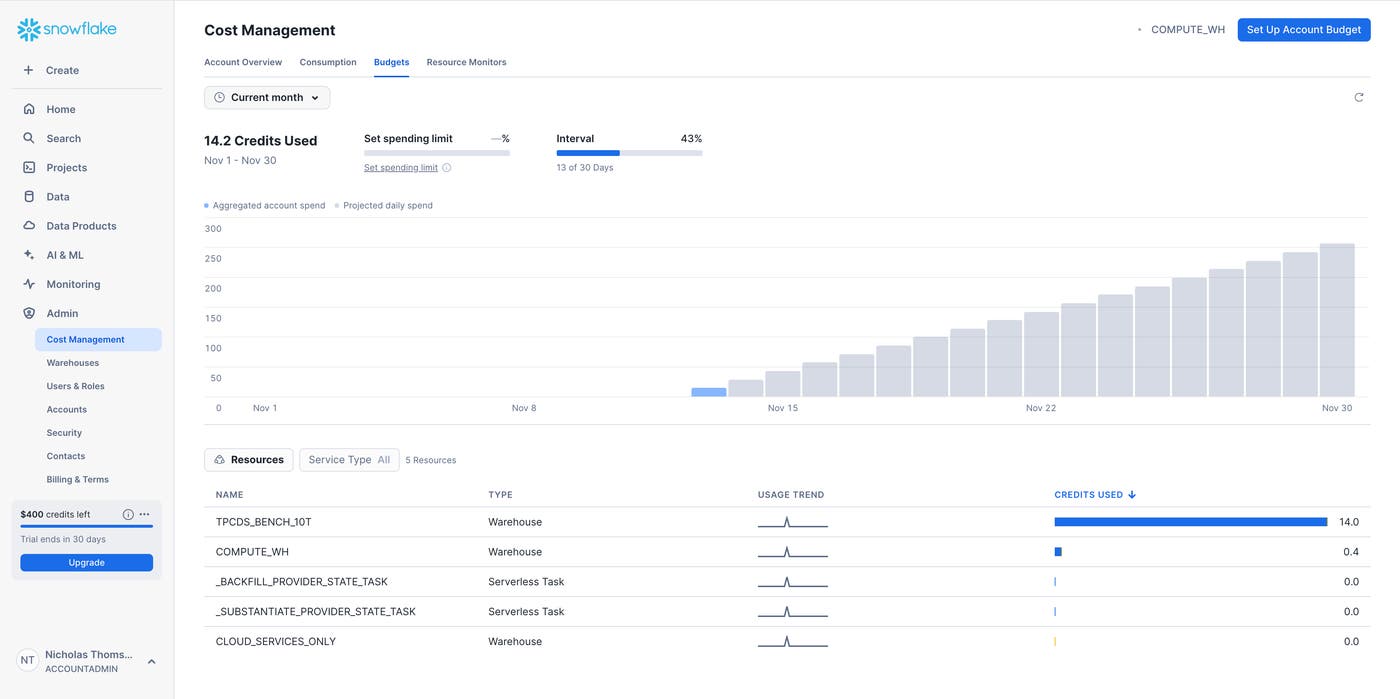
The Budgets view within the cost management dashboard allows users to define budget thresholds for teams or workloads to prevent unexpected costs. You can use resource monitors to set limits on credit consumption for specific warehouses or roles and configure alerts or automatic suspension when budgets are exceeded. For example, if a marketing analytics warehouse is capped at 1,000 credits per month, a SysAdmin can use the Budgets view to track its usage. If the warehouse exceeds the limit, the SysAdmin can navigate to the Warehouses tab under Admin, select the warehouse, and suspend it.
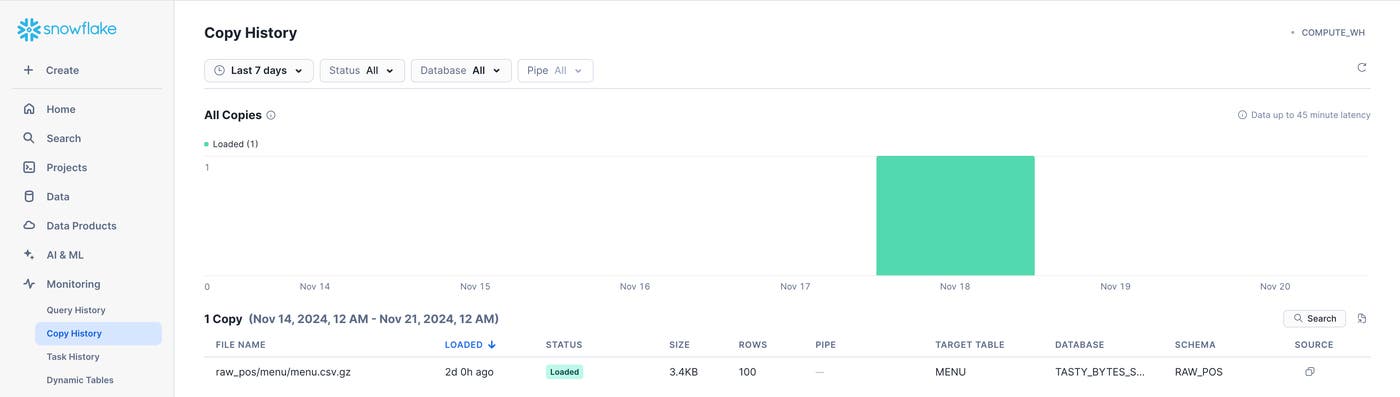
It’s important to monitor data ingestion into Snowflake to ensure data pipelines are running smoothly and to identify and resolve issues in the loading process. You can monitor data loading either by querying the COPY_HISTORY view in the ACCOUNT_USAGE schema, or in Snowsight under Monitoring and Copy History. The Copy History view shows you the history of your data loading (for the past seven days by default), surfacing data such as file name, loaded timestamp, status, database, schema, table, pipe, size, rows, and location.
Monitoring data loading is critical for timely analytics and downstream processes. For example, say you’re a SysAdmin monitoring data loading from an IoT service. You notice multiple failed COPY INTO commands, which are causing the downstream analytics service to produce faulty results based on stale data. Upon further investigation into the COPY INTO commands, you find data schema mismatches and work with data engineers to fix the pipeline.
You can use Snowflake resource monitors to manage and control the usage of compute credits in Snowflake effectively. Resource monitors allow SysAdmins to track credit consumption, enforce usage limits, and trigger alerts or actions when specific thresholds are reached, helping to optimize resource utilization and prevent unexpected costs. For example, a SysAdmin could create a resource monitor with a threshold of 1,000 credits per month for a department’s analytics warehouse. If the warehouse exceeds this threshold, Snowflake will send a notification to the SysAdmin and suspend the warehouse.
Snowflake offers a number of native tools you can use to collect, visualize, and analyze compute, cost, and query metrics. However, teams often use Snowflake in concert with a host of other tools—this can make it challenging to get to the bottom of issues in Snowflake without visibility into the rest of a distributed system. In such cases, it can be helpful to monitor Snowflake data alongside other telemetry, such as backend and cloud infrastructure metrics, which can impact things like query latency, data availability, and more.
In Part 3 of this series, we’ll show you how Datadog gives you visibility into your Snowflake databases—alongside tracing and telemetry from your applications and data from the infrastructure that they run on—in one unified platform.
此内容由惯性聚合(RSS阅读器)自动聚合整理,仅供阅读参考。 原文来自 — 版权归原作者所有。