


AWS Fargate provides a way to use AWS container orchestration services—Amazon Elastic Container Service (ECS) and Amazon Elastic Kubernetes Service (EKS)—without needing to provision and maintain the infrastructure that runs your containers. Fargate is similar to serverless container platforms from Google (Cloud Run) and Microsoft (AKS virtual nodes).
Fargate gives you the option of deploying your containerized workloads on scalable, serverless infrastructure managed by AWS, allowing you to focus on delivering business value instead of on capacity planning and other operational issues. You can even run a hybrid workload—with some services running on your EC2 instances and other services on Fargate—to implement the mix of infrastructure that best fits your needs. For example, if you’ve deployed an ECS or EKS architecture on EC2 instances, you can support those legacy services at the same time you deploy newer services on Fargate’s serverless infrastructure.
Monitoring your Fargate clusters can help you understand the performance of your containerized applications. And because Fargate pricing is based on your usage, monitoring Fargate can help you manage costs. In this post, we’ll look at the key Fargate metrics you should monitor in addition to the Amazon ECS and EKS metrics you’re already collecting. But first, we’ll describe how the Fargate serverless container platform works.
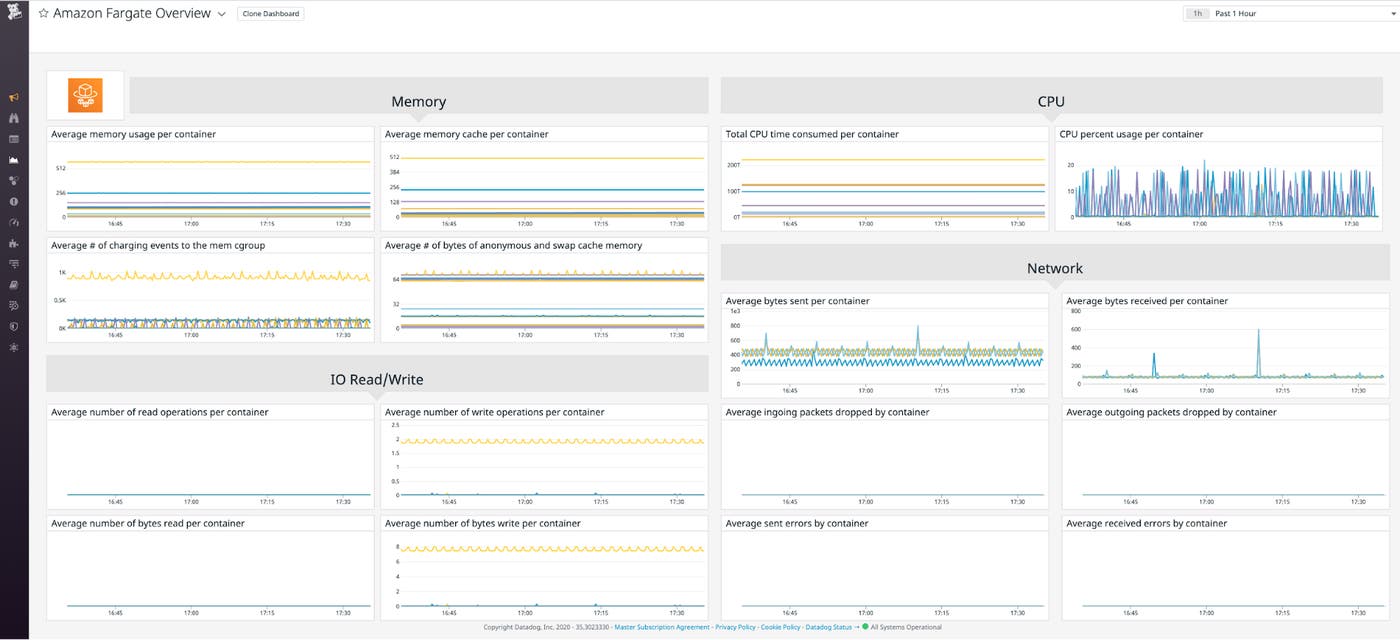
Fargate allows you to combine the benefits of serverless infrastructure—no maintenance, no upfront costs, and improved security—with the scalability and resiliency of containers. In this section, we’ll explain how Fargate works on ECS and EKS, how you specify the resources required to run your workloads, and how you can designate workloads to run on Fargate or on your own EC2 instances. First, we’ll explain how Fargate schedules workloads and scales infrastructure.
To understand how Fargate works, it’s helpful to look at how AWS places your containerized applications onto the infrastructure that will run them—in other words, how they’re scheduled—and how that infrastructure can dynamically scale to accommodate a changing number of containers.
If you’re not using Fargate, you must launch and manage EC2 instances to host your containers. Once you have provisioned those instances, ECS and EKS will schedule the containerized applications you define onto them automatically. When possible, the schedulers place multiple applications onto a single instance to maximize the use of the instance’s resources. Your instances could fill up—run out of available resources—as you deploy new containers to your cluster. If this happens, AWS can automatically add instances if you’ve configured ECS cluster autoscaling or (on EKS) the Kubernetes Cluster Autoscaler.
When you use Fargate, you don’t need to create and manage the EC2 instances that host your containers. Instead, Fargate automatically launches compute resources, which are instances provisioned from a Fargate-specific fleet. These compute resources are owned and managed by AWS; they’re not created within your account and do not run in your VPC. Fargate schedules a single workload on each compute resource it creates, which is sized specifically for that workload. Fargate workloads are isolated from one another—they do not share a kernel or any infrastructure resources (i.e., memory, CPU, or networking) with any other workloads.
The diagram below illustrates the differences between how AWS schedules new workloads onto an EC2-backed cluster (on the left) and a Fargate-backed cluster (on the right).

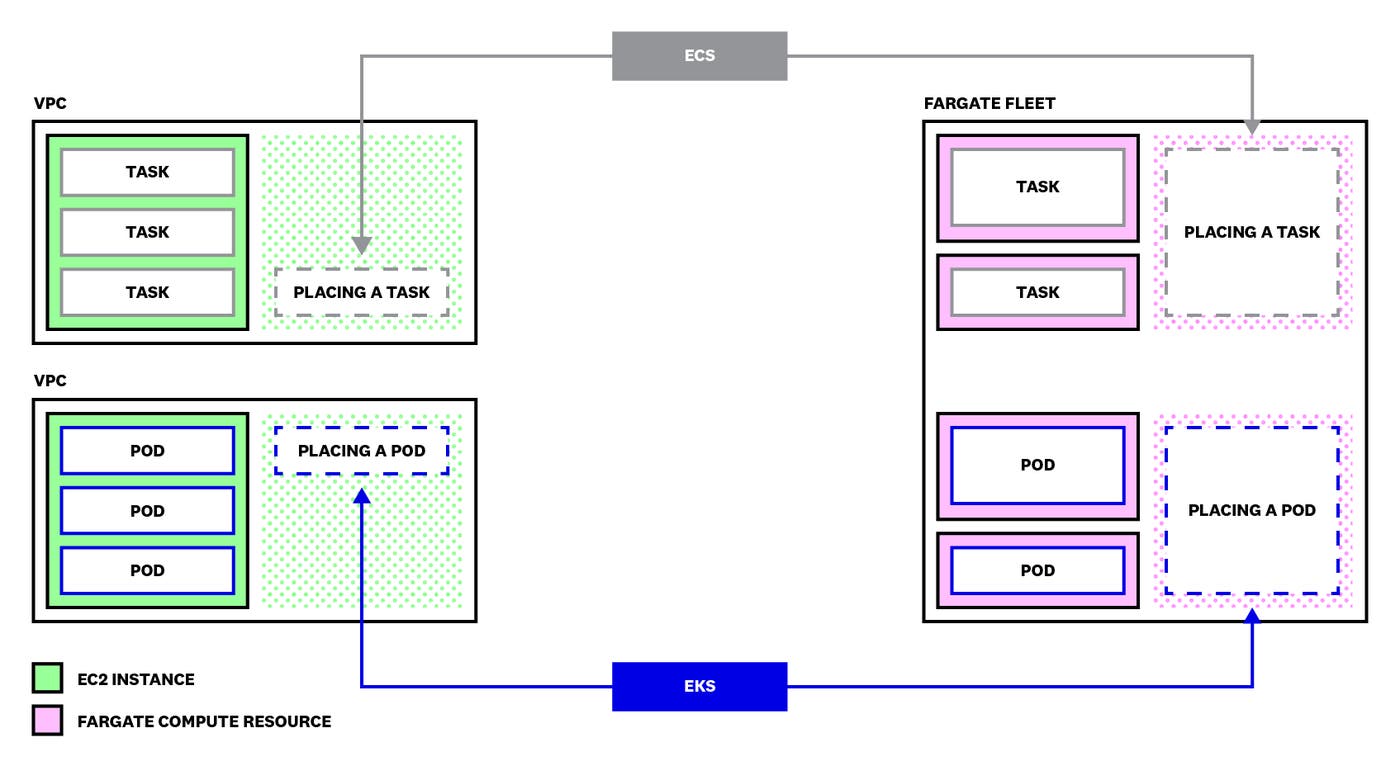
The left side of the diagram shows the container orchestrators—ECS at the top of the diagram and EKS at the bottom—placing containerized applications onto the EC2-backed cluster. If the orchestrator cannot locate an EC2 instance that has resources available to accommodate the new workload, it will not be able to schedule the workload (unless you have configured the cluster to use autoscaling). Each EC2 instance costs a flat hourly rate regardless of the number of containers the scheduler has placed there.
The right side of the diagram shows the orchestrators placing new workloads onto Fargate infrastructure. Fargate automatically creates a new, custom-sized compute resource to accommodate each new workload it schedules. This way, Fargate avoids running any unused or underutilized compute resources.
The general differences we’ve discussed in this section between EC2-backed containers and Fargate-backed containers apply to both ECS and EKS. In the next two sections, we’ll look at specifics of how Fargate supports each of these services, paying particular attention to how Fargate provisions the resources necessary to run your workloads.
Amazon ECS is a container orchestration service that helps you manage the configuration and lifecycle of your containers. ECS runs in the AWS cloud and is integrated with many other AWS services. If you’re running Linux containers, you have the option to launch ECS workloads onto Fargate compute resources, your own EC2 instances, or both—but you can only run Windows containers on EC2 instances.
ECS allows you to group your containers into logical units called tasks. You can launch multiple copies of a task as a service, and ECS will automatically ensure that your desired number of copies is running. Your task definition specifies the details of your task, including the task size—the amount of memory and CPU that your task requires. You must specify these values in the cpu and memory keys of your task definition file, and they must align with one of the combinations listed in the Fargate supported configurations table—otherwise, AWS will return an error.
You can optionally specify container-level resources in the containerDefinitions object within the task definition. This gives you control over how the resources defined for the task are shared among its containers. A memoryReservation value in a container definition represents the minimum amount of memory ECS will make available for the container to use, and a memory value represents the maximum. A container can use more than the amount of memory specified in its memoryReservation if the task has been defined with a larger amount, and if that additional memory is not in use by other containers. A container cannot use more memory than is specified in its memory value; if it tries, ECS will kill the container.
Similarly, you can optionally manage CPU resources at the container level by adding a cpu value to the container definition. This reserves a share of the task’s CPU resources and guarantees that they’ll be available for the container to use. ECS allocates CPU resources as CPU units, which represent shares of a virtual CPU (vCPU). Each vCPU is made up of 1,024 CPU units.
The sum of the CPU reservations of all containers in a task cannot be greater than the number of CPU units specified for the task. This ensures that if all containers were to use 100 percent of their reserved CPU units, they would not exceed 100 percent of the CPU resources available to the task.
If the sum of the CPU reservations of all containers in the task is less than the task-level CPU specification, the remaining units are distributed across the containers in amounts proportional to their container-level reservations. For example, consider a task with 4,096 CPU units specified and two containers: one with a reservation of 2,048 units and one that reserves 1,024 units. Of the task’s remaining 1,024 CPU units, two-thirds (rounded to the nearest integer value—683) would be made available to the first container, and 341 units would be made available to the second container.
This increases the number of CPU units guaranteed for each container: the total number of units available to a container is the sum of its container-level reservation plus its share of any unallocated task-level CPU reservation.
Any time there are unused CPU units within the task (i.e., if other containers are using less than their reserved number of CPU units), a container may use more than its reservation. If a container does not reserve a share of the task’s CPU resources, it must compete with other containers for unused CPU units.
When you create an ECS cluster, you can designate a capacity provider to specify the type of infrastructure on which your tasks will run: your own EC2 instances, Fargate, or Fargate Spot, which makes Fargate infrastructure available at a reduced (but variable) price determined by market demand. You can combine multiple capacity providers in a capacity provider strategy and assign a weight to each capacity provider to determine the mix of infrastructure that will support your cluster. (Capacity providers are an alternative to ECS launch types, which you can also use to specify the infrastructure on which your cluster will run.) For more information about capacity providers, see the ECS documentation.
Amazon EKS is a managed Kubernetes service. It’s integrated with services like AWS Identity and Access Management (IAM) and Amazon Elastic File System (EFS), and you can host your containers on EC2, Fargate, or both.
EKS is certified as a Kubernetes-conformant product, and it includes the standard Kubernetes components and features, so it’s easy to bring existing Kubernetes workloads and experience to EKS.
A cluster is a group of instances which communicate with the same Kubernetes API server. Each Fargate compute resource runs a single pod, which is a collection of one or more containers. A Deployment defines a logical collection of pods, and Kubernetes automatically replaces pods in a Deployment if they become unavailable. You can use a Kubernetes Service to assign a stable IP address for a group of pods that make up a single application, even as the addresses of pods themselves change as Kubernetes replaces failed pods.
It’s helpful to note that DaemonSets—which ensure that a replica of a designated pod is running on all nodes in your cluster—are not supported by Fargate.
When you define a pod in EKS—just as in Kubernetes—you can specify the amount of memory and CPU to be made available for each container in your pod. You specify these amounts in your Kubernetes manifests as requests (which set the minimum amount to be made available for each container to use) and limits (which set the maximum).
If a container in an EKS cluster tries to use more memory than is allowed by its limit, Kubernetes may terminate the container.
In EKS, you can create one or more Fargate profiles, which specify selectors—a namespace and zero or more labels—that determine which pods in your cluster will run on Fargate. Once you’ve associated a Fargate profile with your EKS cluster, AWS automatically detects which pods match the ones you’ve specified in your profile, and launches them on Fargate.
When AWS launches a pod on Fargate, it selects a compute resource from its Fargate fleet with the configuration that best matches the resource requirements of the pod to be scheduled. To determine the proper amount of memory, Fargate selects the larger of two values:
the memory request of the pod’s largest init container
the sum of the requests of all of its application containers
After that calculation, Fargate automatically adds 256 MB of memory to run the Kubernetes components (e.g., kubelet), then rounds up to the nearest memory value in the Fargate pod configuration table.
For example, consider a pod comprised of an init container whose memory request value is 2 GB, and two application containers: an NGINX container with a memory request of 1 GB and a Redis container with a memory request of 3 GB. Fargate would select a resource combination whose memory value is nearest to (but not lower than) 4.25 GB—the sum of the application containers’ memory requests plus 256 MB. Fargate would launch a compute resource with 5 GB of memory to run this pod.
CPU resources are selected similarly, based on the request values in your pod specification and rounded up to the nearest CPU value in Fargate’s list of supported configurations.
If you do not specify memory or CPU requests for any of your containers, your pod will be launched on a compute resource with the smallest available resource allocation.
So far, we’ve looked at how Fargate functions as a serverless infrastructure layer for both ECS and EKS, and how you can specify Fargate compute resources for each ECS task or EKS pod. You need to monitor the amount of memory and CPU your workloads are actually using to ensure that they’re not overprovisioned and that they have sufficient resources to run reliably. Monitoring Fargate will also help you understand costs, which are determined by the number of tasks or pods you run, the amount of time you run them, and the memory and CPU allocated to each compute resource.
In this section, we’ll use metric terminology we introduced in our Monitoring 101 series, which provides a framework for metric collection and alerting. We’ll focus on metrics in these categories:
Memory metrics
CPU metrics
Cluster state metrics
Other metrics
Many of the metrics in this section come from CloudWatch Container Insights, the Kubernetes Metrics Server, and kube-state-metrics. In Part 2 of this series, we’ll examine these and other tools you can use to gather metrics from your Fargate-backed ECS and EKS containers.
Your ECS task definitions and EKS pod specifications designate the minimum available and maximum allowable amounts of memory for your workload to use. Monitoring the memory usage of your tasks and pods can help you understand whether you’ve specified an appropriate range of memory to be used by your workloads.
If you’ve underprovisioned resources, your cluster may not perform well due to resource constraints. On the other hand, if you’ve overprovisioned resources, you could end up paying more for Fargate than necessary.
| Name | Description | Metric type | Availability |
|---|---|---|---|
| ECS memory utilization | The amount of memory used by tasks in the cluster, in bytes | Resource: Utilization | ECS Container Insights |
| ECS memory reservation | The amount of memory reserved by tasks in the cluster, in bytes | Resource: Other | ECS Container Insights |
| EKS memory utilization | The percentage of the Fargate compute resource’s available memory that’s in use | Resource: Utilization | Kubernetes Metrics Server |
| EKS memory request | The amount of memory requested by the container, in bytes | Resource: Other | Kubernetes Metrics Server |
| EKS memory limit | The memory limit specified for the container, in bytes | Resource: Other | Kubernetes Metrics Server |
| EKS memory allocatable | The amount of allocatable memory on this Fargate compute resource, in bytes | Resource: Other | Kubernetes Metrics Server |
By monitoring the memory utilization of your ECS tasks and the containers in your EKS pods, you can determine whether any of the memory in your Fargate compute resources is going unused. If your workload is consistently using less than its minimum memory allocation, you should consider reducing the memoryReservation value specified (or the memory value if you haven’t specified memoryReservation) in the ECS task definition, or the request value in the container definition(s) in your EKS pod specification. This could cause Fargate to shift the workload to a smaller compute resource, reducing your Fargate costs without affecting the performance of your application.
You can also create an alert to proactively notify you if your tasks’ or pods’ memory utilization approaches the available limit. Applications can experience memory constraints for various reasons. For example, a Java app’s JVM or a React app with an SSR memory leak can consume increasing amounts of memory. Creating an alert that triggers when your application reaches 80 percent memory utilization will give you enough time to raise the limit or troubleshoot the containerized application before your workload suffers an out-of-memory (OOM) error.
Your ECS task definitions include an amount of CPU to be used by each task and, optionally, by each container in your workloads. Similarly, your EKS pod specifications can include resource requests and limits for individual containers. The size of the compute resource Fargate launches is based on the resources you designate for your tasks and containers, so it’s important to monitor CPU utilization to ensure that you’ve designated the right amount of CPU resources for your workloads.
You should monitor CPU utilization to ensure that any spikes in your workload won’t breach your defined CPU limits. If you create an alert that triggers when your tasks or pods consume more than 90 percent of available CPU, you can prevent throttling, which could slow down your application.
You can also alert on low CPU utilization to reduce costs. If it’s consistently below 50 percent, you should consider revising your task definition or container spec to decrease the number of CPU units you’re specifying, which can help you avoid paying for unused resources.
Cluster state metrics convey how busy your cluster is and help you monitor the lifecycle of your tasks and pods. You can use the following metrics to monitor your cluster’s performance and resource utilization, and to spot any workloads that should be running but aren’t.
| Name | Description | Metric type | Availability |
|---|---|---|---|
| ECS current task count | The number of tasks in the cluster currently in the desired, running, or pending state | Other | ECS Container Insights |
| ECS service count | The number of services currently running in the cluster | Other | ECS Container Insights |
| EKS current pod count | The number of currently available pods in the Deployment | Other | kube-state-metrics |
| EKS desired pod count | The number of desired pods in the Deployment | Other | kube-state-metrics |
AWS enforces a quota that limits the number of tasks and pods you can run concurrently: the number of ECS tasks you’re running on Fargate plus the number of EKS pods you’re running on Fargate can’t exceed 100 per region. You should create an alert to notify you if the combined count of Fargate tasks (ECS) and pods (EKS) approaches this limit so you can evaluate your need for new and existing workloads and avoid errors launching new pods.
Fargate is elastic, and it will provision a compute resource to run any new task or pod you launch. But there are some circumstances that could prevent Fargate from launching your desired tasks or pods.
If you have an error in the YAML file that defines your pod, for example, EKS will return an error and your pod won’t be created. Comparing the desired counts of your tasks or pods against the current count lets you spot any disparities before they affect the functionality of your application. For more information about monitoring the state of your clusters—and for an exploration of even more key metrics—see our blog posts on monitoring ECS and EKS.
The metrics that we’ve presented in the previous sections provide visibility into the performance, activity, and resource utilization of your Fargate-backed cluster. To fully understand your Fargate metrics, you also need to monitor the applications that back the services that your cluster makes available (e.g., NGINX, Redis, and PostgreSQL), as well as the performance of your cluster’s storage and network.
Both ECS and EKS support Amazon EFS for persistent storage. You can collect EFS metrics for visibility into your containers’ storage activity. See the AWS documentation for more information about using EFS with ECS and EKS.
Both ECS and EKS emit network metrics so you can monitor the number of bytes transmitted and received. For a deeper look at your cluster’s networking, you can also use VPC Flow Logs. When Fargate launches a compute resource from its fleet, it attaches an elastic network interface (ENI) that handles your workload’s network traffic—e.g., pulling container images and receiving requests to your service. This ENI exists in your VPC, so you can optionally use VPC Flow Logs to collect and query data about its networking activity. See the AWS documentation for more information about using VPC Flow Logs with ECS and EKS.
In this post, we’ve shown you the key metrics you need to monitor to fully understand the health and performance of your Fargate cluster. For more information, see our blog posts about monitoring ECS and EKS applications. Coming up in Part 2, we’ll look at some of the tools you can use to collect and analyze Fargate metrics and logs.
We would like to thank Jonah Jones at AWS and Kyle Allen at CBT Nuggets for their technical review of this post.
此内容由惯性聚合(RSS阅读器)自动聚合整理,仅供阅读参考。 原文来自 — 版权归原作者所有。