







In Part 1, we introduced a number of key metrics that you can use for ECS monitoring. Monitoring ECS involves paying attention to two levels of abstraction: the status of your services, tasks, and containers, as well as the resource use from the underlying compute and storage infrastructure, monitored per EC2 host or Docker container.
In this post, we’ll survey some techniques you can use to monitor both levels of your ECS deployment:
The Amazon CloudWatch console
The AWS CLI
Using a third-party monitoring tool that queries CloudWatch and the ECS API
Tools for monitoring Docker
Amazon CloudWatch is the built-in monitoring solution for AWS. ECS submits metrics to CloudWatch, and CloudWatch makes these metrics available for analytics, visualization, alerting, and Auto Scaling. Note that CloudWatch does not surface metrics for the status of your services, tasks, or containers, so we’ll show you how to use the AWS CLI to query this information from the ECS API.
Before proceeding, make sure you’ve used AWS Identity and Access Management (IAM) to create a role and delegate permissions to access CloudWatch and the ECS API.
We’ll focus on four ways to use the CloudWatch console for ECS monitoring:
Creating graph widgets
Configuring CloudWatch alarms
Tracking the number of running tasks
The ECS-specific resource metrics we explored in Part 1 come from CloudWatch, as do resource metrics for EC2 instances.
In the CloudWatch console, the “Metrics” tab shows a searchable list of metrics from all of the AWS services that are currently running. If you click one of the ECS tiles (e.g., “ECS > ClusterName, ServiceName”), you’ll see a list of ECS metrics, which you can then filter on a per-cluster or per-service basis, depending on the metric.
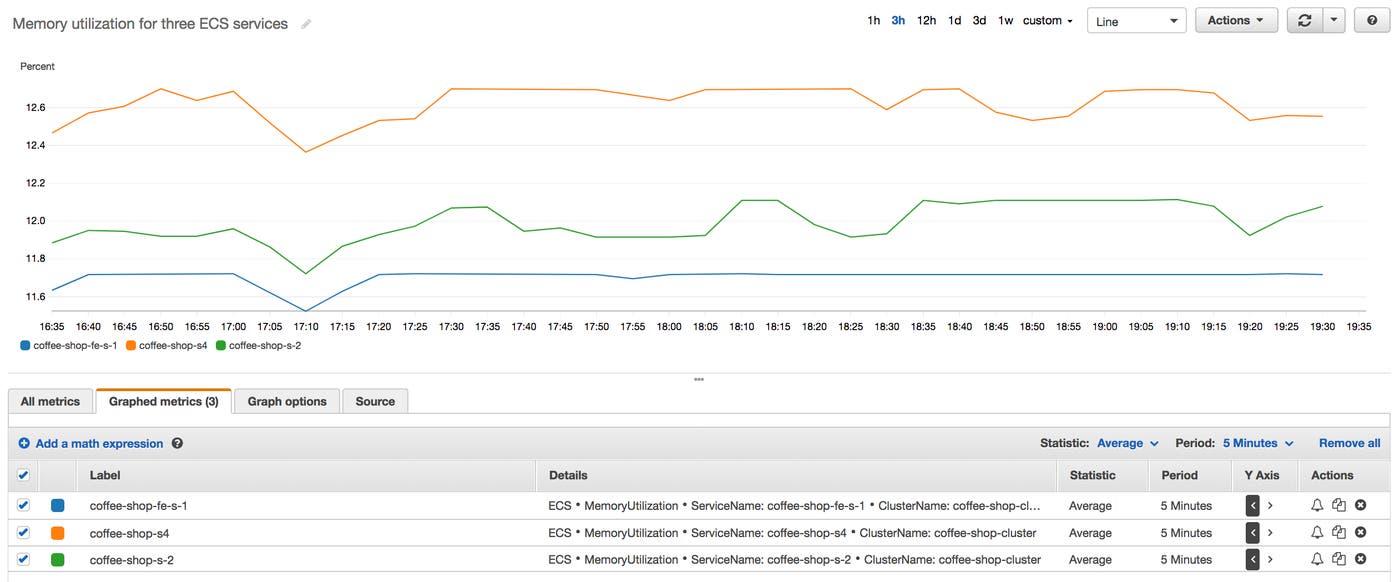
Once you select a metric, you’ll see it plotted in the graph widget at the top of the CloudWatch console. You can plot multiple metrics within the same graph, and add metrics from other AWS services by clicking the “All metrics” tab, clicking “All,” and choosing a service.
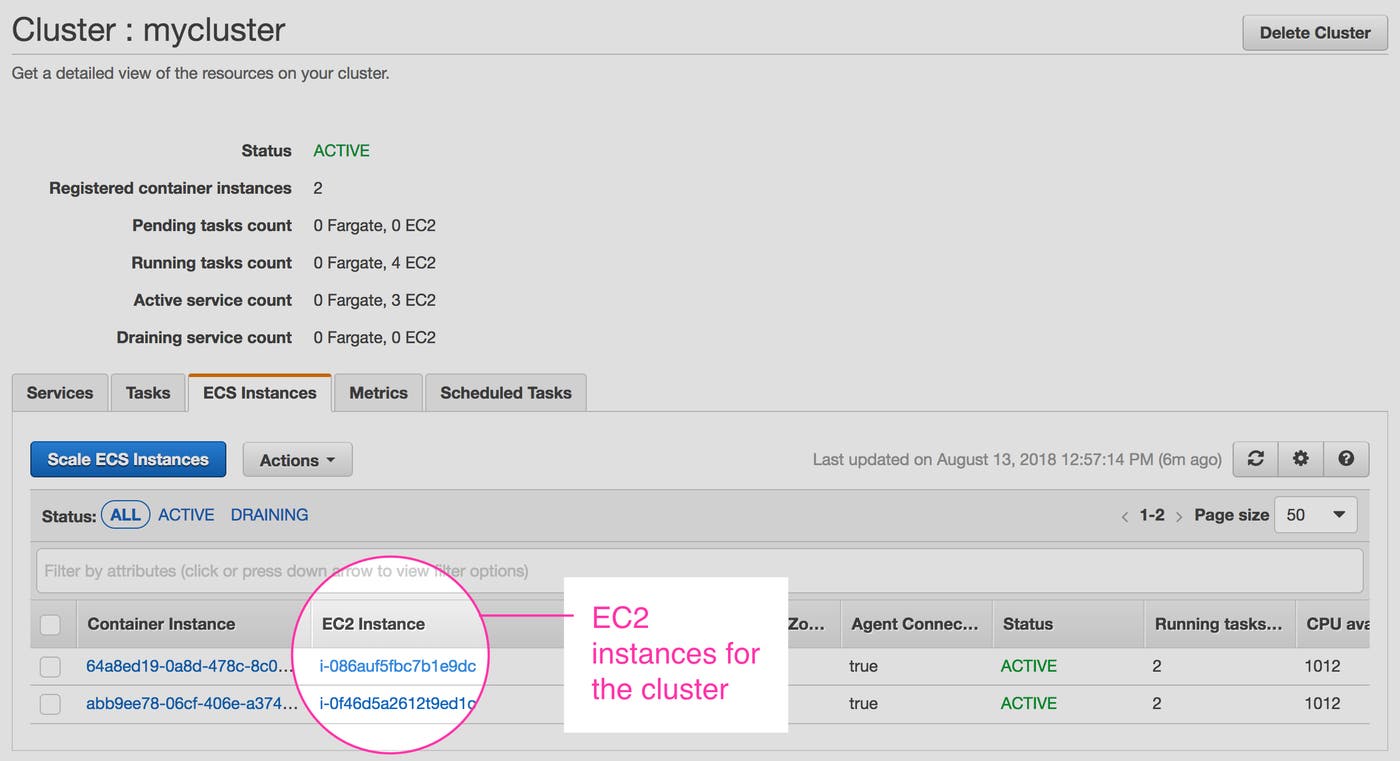
If you’re plotting metrics from ECS tasks deployed with the EC2 launch type, you’ll need to identify the EC2 instances running your ECS tasks. You can find this information in the ECS console (to get there, click on “ECS” in the “Services” dropdown menu). The ECS console displays a summary of each cluster, along with information about how many tasks and services are deployed to Fargate and EC2. If you click on a specific cluster, you can see the names of the EC2 instances hosting that cluster’s tasks and services.
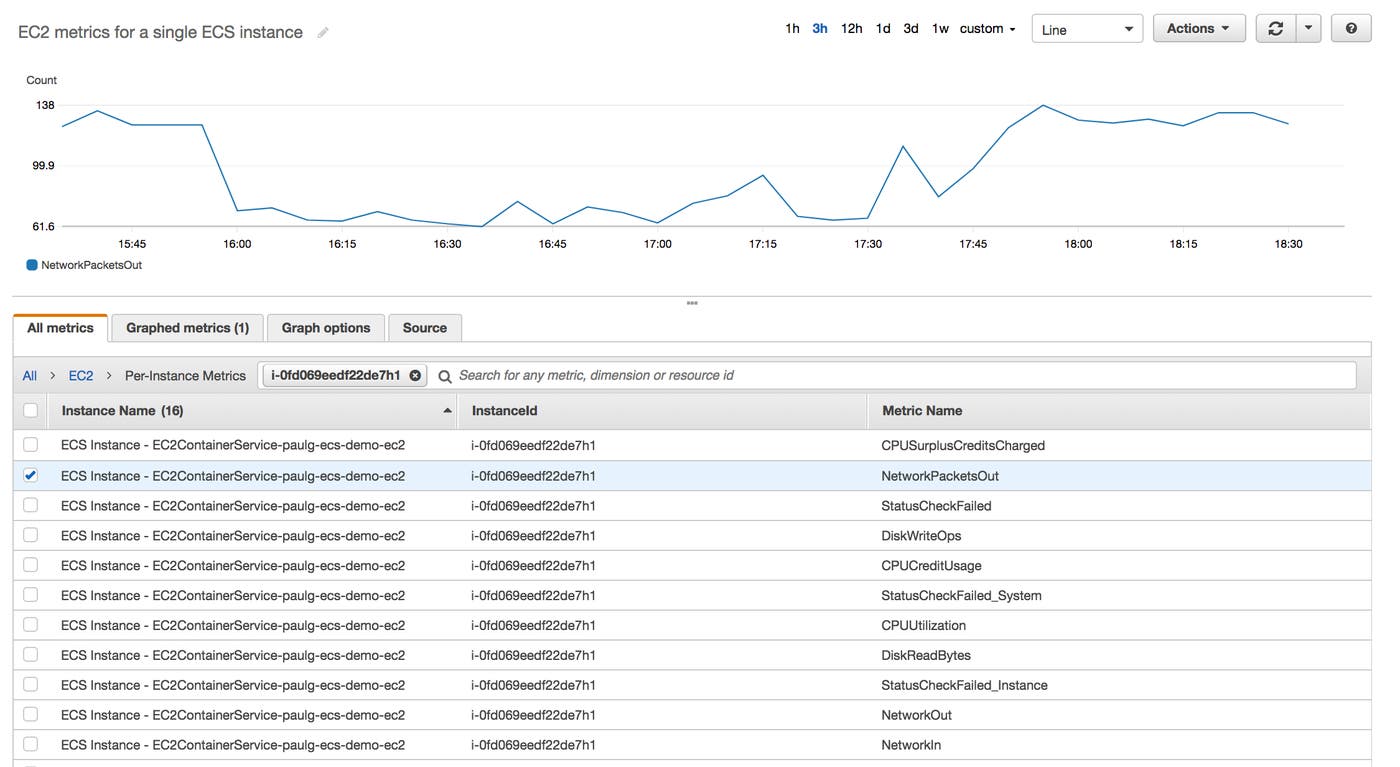
Once you know an instance’s ID, you can search for metrics from that instance within CloudWatch. Paste the instance’s name into the search box within the “Per-Instance Metrics” view of the CloudWatch console. You can then create a widget to graph metrics for that instance (and add the graph widget to a CloudWatch dashboard, if desired).
You can set a CloudWatch alarm to take action when a metric exceeds a threshold over a particular period of time. Below, we’re setting a CloudWatch alarm to trigger when an ECS service’s average CPU usage reaches or exceeds 50 percent over a five-minute interval. CloudWatch can then notify your team or prompt an Auto Scaling group to launch or terminate instances.
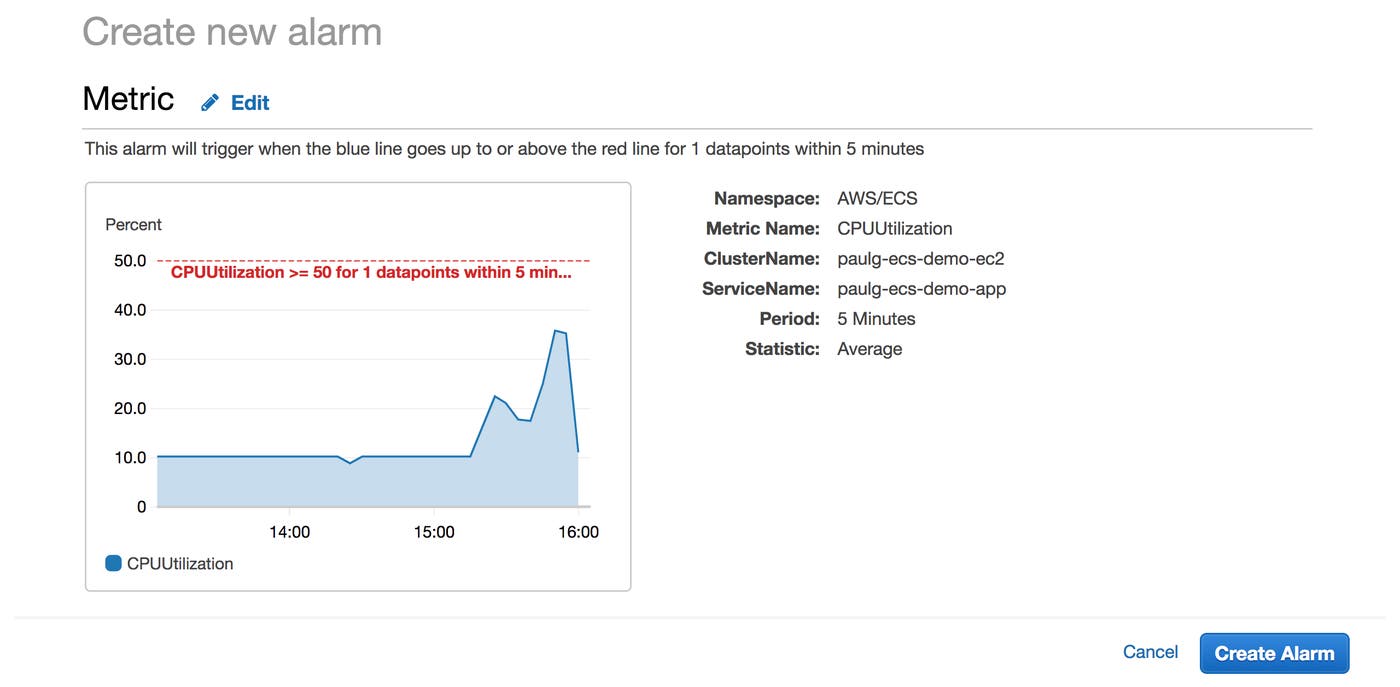
CloudWatch alarms are especially useful when managing a cluster in the EC2 launch type, where it’s up to your team to ensure that resource contention isn’t hindering task placement. But CloudWatch alarms can also be useful for notifying you when your Fargate cluster nears 100 percent of its service-level CPU or memory utilization, so you can scale your cluster appropriately.
The CloudWatch console doesn’t include the sort of breakdowns of task status you’d get from the ECS API. However, you can use an indirect method to graph the number of running tasks per ECS service. Navigate to the list of metrics for ECS and choose either CPUUtilization or MemoryUtilization for each service. Within the “Graphed metrics” tab of the CloudWatch console, change the value of the “Statistic” column to “Sample Count” and set the “Period” to “1 Minute” (since ECS sends metrics to CloudWatch every minute) in order to display the number of tasks sending metrics to CloudWatch.
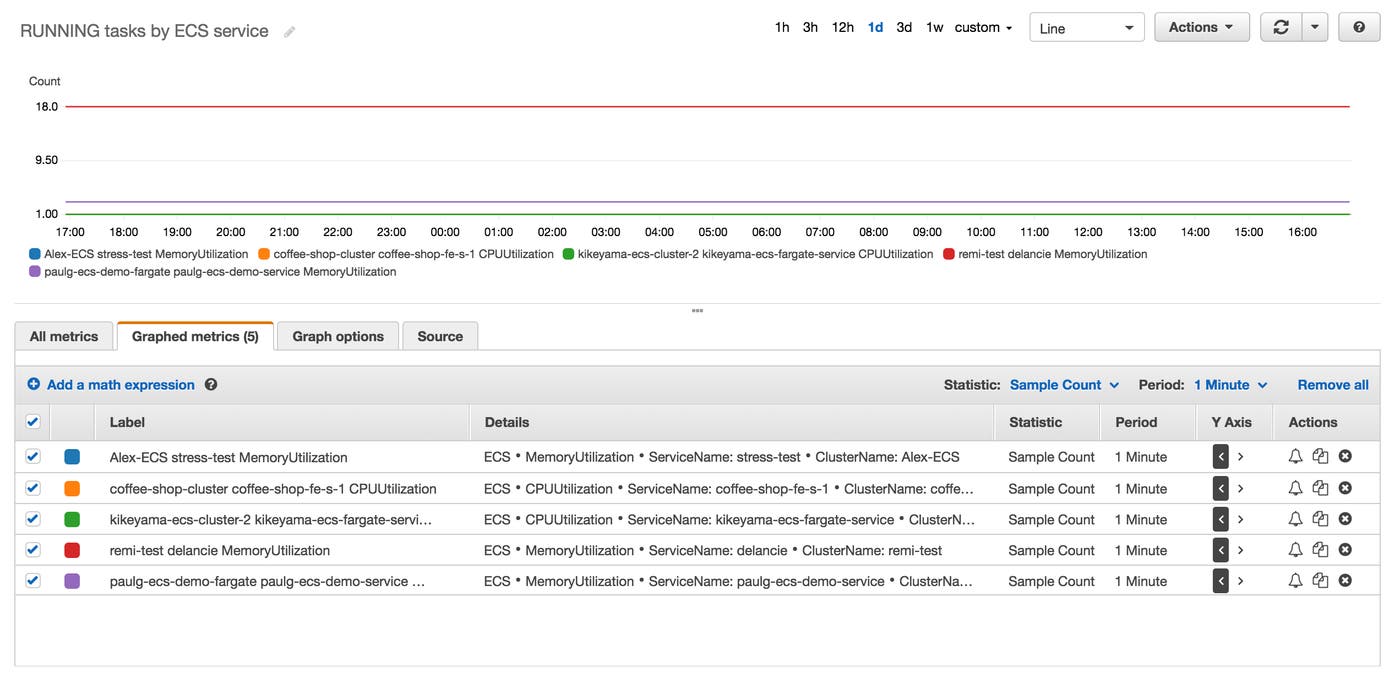
While this approach lets you display the number of RUNNING tasks within a CloudWatch dashboard, it won’t show you the number of PENDING tasks or the status of all your tasks, broken down by cluster. And since task metrics are sent once every minute, only a “Sample Count” plotted at a one-minute granularity can show the number of RUNNING tasks. You can track the status of RUNNING and PENDING ECS tasks at a higher resolution, over a broader time frame, and in a way that lets you store the results, with a third-party monitoring solution. And, as discussed earlier, you can also see the status of ECS tasks and services in the ECS console.
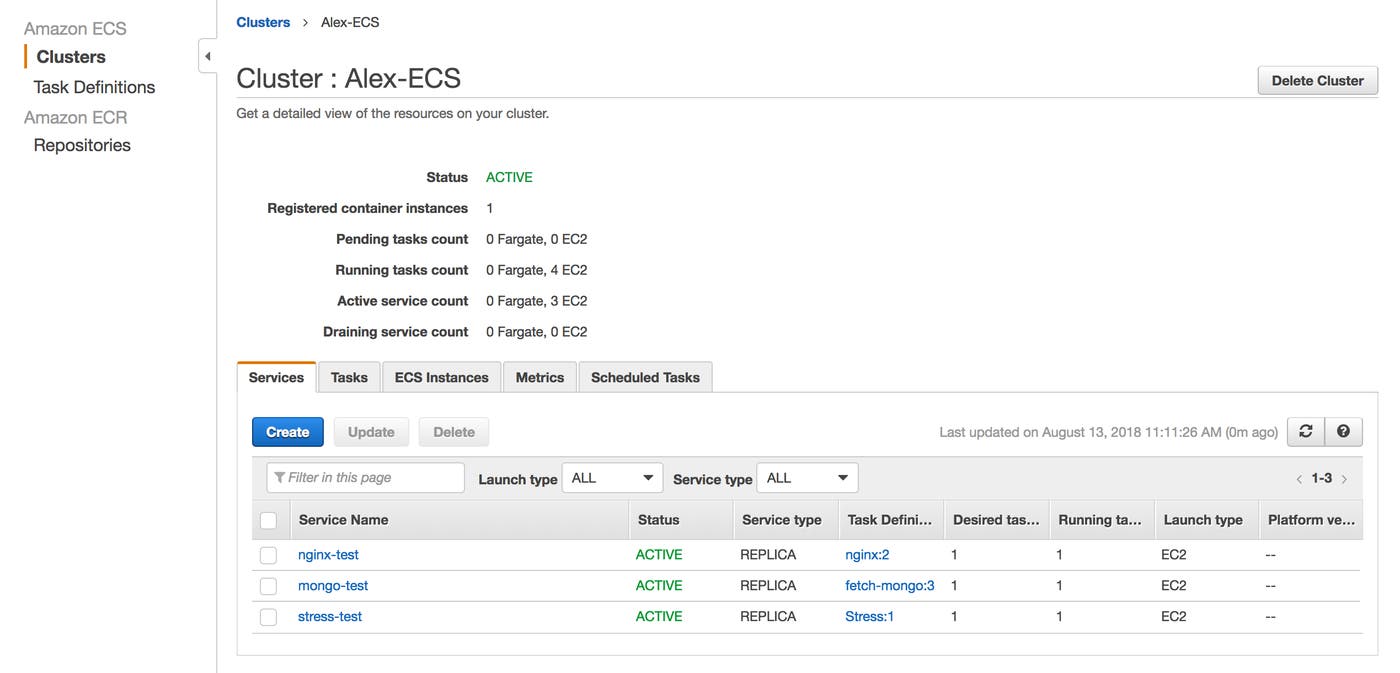
We’ve seen how the ECS console shows the number of tasks and services as well as their status. You might want to display this information in a different format (for example, as an aggregate), or use it when executing shell commands. The AWS CLI lets you query the ECS API for information on the status of clusters, services, and tasks, and gives you another way to access ECS metrics from CloudWatch.
To start using the CLI, install the Python package, run aws configure, and enter the required information, including the access key ID and access key generated for an IAM user with the appropriate permissions.
You can obtain detailed information for a cluster, container instance, service, task, or task definition by running a variation of the ecs describe command:
describe-clusters
describe-container-instances
describe-services
describe-tasks
describe-task-definition
These commands can give you a quick readout of your cluster’s status.
For example, we entered this command to describe a specific service, paulg-ecs-demo-app, which runs on the cluster, paulg-ecs-demo-ec2. Note that if you don’t specify an argument for --cluster, ECS will search for the service within the default cluster it created for you.
aws ecs describe-services --cluster "paulg-ecs-demo-ec2" --services "paulg-ecs-demo-app"
The response to our describe-services command is this:
{
"services": [
{
"serviceArn": "arn:aws:ecs:us-east-2:<AWS_ACCOUNT>:service/paulg-ecs-demo-app",
"serviceName": "paulg-ecs-demo-app",
"clusterArn": "arn:aws:ecs:us-east-2:<AWS_ACCOUNT>:cluster/paulg-ecs-demo-ec2",
"loadBalancers": [],
"serviceRegistries": [],
"status": "ACTIVE",
"desiredCount": 1,
"runningCount": 1,
"pendingCount": 0,
"launchType": "EC2",
"taskDefinition": "arn:aws:ecs:us-east-2:<AWS_ACCOUNT>:task-definition/paulg-ecs-demo-app:32",
"deploymentConfiguration": {
"maximumPercent": 200,
"minimumHealthyPercent": 100
},
"deployments": [
{
"id": "ecs-svc/9223370495842745073",
"status": "PRIMARY",
"taskDefinition": "arn:aws:ecs:us-east-2:<AWS_ACCOUNT>:task-definition/paulg-ecs-demo-app:32",
"desiredCount": 1,
"pendingCount": 0,
"runningCount": 1,
"createdAt": 1541012030.734,
"updatedAt": 1541012030.734,
"launchType": "EC2"
}
],
"events": [
{
"id": "ff7dcbb3-bfdf-4a6d-ac7d-423bbb5ca3d3",
"createdAt": 1541012054.613,
"message": "(service paulg-ecs-demo-app) has started 1 tasks: (task f06d6687-7312-421d-86c7-b6b0bc8f51c4)."
}
],
"createdAt": 1541010911.625,
"placementConstraints": [],
"placementStrategy": [
{
"type": "spread",
"field": "attribute:ecs.availability-zone"
},
{
"type": "spread",
"field": "instanceId"
}
],
"schedulingStrategy": "REPLICA"
}
],
"failures": []
}
You’ll find all of the status-related metrics we discussed in Part 1 within the output of CLI describe commands. The output of describe-services, for example, provides details about the most recent status changes for the service.
You’ll also find the desiredCount, runningCount, and pendingCount of tasks within each service, and the deployments array displays this information for each time you’ve launched a service. You may want to look at this output if you’ve recently updated a task definition, are deploying a service to run tasks from it, and want to see whether the new tasks have been placed successfully.
Another way to collect metrics from your ECS clusters is to use software that does so automatically, making data from ECS available for open-ended visualization, alerting, and historical analysis. In the next part of this series, we will show you how to use Datadog to get full visibility into ECS and more than 1,000 other technologies.
In order to investigate ECS resource use at the container level, you’ll need some way to query metrics from Docker itself. The technique you choose depends on whether you’re using the EC2 or Fargate launch type.
ECS containers are simply Docker containers, and in the EC2 launch type you can view them by accessing your host (i.e., with SSH or RDP) and running the standard docker commands. If you run docker container ls in a container instance via SSH, for example, you’ll see something similar to the following, which includes containers from an ECS task as well as the container for the ECS Agent.
CONTAINER ID IMAGE COMMAND CREATED STATUS PORTS NAMES
4fcf646de1ea redis:latest "docker-entrypoint.s…" About a minute ago Up About a minute ecs-paulg-ecs-demo-app-57-redis-c0b4cca5e880d3b29501
a8d0726059f3 my-flask-app "python app.py" About a minute ago Up About a minute ecs-paulg-ecs-demo-app-57-app-96af82aeea96bded3d00
7d41501f4f7c amazon/amazon-ecs-agent:latest "/agent" 4 weeks ago Up 4 weeks ecs-agent
Consult our Docker monitoring guide to learn about three techniques for collecting Docker metrics: viewing pseudo-files in sysfs, running docker stats, and making calls to a local REST API that runs as part of the Docker daemon. You can use any of these techniques to monitor ECS containers deployed with the EC2 launch type.
The situation becomes trickier with Fargate. Traditional Docker monitoring tools require access to the hosts on which your containers run. However, running an SSH server as part of your container image introduces various complications and security risks. Further, Fargate abstracts away the Docker daemon—rather than execute commands into running containers, you edit container images and name them within task definitions.
In order to collect metrics from Docker containers deployed with Fargate, you’ll need to query the ECS task metadata endpoint, a variation on the Docker API that runs on the ECS backend. If a container sends an HTTP request to the endpoint’s stats path, ECS will return, for each container in a task, the same JSON object you’d receive from a call to the stats endpoint of the Docker API. For version two of the ECS API, the IP address of the task metadata endpoint is static, and containers would send requests to 169.254.170.2/v2/stats. For version three, the URI of the endpoint is the value of the environment variable ECS_CONTAINER_METADATA_URI, which the ECS Agent defines automatically for each container in a task.
When a container sends a request to the ECS task metadata endpoint, ECS identifies the task by the IP of the request, the unique IP the task is assigned within the awsvpc network mode. If you try to query this endpoint from an IP that doesn’t belong to an ECS task, it will return an error: Unable to get task arn from request: Unable to associate '<IP>' with task (arn is short for “Amazon Resource Name”).
You can build a container image that queries the ECS task metadata endpoint automatically, setting the query script as its primary process. A single container within a task can request statistics for all of that task’s containers, so you simply need to name that container image within the task’s definition. The GitHub repository for the ECS Agent includes an example of such a script, written in Go (this script also queries the /metadata path, which returns basic information about a task, such as container names and task status).
You can then configure your Fargate tasks to direct the output of your API calls to a destination of your choice, such as your CloudWatch logs (via awslogs).
In Part 3, we’ll show you how to use Datadog to gather metrics and logs for your Fargate containers automatically.
Getting full visibility into ECS requires keeping track of the status of services, tasks, and containers, along with resource usage at the level of both ECS abstractions (tasks, services, and clusters) and the underlying infrastructure. In this post, we’ve shown you how to use the CloudWatch console to graph and alert on ECS metrics, and how to query the ECS API to get a detailed breakdown of the status of your tasks and services. We’ve also explored how you can collect resource metrics from individual containers, either by using traditional Docker monitoring tools or by querying the ECS task metadata endpoint.
But as you scale your ECS clusters, monitoring all of these sources of data can be complex and time-consuming. In the next part of this series, we’ll show you how to use Datadog to take a more automated, comprehensive approach to ECS monitoring, by unifying metrics, distributed request traces, and logs in a single platform.
We wish to thank our friends at AWS for their technical review of this series.
此内容由惯性聚合(RSS阅读器)自动聚合整理,仅供阅读参考。 原文来自 — 版权归原作者所有。